
Jefferies (JEF)
We’re cautious of Jefferies. Its sales have underperformed and its low returns on capital show it has few growth opportunities.― StockStory Analyst Team
1. News


2. Summary
Why Jefferies Is Not Exciting
Tracing its roots back to 1962 and rebranded from Leucadia National Corporation in 2018, Jefferies Financial Group (NYSE:JEF) is a global investment banking and capital markets firm that provides advisory services, securities trading, and asset management to corporations, institutions, and wealthy individuals.
- Performance over the past five years shows its incremental sales were less profitable, as its 1.8% annual earnings per share growth trailed its revenue gains
- Annual revenue growth of 4.1% over the last five years was below our standards for the financials sector
- High net-debt-to-EBITDA ratio of 34× could force the company to raise capital at unfavorable terms if market conditions deteriorate


Jefferies is skating on thin ice. We see more attractive opportunities in the market.
Why There Are Better Opportunities Than Jefferies


At $35.93 per share, Jefferies trades at 9.6x forward P/E. This sure is a cheap multiple, but you get what you pay for.
Cheap stocks can look like a great deal at first glance, but they can be value traps. They often have less earnings power, meaning there is more reliance on a re-rating to generate good returns - an unlikely scenario for low-quality companies.
3. Jefferies (JEF) Research Report: Q4 CY2025 Update
Investment banking firm Jefferies Financial Group (NYSE:JEF) reported Q4 CY2025 results topping the market’s revenue expectations, with sales up 5.7% year on year to $2.07 billion. Its GAAP profit of $0.85 per share was 10% below analysts’ consensus estimates.
Jefferies (JEF) Q4 CY2025 Highlights:
- Revenue: $2.07 billion vs analyst estimates of $2.01 billion (5.7% year-on-year growth, 3% beat)
- Pre-tax Profit: $253.2 million (12.2% margin)
- EPS (GAAP): $0.85 vs analyst expectations of $0.94 (10% miss)
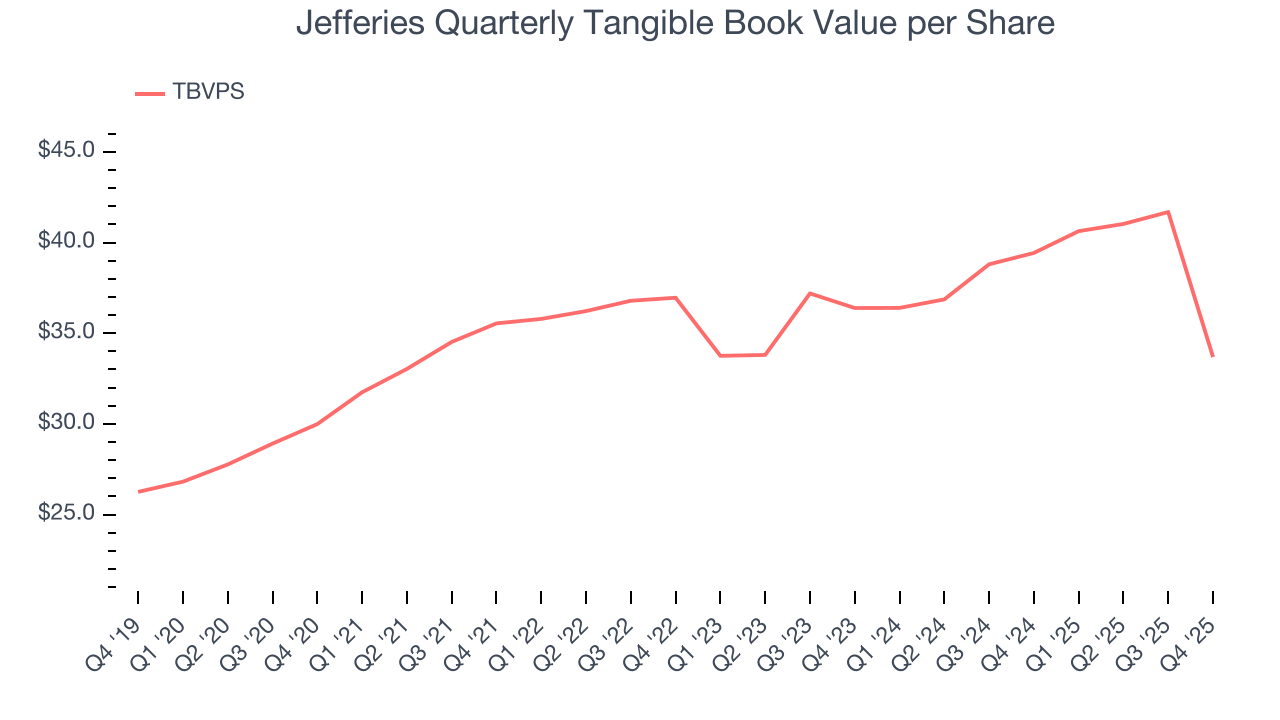
- Tangible Book Value per Share: $33.69 vs analyst estimates of $33.79 (14.6% year-on-year decline, in line)
- Market Capitalization: $13.67 billion
Company Overview
Tracing its roots back to 1962 and rebranded from Leucadia National Corporation in 2018, Jefferies Financial Group (NYSE:JEF) is a global investment banking and capital markets firm that provides advisory services, securities trading, and asset management to corporations, institutions, and wealthy individuals.
Jefferies operates through two main segments: Investment Banking and Capital Markets, and Asset Management. The Investment Banking division offers a comprehensive suite of services including mergers and acquisitions advice, debt restructuring, and both equity and debt underwriting. For example, when a mid-sized technology company wants to go public, Jefferies might guide them through the IPO process, helping determine pricing and connecting them with institutional investors.
The firm's Capital Markets business spans equities and fixed income, where Jefferies acts as both agent and market maker, executing trades for clients while providing research and market insights. Its fixed income division trades everything from government bonds to high-yield debt and structured products, with Jefferies serving as a Primary Dealer for U.S. government securities.
Through strategic joint ventures, the company has expanded its capabilities. Jefferies Finance, a 50/50 partnership with Massachusetts Mutual Life Insurance, focuses on leveraged finance and loan management, while Berkadia, a joint venture with Berkshire Hathaway, specializes in commercial real estate financing and investment sales.
The Asset Management segment operates primarily under the Leucadia Asset Management umbrella, offering institutional clients access to various investment strategies across different asset classes. The firm often invests its own capital alongside clients in these strategies. Jefferies maintains a strategic alliance with Sumitomo Mitsui Financial Group, enhancing its global reach, particularly in Japanese markets where SMBC owned approximately 15.8% of Jefferies' common stock as of late 2024.
4. Investment Banking & Brokerage
Investment banks and brokerages facilitate capital raises, mergers and acquisitions, and securities trading. The sector benefits from corporate activity during economic expansion, increased retail trading participation, and advisory opportunities in emerging sectors. Headwinds include economic cycle vulnerability affecting deal flow, compressed trading commissions due to electronic platforms, and regulatory capital requirements constraining certain higher-risk activities.
Jefferies Financial Group competes with major global investment banks including Goldman Sachs (NYSE:GS), Morgan Stanley (NYSE:MS), JPMorgan Chase (NYSE:JPM), and Bank of America's Merrill Lynch (NYSE:BAC), as well as boutique investment banks like Evercore (NYSE:EVR) and Lazard (NYSE:LAZ).
5. Revenue Growth
Reviewing a company’s long-term sales performance reveals insights into its quality. Even a bad business can shine for one or two quarters, but a top-tier one grows for years. Unfortunately, Jefferies’s 4.1% annualized revenue growth over the last five years was sluggish. This fell short of our benchmark for the financials sector and is a tough starting point for our analysis.
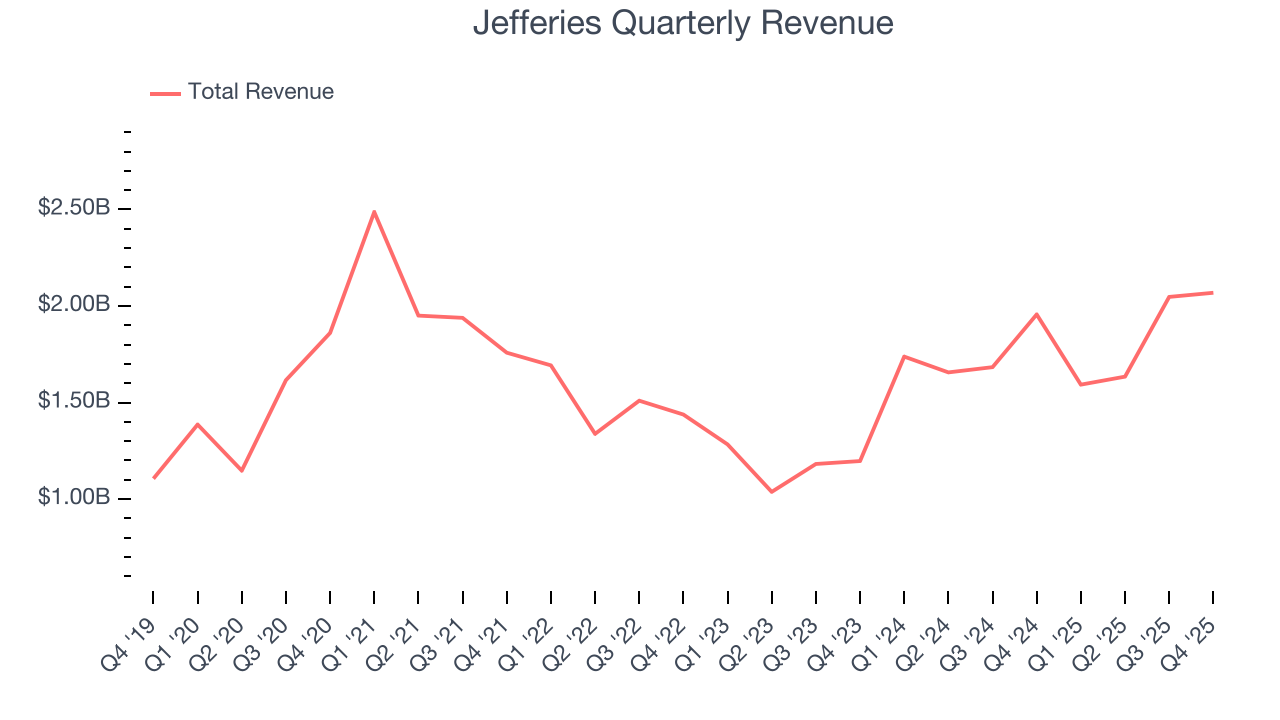
We at StockStory place the most emphasis on long-term growth, but within financials, a half-decade historical view may miss recent interest rate changes, market returns, and industry trends. Jefferies’s annualized revenue growth of 25% over the last two years is above its five-year trend, suggesting its demand recently accelerated. 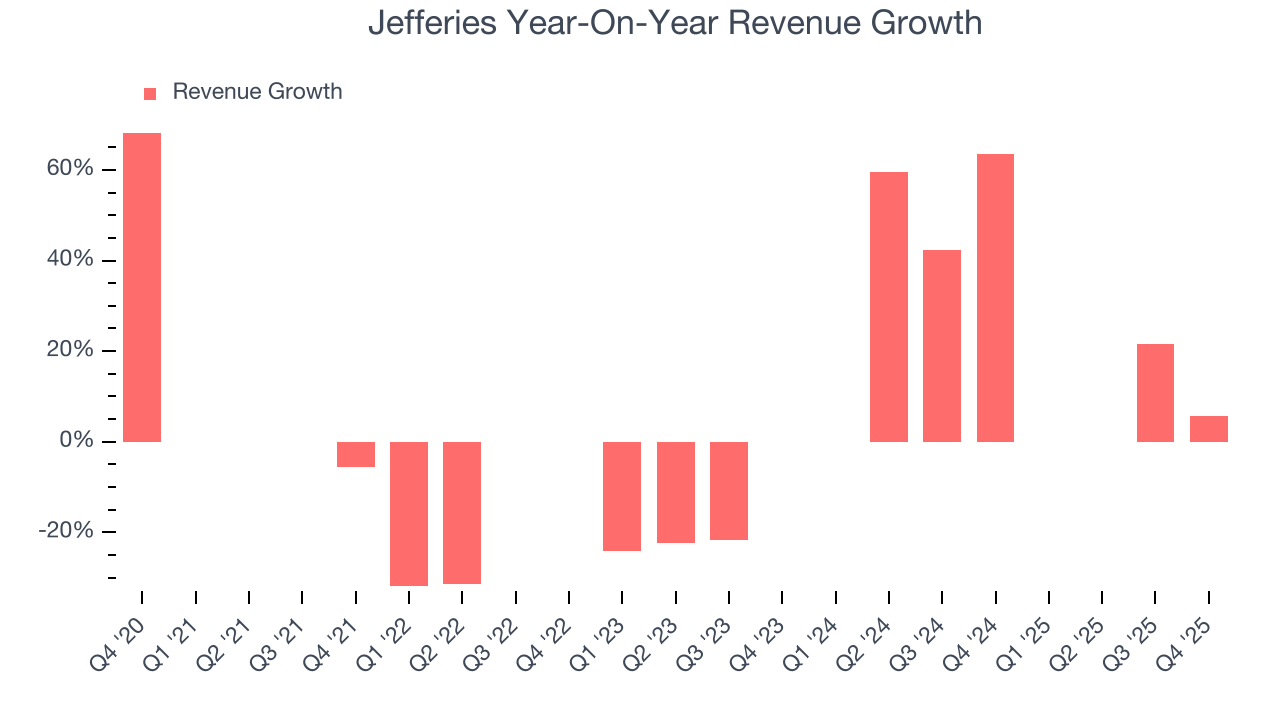 Note: Quarters not shown were determined to be outliers, impacted by outsized investment gains/losses that are not indicative of the recurring fundamentals of the business.
This quarter, Jefferies reported year-on-year revenue growth of 5.7%, and its $2.07 billion of revenue exceeded Wall Street’s estimates by 3%.
6. Pre-Tax Profit Margin
Revenue growth is one major determinant of business quality, and the efficiency of operations is another. For Investment Banking & Brokerage companies, we look at pre-tax profit rather than the operating margin that defines sectors such as consumer, tech, and industrials.
Financials companies manage interest-bearing assets and liabilities, making the interest income and expenses included in pre-tax profit essential to their profit calculation. Taxes, being external factors beyond management control, are appropriately excluded from this alternative margin measure.
Over the last five years, Jefferies’s pre-tax profit margin has risen by 5.9 percentage points, going from 27.7% to 11.9%. Luckily, it seems the company has recently taken steps to address its expense base as its pre-tax profit margin expanded by 4.3 percentage points on a two-year basis.
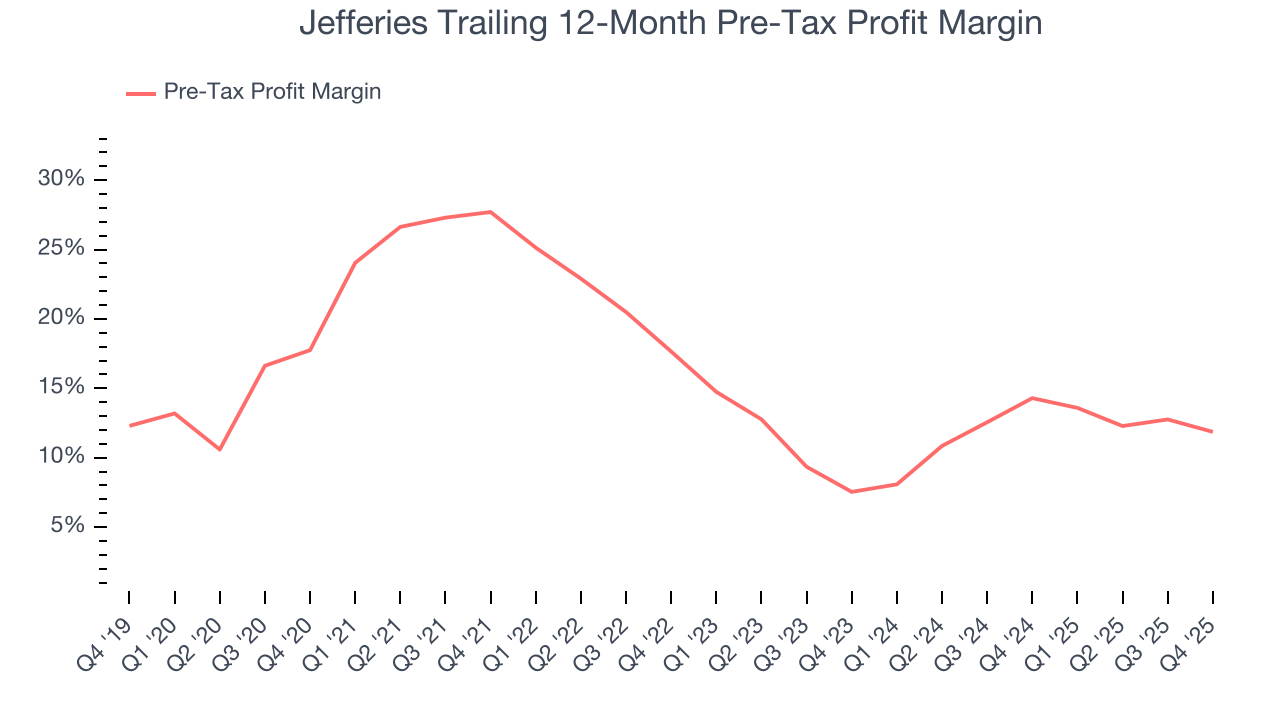
In Q4, Jefferies’s pre-tax profit margin was 12.2%. This result was 3.3 percentage points worse than the same quarter last year.
7. Earnings Per Share
We track the long-term change in earnings per share (EPS) for the same reason as long-term revenue growth. Compared to revenue, however, EPS highlights whether a company’s growth is profitable.
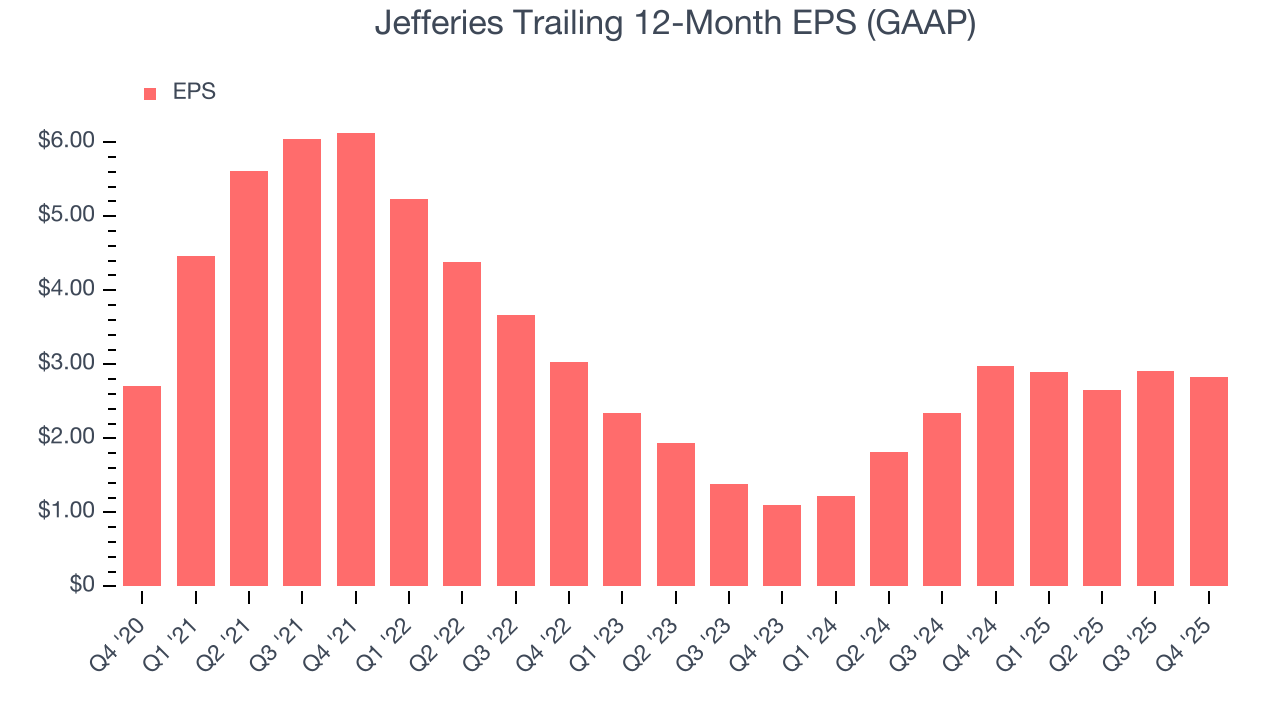
Jefferies’s flat EPS over the last five years was below its 4.1% annualized revenue growth. This tells us the company became less profitable on a per-share basis as it expanded due to factors such as interest expenses and taxes.
Like with revenue, we analyze EPS over a more recent period because it can provide insight into an emerging theme or development for the business.
For Jefferies, its two-year annual EPS growth of 60.4% was higher than its five-year trend. This acceleration made it one of the faster-growing financials companies in recent history.
In Q4, Jefferies reported EPS of $0.85, down from $0.93 in the same quarter last year. This print missed analysts’ estimates. Over the next 12 months, Wall Street expects Jefferies’s full-year EPS of $2.83 to grow 58.2%.
8. Tangible Book Value Per Share (TBVPS)
Financial firms profit by providing a wide range of services, making them fundamentally balance sheet-driven enterprises with multiple intermediation roles. Market participants emphasize balance sheet quality and sustained book value growth when evaluating these multifaceted institutions.
This is why we consider tangible book value per share (TBVPS) an important metric for the sector. TBVPS represents the real net worth per share across all business segments, providing a clear measure of shareholder equity regardless of the complexity of operations. EPS can become murky due to the complexity of multiple revenue streams, acquisition impacts, or accounting flexibility across different financial services, and book value resists financial engineering manipulation.
Jefferies’s TBVPS grew at a sluggish 2.4% annual clip over the last five years. On a two-year basis, however, dynamics have changed as TBVPS dropped by 3.8% annually ($36.39 to $33.69 per share).
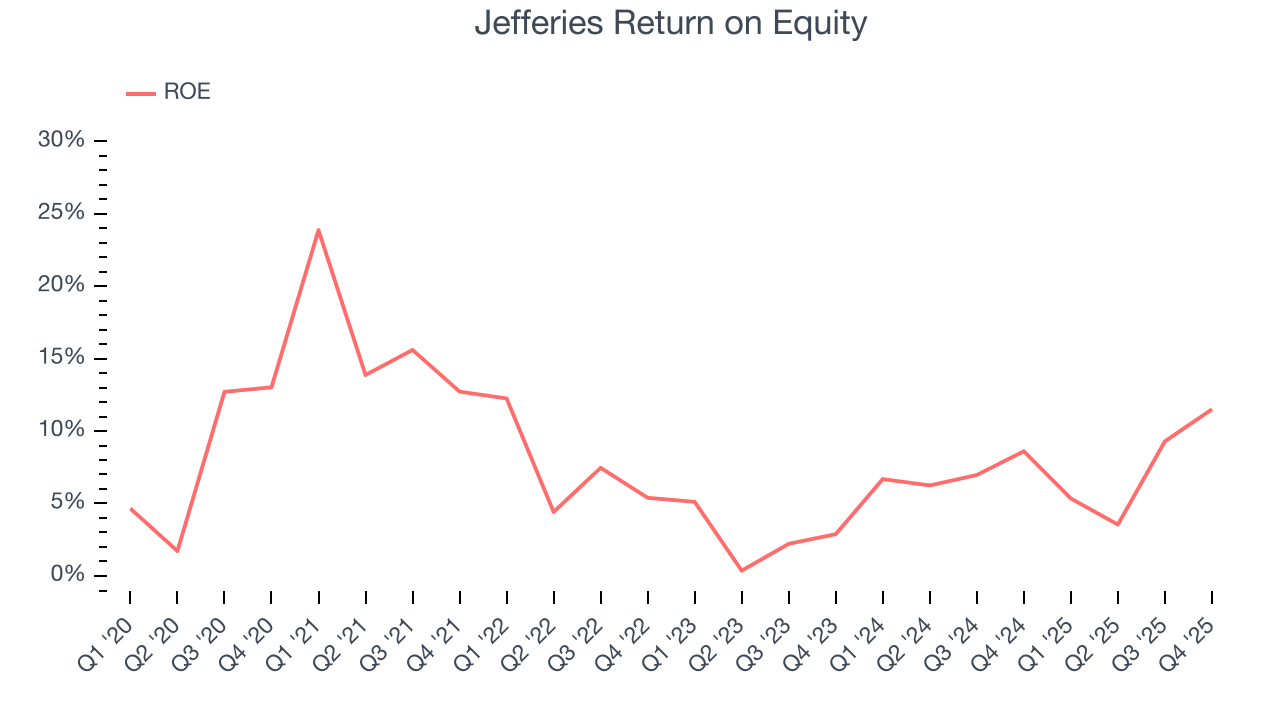
9. Return on Equity
Return on equity (ROE) reveals the profit generated per dollar of shareholder equity, which represents a key source of bank funding. Banks maintaining elevated ROE levels tend to accelerate wealth creation for shareholders via earnings retention, buybacks, and distributions.
Over the last five years, Jefferies has averaged an ROE of 8.2%, uninspiring for a company operating in a sector where the average shakes out around 10%.
10. Balance Sheet Risk
Jefferies reported $13.53 billion of cash and $33.31 billion of debt on its balance sheet in the most recent quarter.
As investors in high-quality companies, we primarily focus on whether a company’s profits can support its debt.
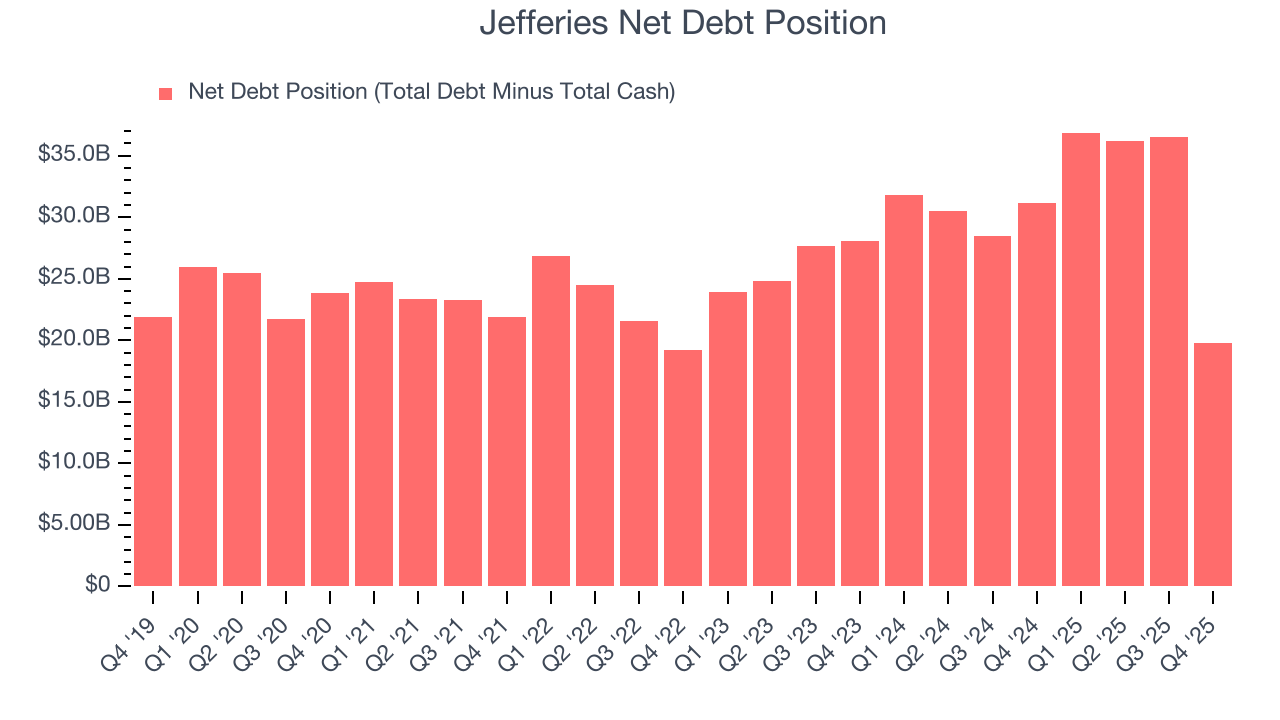
With $1.06 billion of EBITDA over the last 12 months, we view Jefferies’s 18.6× net-debt-to-EBITDA ratio as inadequate. The company’s lacking profits relative to its borrowings give it little breathing room, raising red flags.
11. Key Takeaways from Jefferies’s Q4 Results
It was encouraging to see Jefferies beat analysts’ revenue expectations this quarter. On the other hand, its EPS missed. Overall, this quarter could have been better. The stock traded down 3.3% to $62.55 immediately after reporting.
12. Is Now The Time To Buy Jefferies?
Updated: March 14, 2026 at 12:16 AM EDT
Before investing in or passing on Jefferies, we urge you to understand the company’s business quality (or lack thereof), valuation, and the latest quarterly results - in that order.
Jefferies’s business quality ultimately falls short of our standards. For starters, its revenue growth was uninspiring over the last five years. On top of that, Jefferies’s declining pre-tax profit margin shows the business has become less efficient, and its weak EPS growth over the last five years shows it’s failed to produce meaningful profits for shareholders.
Jefferies’s P/E ratio based on the next 12 months is 9.3x. While this valuation is reasonable, we don’t really see a big opportunity at the moment. We're fairly confident there are better investments elsewhere.
Wall Street analysts have a consensus one-year price target of $59.33 on the company (compared to the current share price of $36.51).
Although the price target is bullish, readers should exercise caution because analysts tend to be overly optimistic. The firms they work for, often big banks, have relationships with companies that extend into fundraising, M&A advisory, and other rewarding business lines. As a result, they typically hesitate to say bad things for fear they will lose out. We at StockStory do not suffer from such conflicts of interest, so we’ll always tell it like it is.