Intel (INTC)
Intel keeps us up at night. Not only are its sales cratering but also its low returns on capital suggest it struggles to generate profits.― StockStory Analyst Team
1. News


2. Summary
Why We Think Intel Will Underperform
Inventor of the x86 processor that powered decades of technological innovation in PCs, data centers, and numerous other markets, Intel (NASDAQ:INTC) is a leading manufacturer of computer processors and graphics chips.
- Customers postponed purchases of its products and services this cycle as its revenue declined by 6.2% annually over the last five years
- Performance over the past five years shows each sale was less profitable as its earnings per share dropped by 40.1% annually, worse than its revenue
- Projected sales growth of 1.5% for the next 12 months suggests sluggish demand


Intel’s quality isn’t up to par. We’d search for superior opportunities elsewhere.
Why There Are Better Opportunities Than Intel


Intel is trading at $45.72 per share, or 99.9x forward P/E. The current multiple is quite expensive, especially for the tepid revenue growth.
There are stocks out there similarly priced with better business quality. We prefer owning these.
3. Intel (INTC) Research Report: Q4 CY2025 Update
Computer processor maker Intel (NASDAQ:INTC) reported Q4 CY2025 results exceeding the market’s revenue expectations, but sales fell by 4.1% year on year to $13.67 billion. On the other hand, next quarter’s revenue guidance of $12.2 billion was less impressive, coming in 3.2% below analysts’ estimates. Its non-GAAP profit of $0.15 per share was 80.7% above analysts’ consensus estimates.
Intel (INTC) Q4 CY2025 Highlights:
- Revenue: $13.67 billion vs analyst estimates of $13.41 billion (4.1% year-on-year decline, 2% beat)
- Adjusted EPS: $0.15 vs analyst estimates of $0.08 (80.7% beat)
- Adjusted Operating Income: $1.21 billion vs analyst estimates of $839.5 million (8.8% margin, 43.5% beat)
- Revenue Guidance for Q1 CY2026 is $12.2 billion at the midpoint, below analyst estimates of $12.6 billion
- Adjusted EPS guidance for Q1 CY2026 is $0 at the midpoint, below analyst estimates of $0.05
- Operating Margin: 4.2%, up from 2.9% in the same quarter last year
- Free Cash Flow was $2.22 billion, up from -$1.5 billion in the same quarter last year
- Inventory Days Outstanding: 121, down from 124 in the previous quarter
- Market Capitalization: $270.4 billion
Company Overview
Inventor of the x86 processor that powered decades of technological innovation in PCs, data centers, and numerous other markets, Intel (NASDAQ:INTC) is a leading manufacturer of computer processors and graphics chips.
Founded in 1970 by Gordon Moore, Robert Noyce, and Andy Grove, Intel’s first business was actually focused on building memory chips,dynamic random-access memory (DRAM). The company had a near monopoly in the late 1970s, before Japanese competitors crushed Intel on pricing, prompting one the great pivots in tech history when it switched its focus to computer processors and was selected by IBM to provide the processor for the first PC in 1981. Intel’s x86 processor architecture subsequently became the industry standard for PCs, transforming the company into the dominant provider of chips used in PCs and data centers for decades.
Once revered for both its R&D and manufacturing prowess, Intel failed to diversify into growing end markets such as smartphones, 4G/LTE, and GPUs because it didn’t want to get into these (at the time) smaller and less profitable end markets - especially when it had a near monopoly in the highly profitable CPU business.
Over the past decade, Intel’s manufacturing edge first stagnated, and today trails rivals TSMC and Samsung, reducing its pricing power and margins. Intel faces ongoing challenges as its former x86 strongholds in PCs and datacenters are threatened by GPUs and ARM-based alternatives.
Intel's primary competitors are Advanced Micro Devices (NASDAQ:AMD) and Nvidia (NASDAQ:NVDA), and Qualcomm (NASDAQ:QCOM).
4. Processors and Graphics Chips
Chips need to keep getting smaller in order to advance on Moore’s law, and that is proving increasingly more complicated and expensive to achieve with time. That has caused most digital chip makers to become “fabless” designers, rather than manufacturers, instead relying on contracted foundries like TSMC to manufacture their designs. This has benefitted the digital chip makers’ free cash flow margins, as exiting the manufacturing business has removed large cash expenses from their business models.
5. Revenue Growth
A company’s long-term sales performance is one signal of its overall quality. Any business can experience short-term success, but top-performing ones enjoy sustained growth for years. Intel struggled to consistently generate demand over the last five years as its sales dropped at a 6.2% annual rate. This wasn’t a great result and suggests it’s a low quality business. Semiconductors are a cyclical industry, and long-term investors should be prepared for periods of high growth followed by periods of revenue contractions.
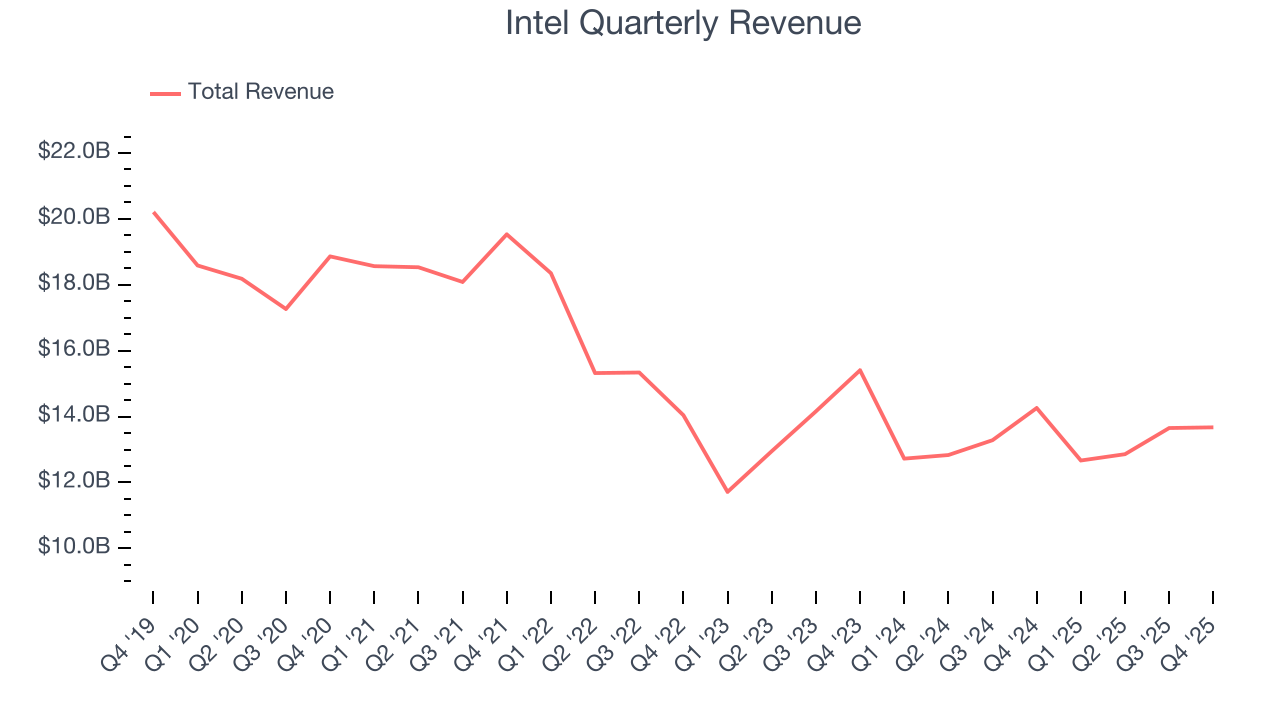
We at StockStory place the most emphasis on long-term growth, but within semiconductors, a half-decade historical view may miss new demand cycles or industry trends like AI. Intel’s annualized revenue declines of 1.3% over the last two years suggest its demand continued shrinking. 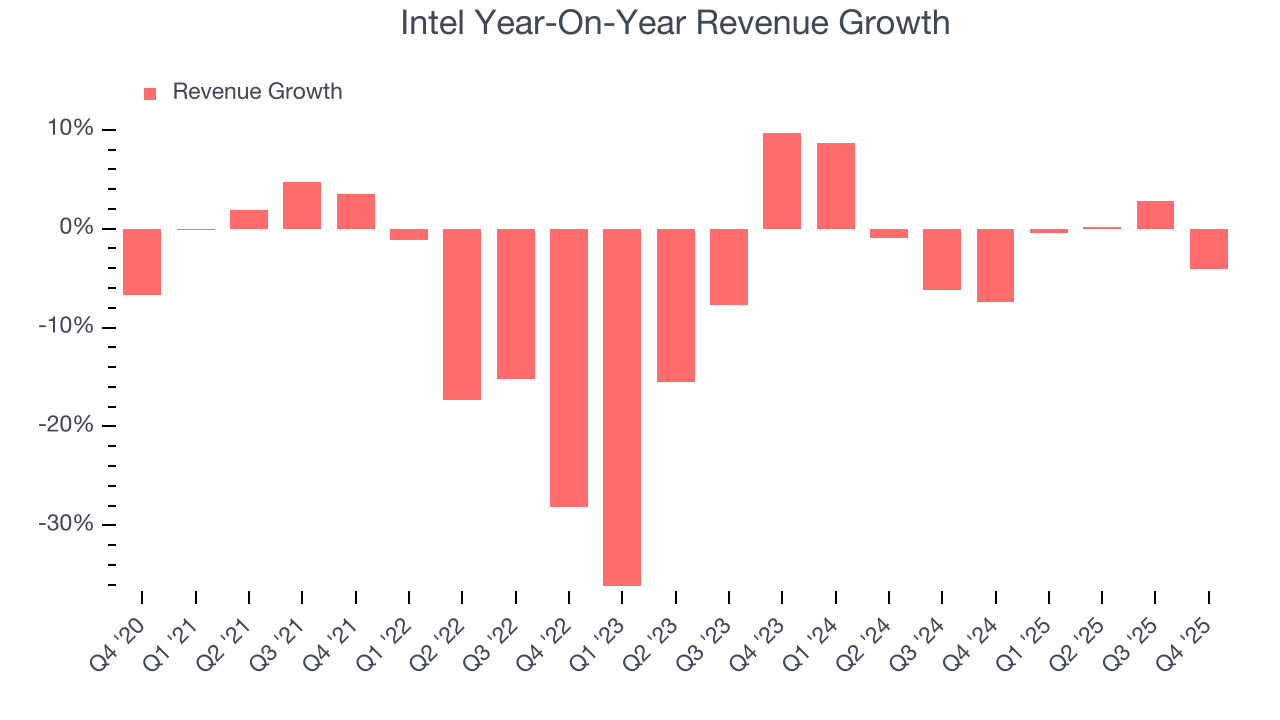
This quarter, Intel’s revenue fell by 4.1% year on year to $13.67 billion but beat Wall Street’s estimates by 2%. Company management is currently guiding for a 3.7% year-on-year decline in sales next quarter.
Looking further ahead, sell-side analysts expect revenue to grow 2.2% over the next 12 months. While this projection indicates its newer products and services will spur better top-line performance, it is still below average for the sector.
6. Product Demand & Outstanding Inventory
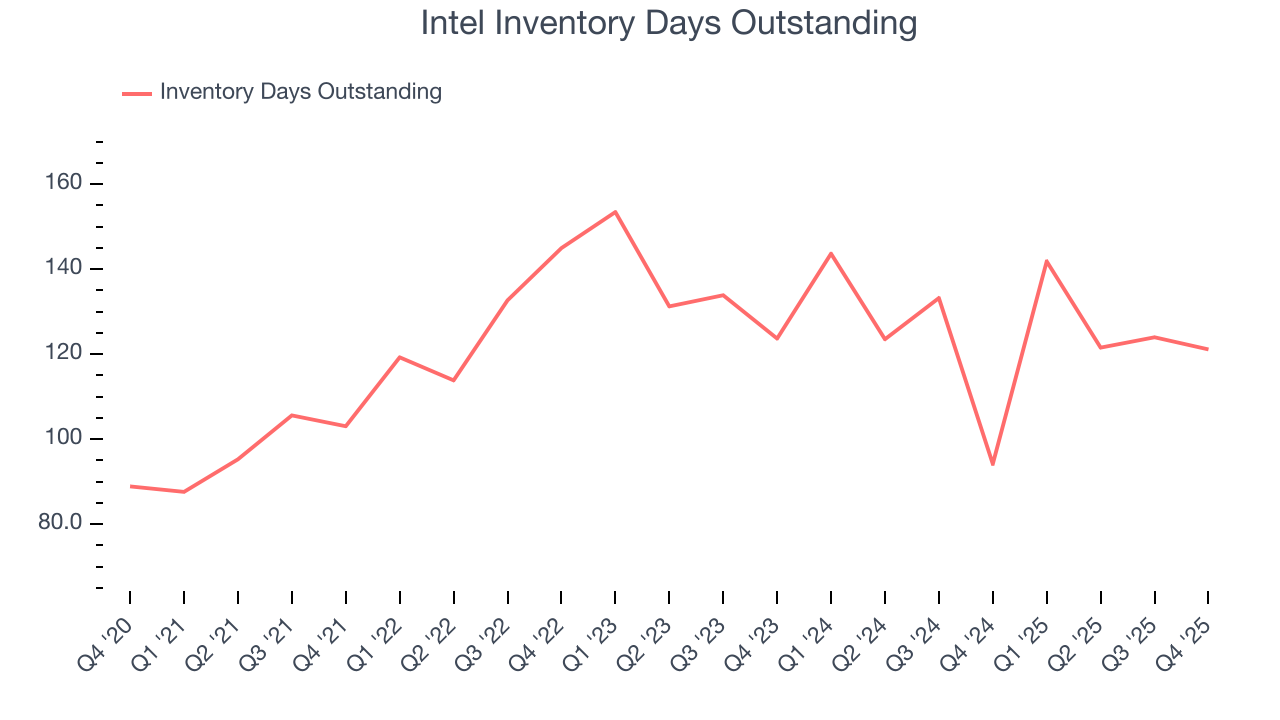
Days Inventory Outstanding (DIO) is an important metric for chipmakers, as it reflects a business’ capital intensity and the cyclical nature of semiconductor supply and demand. In a tight supply environment, inventories tend to be stable, allowing chipmakers to exert pricing power. Steadily increasing DIO can be a warning sign that demand is weak, and if inventories continue to rise, the company may have to downsize production.
This quarter, Intel’s DIO came in at 121, which is one day below its five-year average. At the moment, these numbers show no indication of an unusual inventory buildup.
7. Gross Margin & Pricing Power
Gross profit margin is a key metric to track because it shows how much money a semiconductor company gets to keep after paying for its raw materials, manufacturing, and other input costs.
Intel’s gross margin is one of the worst in the semiconductor industry, signaling it operates in a competitive market and lacks pricing power. As you can see below, it averaged a 34.7% gross margin over the last two years. Said differently, Intel had to pay a chunky $65.28 to its suppliers for every $100 in revenue. 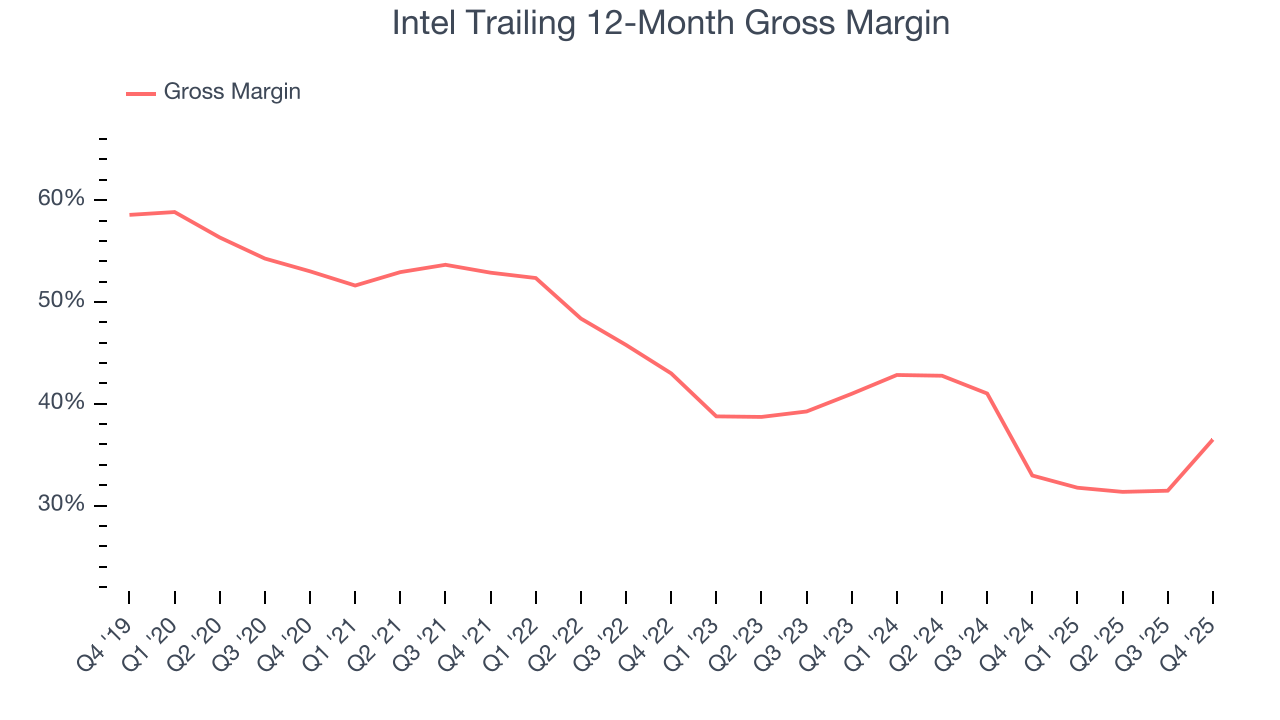
This quarter, Intel’s gross profit margin was 36.1%, marking a 18.8 percentage point increase from 17.3% in the same quarter last year. Intel’s full-year margin has also been trending up over the past 12 months, increasing by 3.5 percentage points. If this move continues, it could suggest better unit economics due to some combination of stable to improving pricing power and input costs (such as raw materials).
8. Operating Margin
Although Intel was profitable this quarter from an operational perspective, it’s generally struggled over a longer time period. Its expensive cost structure has contributed to an average operating margin of negative 13.1% over the last two years. Unprofitable semiconductor companies require extra attention because they could get caught swimming naked when the tide goes out. It’s hard to trust that the business can endure a full cycle.
Looking at the trend in its profitability, Intel’s operating margin decreased by 30.2 percentage points over the last five years. Intel’s performance was poor no matter how you look at it - it shows that costs were rising and it couldn’t pass them onto its customers.
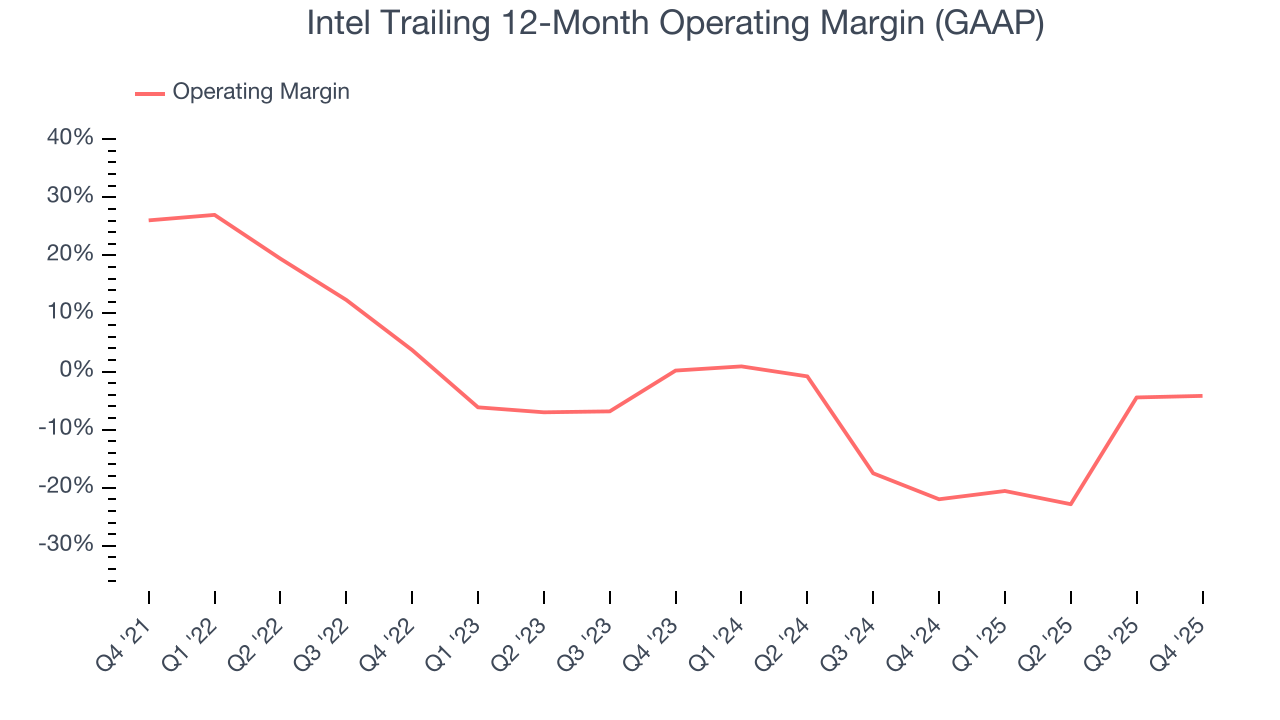
In Q4, Intel generated an operating margin profit margin of 4.2%, up 1.4 percentage points year on year. Since its gross margin expanded more than its operating margin, we can infer that leverage on its cost of sales was the primary driver behind the recently higher efficiency.
9. Earnings Per Share
Revenue trends explain a company’s historical growth, but the long-term change in earnings per share (EPS) points to the profitability of that growth – for example, a company could inflate its sales through excessive spending on advertising and promotions.
Sadly for Intel, its EPS declined by 40.1% annually over the last five years, more than its revenue. This tells us the company struggled because its fixed cost base made it difficult to adjust to shrinking demand.
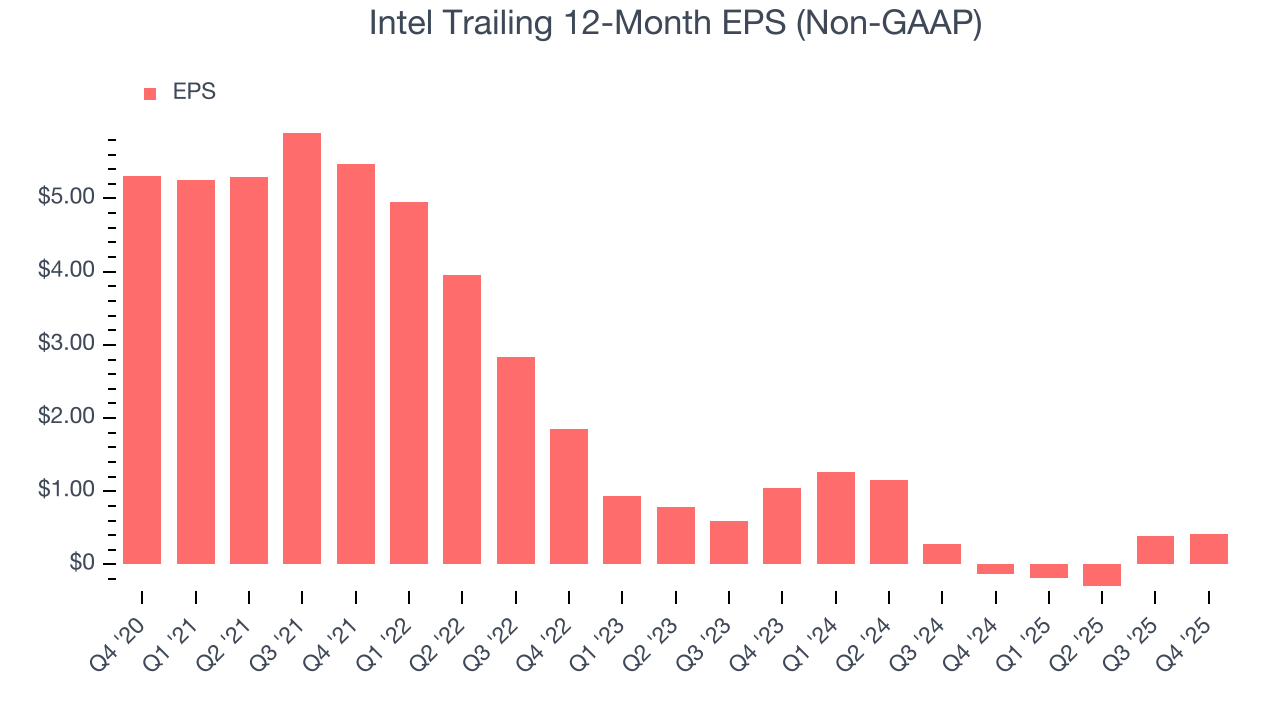
Diving into the nuances of Intel’s earnings can give us a better understanding of its performance. As we mentioned earlier, Intel’s operating margin expanded this quarter but declined by 30.2 percentage points over the last five years. Its share count also grew by 17.9%, meaning the company not only became less efficient with its operating expenses but also diluted its shareholders. 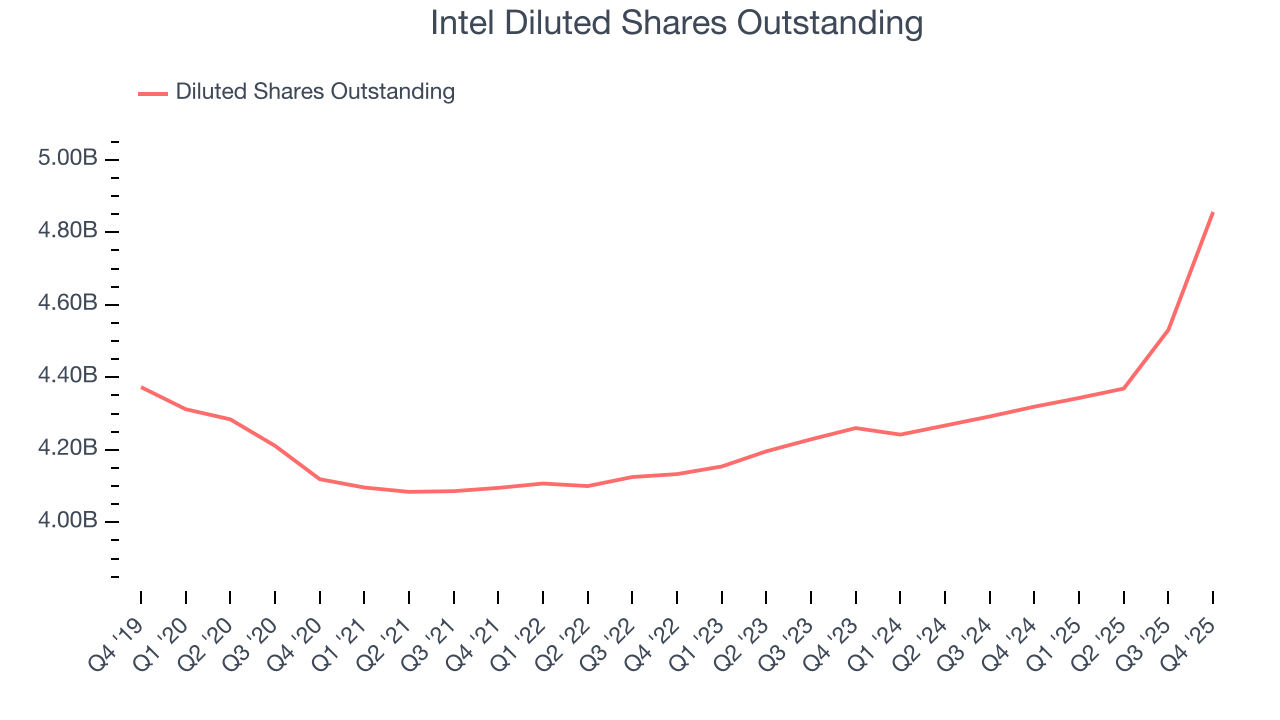
In Q4, Intel reported adjusted EPS of $0.15, up from $0.13 in the same quarter last year. This print easily cleared analysts’ estimates, and shareholders should be content with the results. Over the next 12 months, Wall Street expects Intel’s full-year EPS of $0.41 to grow 44.9%.
10. Cash Is King
If you’ve followed StockStory for a while, you know we emphasize free cash flow. Why, you ask? We believe that in the end, cash is king, and you can’t use accounting profits to pay the bills.
While Intel posted positive free cash flow this quarter, the broader story hasn’t been so clean. Intel’s demanding reinvestments have drained its resources over the last two years, putting it in a pinch and limiting its ability to return capital to investors. Its free cash flow margin averaged negative 3.6%, meaning it lit $3.62 of cash on fire for every $100 in revenue.
Taking a step back, we can see that Intel’s margin dropped by 18.3 percentage points over the last five years. Almost any movement in the wrong direction is undesirable because it is already burning cash. If the trend continues, it could signal it’s in the middle of a big investment cycle.
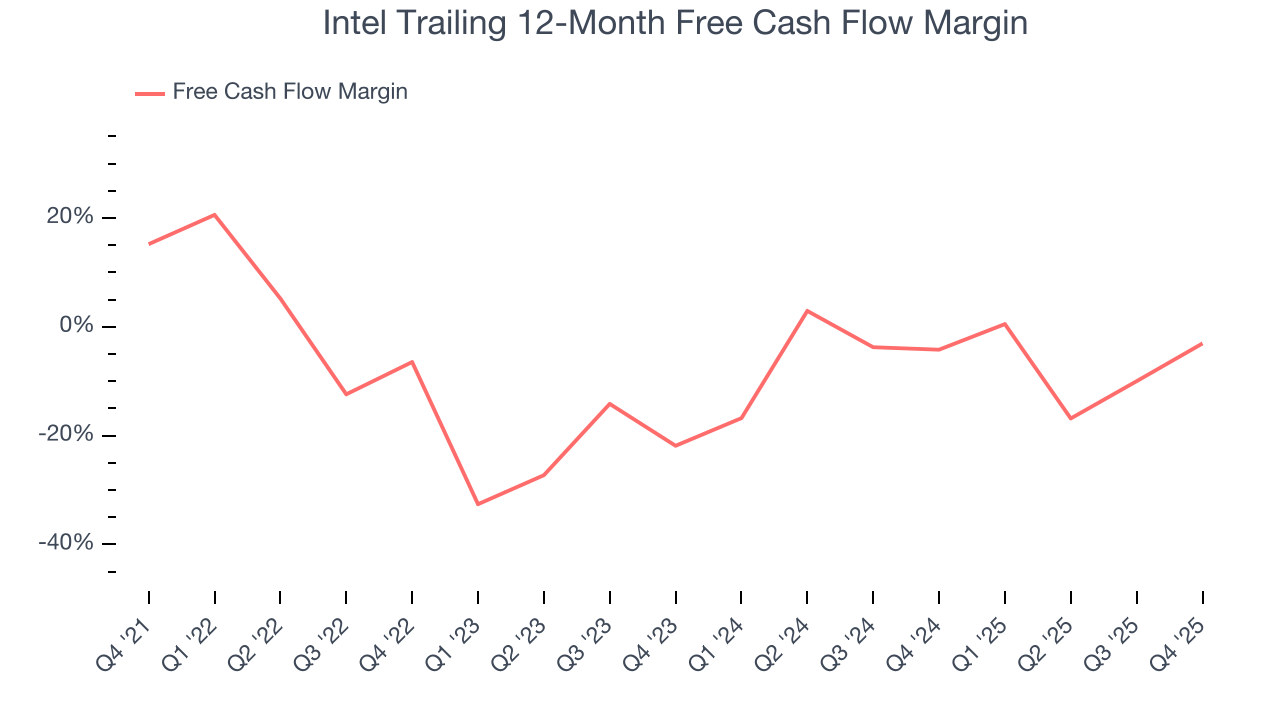
Intel’s free cash flow clocked in at $2.22 billion in Q4, equivalent to a 16.2% margin. Its cash flow turned positive after being negative in the same quarter last year, but we wouldn’t put too much weight on the short term because investment needs can be seasonal, causing temporary swings. Long-term trends trump fluctuations.
11. Return on Invested Capital (ROIC)
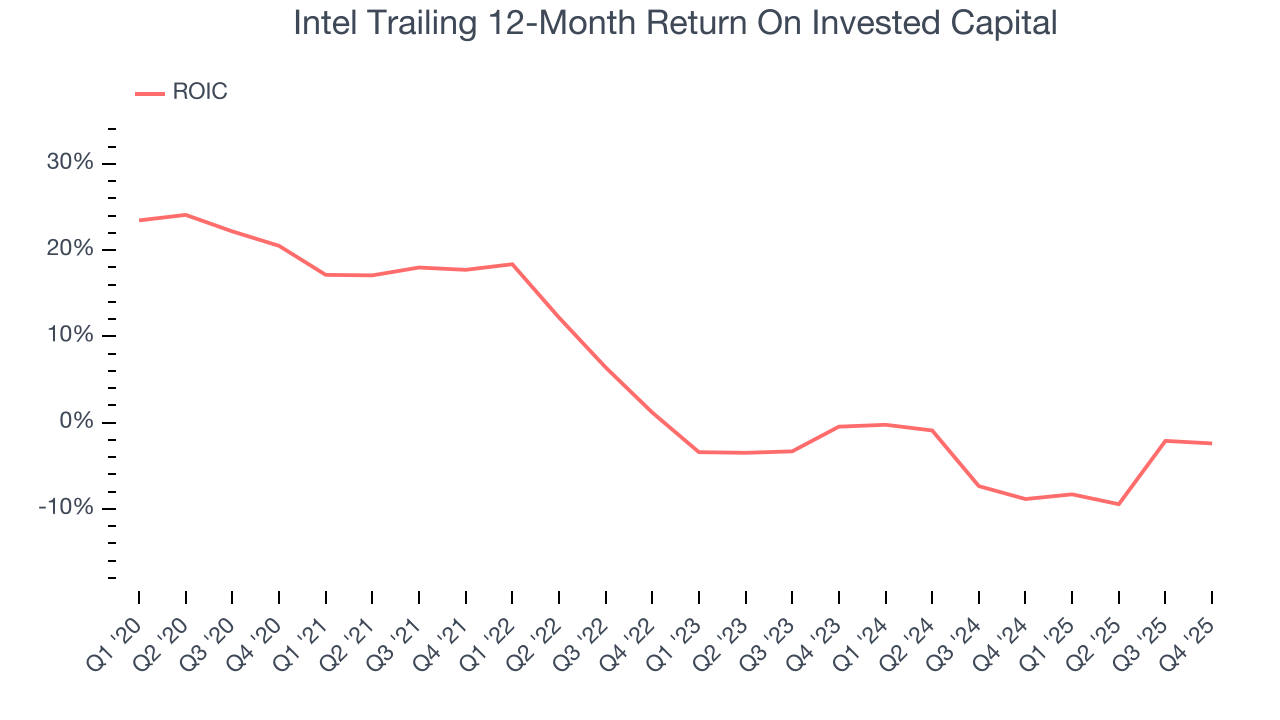
EPS and free cash flow tell us whether a company was profitable while growing its revenue. But was it capital-efficient? A company’s ROIC explains this by showing how much operating profit it makes compared to the money it has raised (debt and equity).
Intel historically did a mediocre job investing in profitable growth initiatives. Its five-year average ROIC was 1.4%, lower than the typical cost of capital (how much it costs to raise money) for semiconductor companies.
12. Balance Sheet Assessment
Intel reported $37.42 billion of cash and $46.59 billion of debt on its balance sheet in the most recent quarter. As investors in high-quality companies, we primarily focus on two things: 1) that a company’s debt level isn’t too high and 2) that its interest payments are not excessively burdening the business.
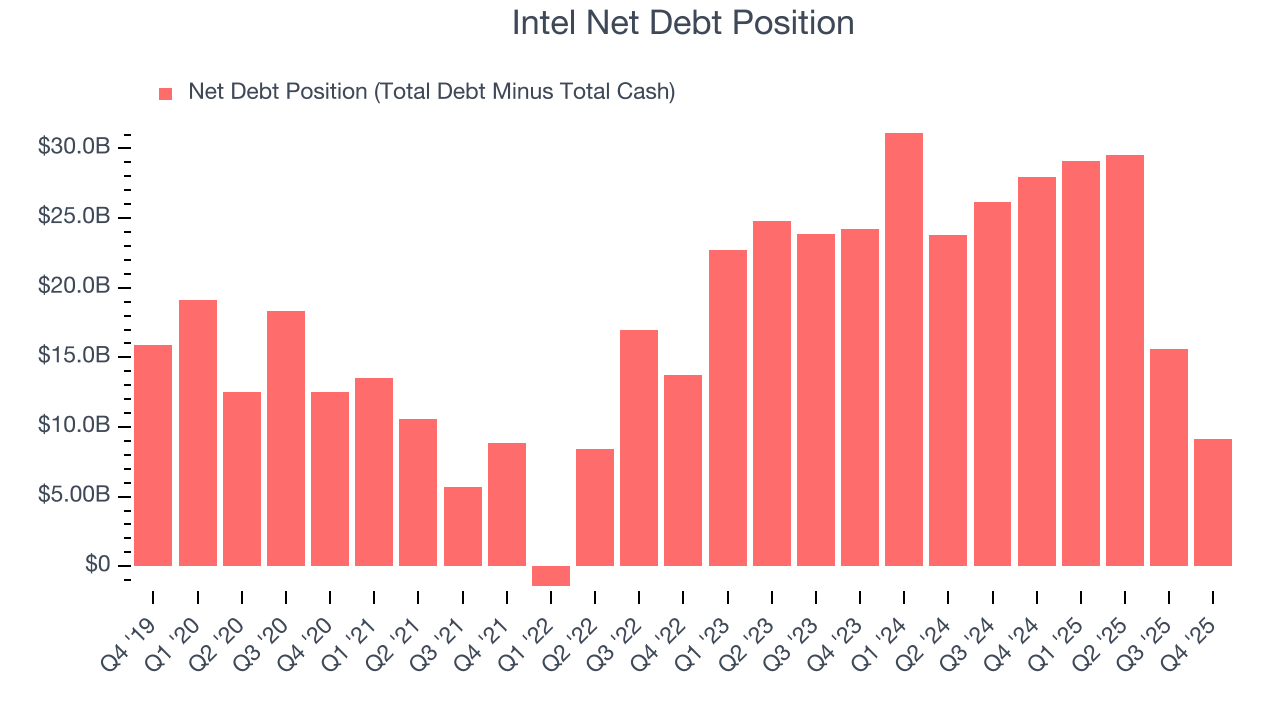
With $14.62 billion of EBITDA over the last 12 months, we view Intel’s 0.6× net-debt-to-EBITDA ratio as safe. We also see its $83 million of annual interest expenses as appropriate. The company’s profits give it plenty of breathing room, allowing it to continue investing in growth initiatives.
13. Key Takeaways from Intel’s Q4 Results
It was good to see Intel beat analysts’ EPS expectations this quarter. We were also excited its adjusted operating income outperformed Wall Street’s estimates by a wide margin. On the other hand, its revenue guidance for next quarter missed. Overall, this print had some key positives. The market seemed to be hoping for more, and the stock traded down 3.9% to $52.23 immediately following the results.
14. Is Now The Time To Buy Intel?
Updated: March 15, 2026 at 10:32 PM EDT
When considering an investment in Intel, investors should account for its valuation and business qualities as well as what’s happened in the latest quarter.
Intel doesn’t pass our quality test. To begin with, its revenue has declined over the last five years. On top of that, Intel’s declining EPS over the last five years makes it a less attractive asset to the public markets, and its declining operating margin shows the business has become less efficient.
Intel’s P/E ratio based on the next 12 months is 99.9x. This valuation tells us a lot of optimism is priced in - we think there are better stocks to buy right now.
Wall Street analysts have a consensus one-year price target of $47.11 on the company (compared to the current share price of $45.72).