
Nvidia (NVDA)
We’re bullish on Nvidia. Its combination of fast growth, robust profitability, and superb prospects makes it a coveted asset.― StockStory Analyst Team
1. News


2. Summary
Why We Like Nvidia
Founded in 1993 by Jensen Huang and two former Sun Microsystems engineers, Nvidia (NASDAQ:NVDA) is a leading fabless designer of chips used in gaming, PCs, data centers, automotive, and a variety of end markets.
- Annual revenue growth of 66.9% over the last five years was superb and indicates its market share increased during this cycle
- Performance over the past five years shows its incremental sales were extremely profitable, as its annual earnings per share growth of 80.5% outpaced its revenue gains
- Expected revenue growth of 66.3% for the next year suggests its market share will rise


We’re optimistic about Nvidia. The price looks reasonable when considering its quality, and we believe now is an opportune time to buy the stock.
Why Is Now The Time To Buy Nvidia?


At $180.19 per share, Nvidia trades at 22.1x forward P/E. Most semiconductor companies are more expensive, so we think Nvidia is a good deal when considering its quality characteristics.
By definition, where you buy a stock impacts returns. Compared to entry price, business quality matters much more for long-term market outperformance. Buying in at a great price helps, nevertheless.
3. Nvidia (NVDA) Research Report: Q4 CY2025 Update
Leading designer of graphics chips Nvidia (NASDAQ:NVDA) reported Q4 CY2025 results beating Wall Street’s revenue expectations, with sales up 73.2% year on year to $68.13 billion. On top of that, next quarter’s revenue guidance ($78 billion at the midpoint) was surprisingly good and 8.1% above what analysts were expecting. Its non-GAAP profit of $1.62 per share was 5.3% above analysts’ consensus estimates.
Nvidia (NVDA) Q4 CY2025 Highlights:
- Revenue: $68.13 billion vs analyst estimates of $66.2 billion (73.2% year-on-year growth, 2.9% beat)
- Adjusted EPS: $1.62 vs analyst estimates of $1.54 (5.3% beat)
- Adjusted Operating Income: $46.11 billion vs analyst estimates of $44.72 billion (67.7% margin, 3.1% beat)
- Revenue Guidance for Q1 CY2026 is $78 billion at the midpoint, above analyst estimates of $72.13 billion
- Operating Margin: 65%, up from 61.1% in the same quarter last year
- Free Cash Flow Margin: 51.2%, up from 39.5% in the same quarter last year
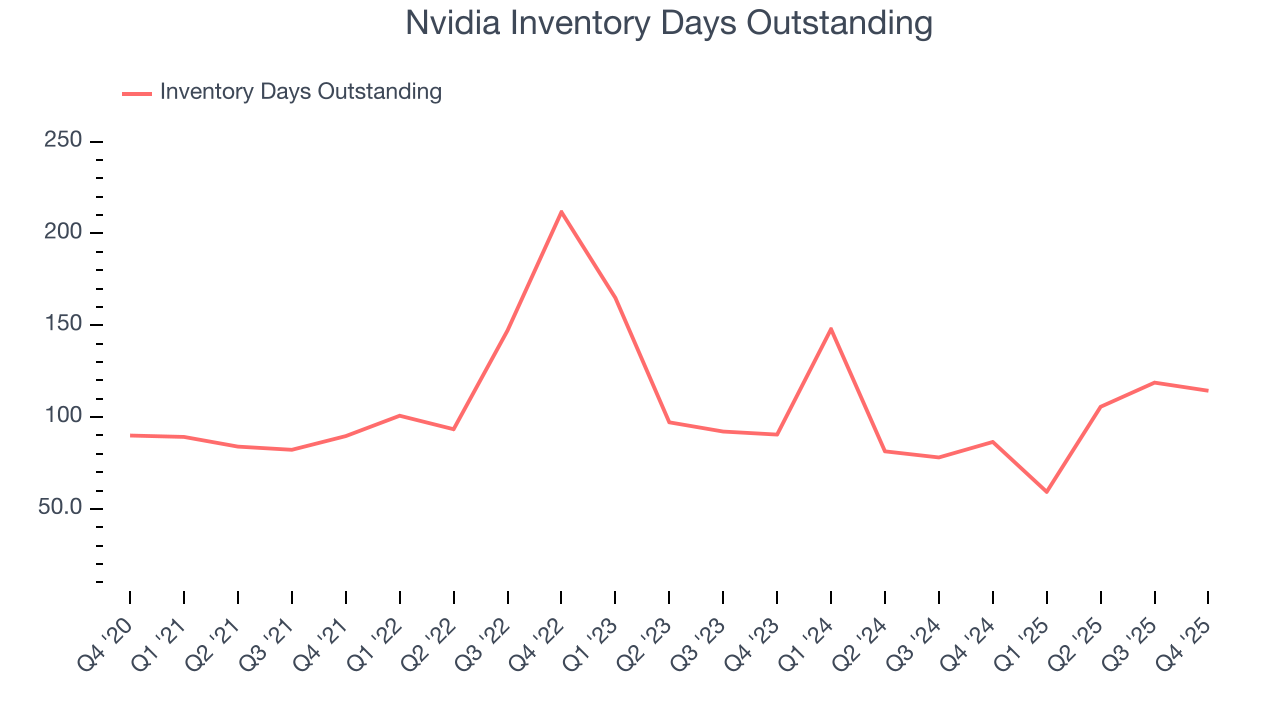
- Inventory Days Outstanding: 114, down from 119 in the previous quarter
- Market Capitalization: $4.69 trillion
Company Overview
Founded in 1993 by Jensen Huang and two former Sun Microsystems engineers, Nvidia (NASDAQ:NVDA) is a leading fabless designer of chips used in gaming, PCs, data centers, automotive, and a variety of end markets.
Founded with the goal of bringing high end 3D computer graphics processing units (GPUs) to the mainstream PC market, Nvidia's business has exploded over the past decade as GPUs’ have changed the computing paradigm by enabling leading edge technologies like artificial intelligence, machine learning, and autonomous driving.
GPUs differ from CPUs (most commonly associated with Intel) in that their multi-core structures are designed to operate in a parallel fashion, which makes them great at performing repeat operations at a fast pace, such as running repeated complex mathematical operations to render 3D graphics for video games. In recent years, technologists began applying GPUs “parallel processing” to new use cases like accelerating computing in data centers, powering artificial intelligence and machine learning, and modeling complex problems like taking in data from car cameras to guide autonomous safety features.
Nvidia’s great differentiation was the introduction of the CUDA programming language back in 2006. Nvidia targeted software developers, giving away CUDA for free to developers, who all used it to code graphics in video games. Importantly, Nvidia kept its CUDA-GPU integration closed, meaning that CUDA could only run on Nvidia’s GPUs, creating a massive barrier to entry for other GPU rivals. In the early to mid 2010s, as developers began using CUDA to program GPUs for the new parallel processing use cases in data centers, Nvidia’s business began expanding dramatically.
The exploding use cases for its GPUs and Nvidia’s proprietary programming language have generated one of the great growth stocks of the 2000s, with Nvidia market cap growing more than 20x. Nvidia now has its eyes on the ARM technology, aiming to pair ARM’s low power low cost CPUs with its GPUs to capture ever greater share in the datacenter from Intel’s x86 architecture CPUs.
Nvidia’s primary competitors are Advanced Micro Devices (NASDAQ:AMD) and Intel (NASDAQ:INTC).
4. Processors and Graphics Chips
Chips need to keep getting smaller in order to advance on Moore’s law, and that is proving increasingly more complicated and expensive to achieve with time. That has caused most digital chip makers to become “fabless” designers, rather than manufacturers, instead relying on contracted foundries like TSMC to manufacture their designs. This has benefitted the digital chip makers’ free cash flow margins, as exiting the manufacturing business has removed large cash expenses from their business models.
5. Revenue Growth
Examining a company’s long-term performance can provide clues about its quality. Any business can put up a good quarter or two, but the best consistently grow over the long haul. Thankfully, Nvidia’s 66.9% annualized revenue growth over the last five years was incredible. Its growth surpassed the average semiconductor company and shows its offerings resonate with customers, a great starting point for our analysis. Semiconductors are a cyclical industry, and long-term investors should be prepared for periods of high growth followed by periods of revenue contractions (which can sometimes offer opportune times to buy).
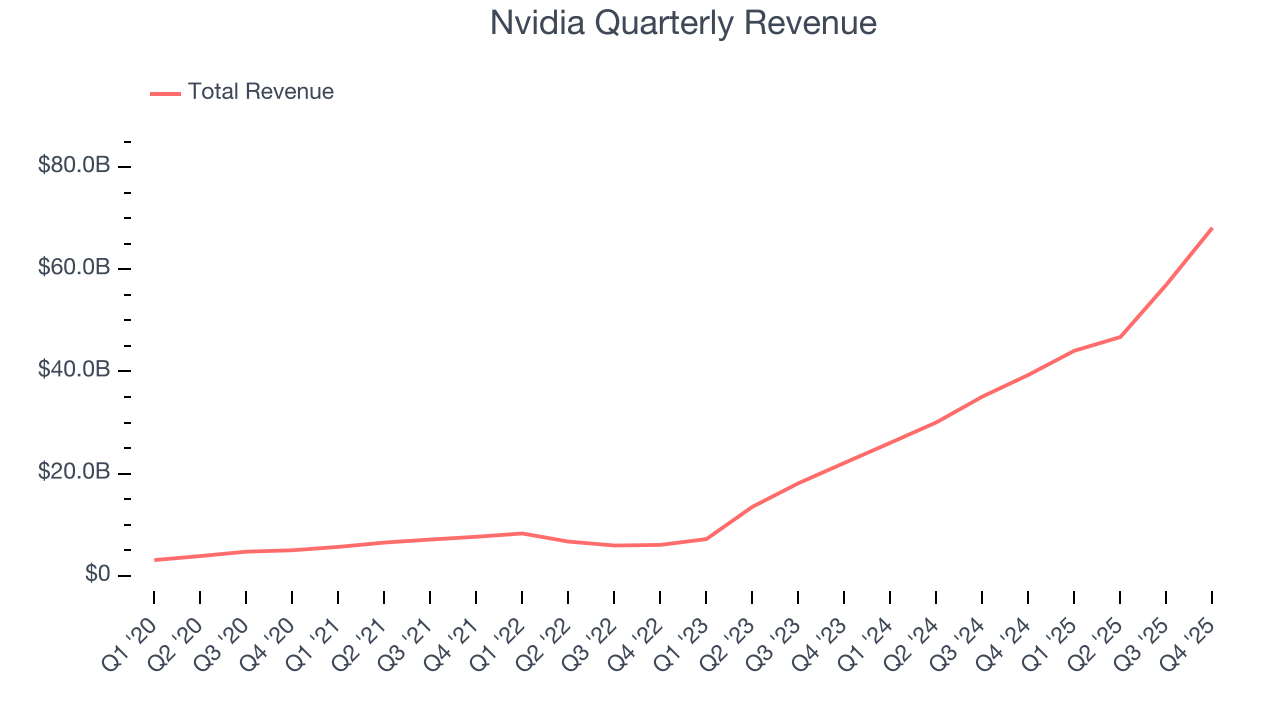
Long-term growth is the most important, but short-term results matter for semiconductors because the rapid pace of technological innovation (Moore's Law) could make yesterday's hit product obsolete today. Nvidia’s annualized revenue growth of 88.3% over the last two years is above its five-year trend, suggesting its demand was strong and recently accelerated. 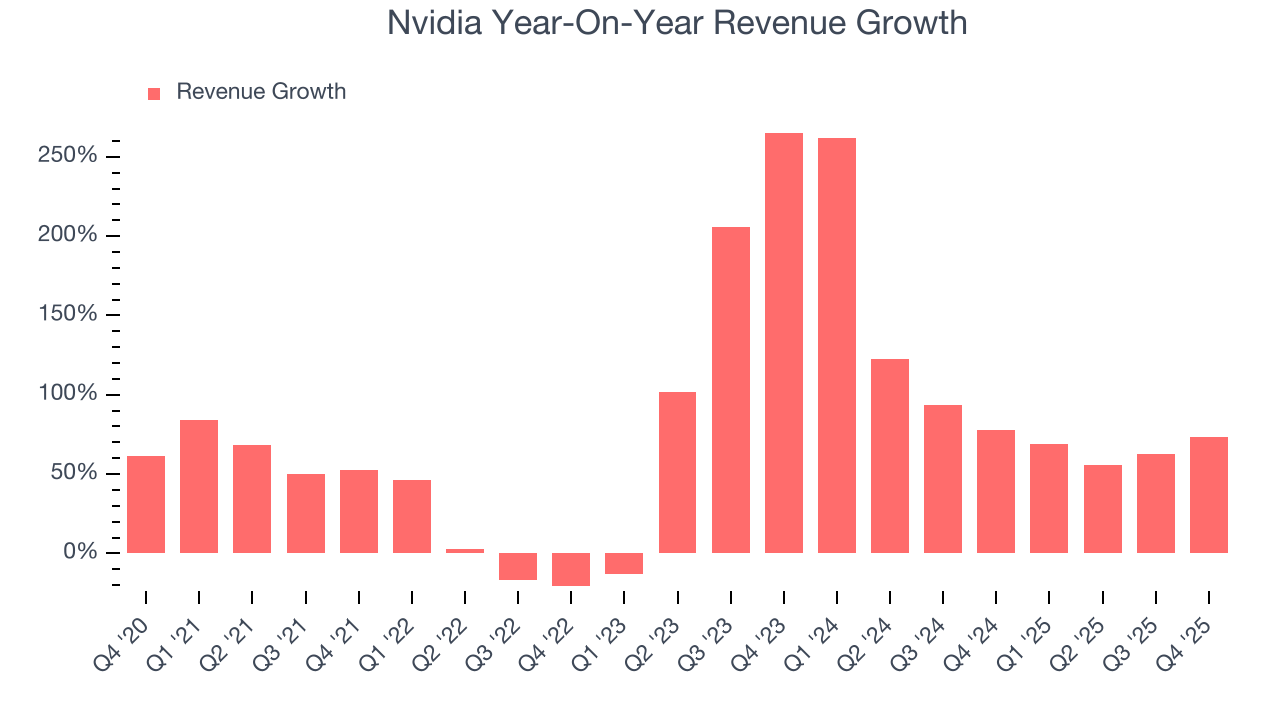
This quarter, Nvidia reported magnificent year-on-year revenue growth of 73.2%, and its $68.13 billion of revenue beat Wall Street’s estimates by 2.9%. Beyond the beat, this marks 11 straight quarters of growth, showing that the current upcycle has had a good run - a typical upcycle usually lasts 8-10 quarters. Company management is currently guiding for a 77% year-on-year increase in sales next quarter.
Looking further ahead, sell-side analysts expect revenue to grow 56.2% over the next 12 months, a deceleration versus the last two years. Still, this projection is eye-popping given its scale and implies the market is forecasting success for its products and services.
6. Product Demand & Outstanding Inventory
Days Inventory Outstanding (DIO) is an important metric for chipmakers, as it reflects a business’ capital intensity and the cyclical nature of semiconductor supply and demand. In a tight supply environment, inventories tend to be stable, allowing chipmakers to exert pricing power. Steadily increasing DIO can be a warning sign that demand is weak, and if inventories continue to rise, the company may have to downsize production.
This quarter, Nvidia’s DIO came in at 114, which is 8 days above its five-year average. These numbers suggest that despite the recent decrease, the company’s inventory levels are higher than what we’ve seen in the past.
7. Gross Margin & Pricing Power
Gross profit margin is a key metric to track because it shows how much money a semiconductor company gets to keep after paying for its raw materials, manufacturing, and other input costs.
Nvidia’s gross margin is one of the best in the semiconductor sector, and its differentiated products give it strong pricing power. As you can see below, it averaged an elite 72.5% gross margin over the last two years. That means Nvidia only paid its suppliers $27.45 for every $100 in revenue. 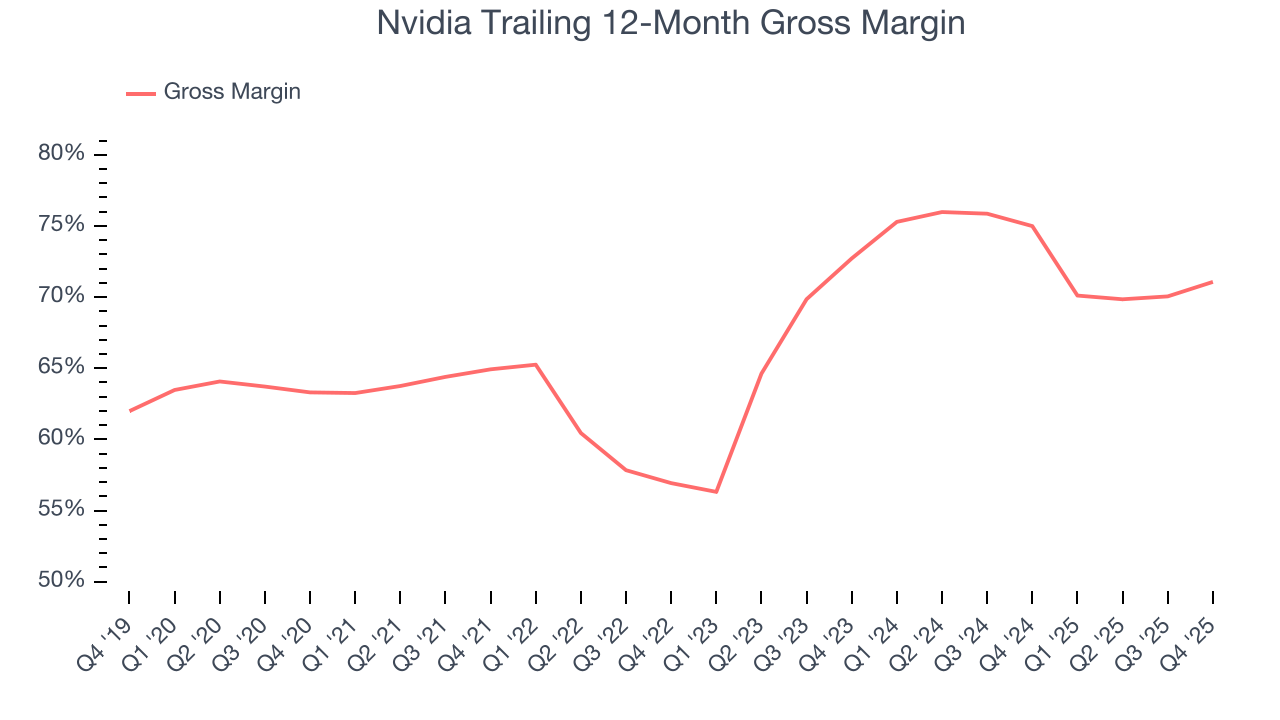
In Q4, Nvidia produced a 75% gross profit margin, up 2 percentage points year on year. On a wider time horizon, however, Nvidia’s full-year margin has been trending down over the past 12 months, decreasing by 3.9 percentage points. If this move continues, it could suggest a more competitive environment with some pressure to lower prices and higher input costs (such as raw materials and manufacturing expenses).
8. Operating Margin
Nvidia has been a well-oiled machine over the last two years. It demonstrated elite profitability for a semiconductor business, boasting an average operating margin of 61.1%. This result isn’t surprising as its high gross margin gives it a favorable starting point.
Looking at the trend in its profitability, Nvidia’s operating margin rose by 23.1 percentage points over the last five years, as its sales growth gave it immense operating leverage.
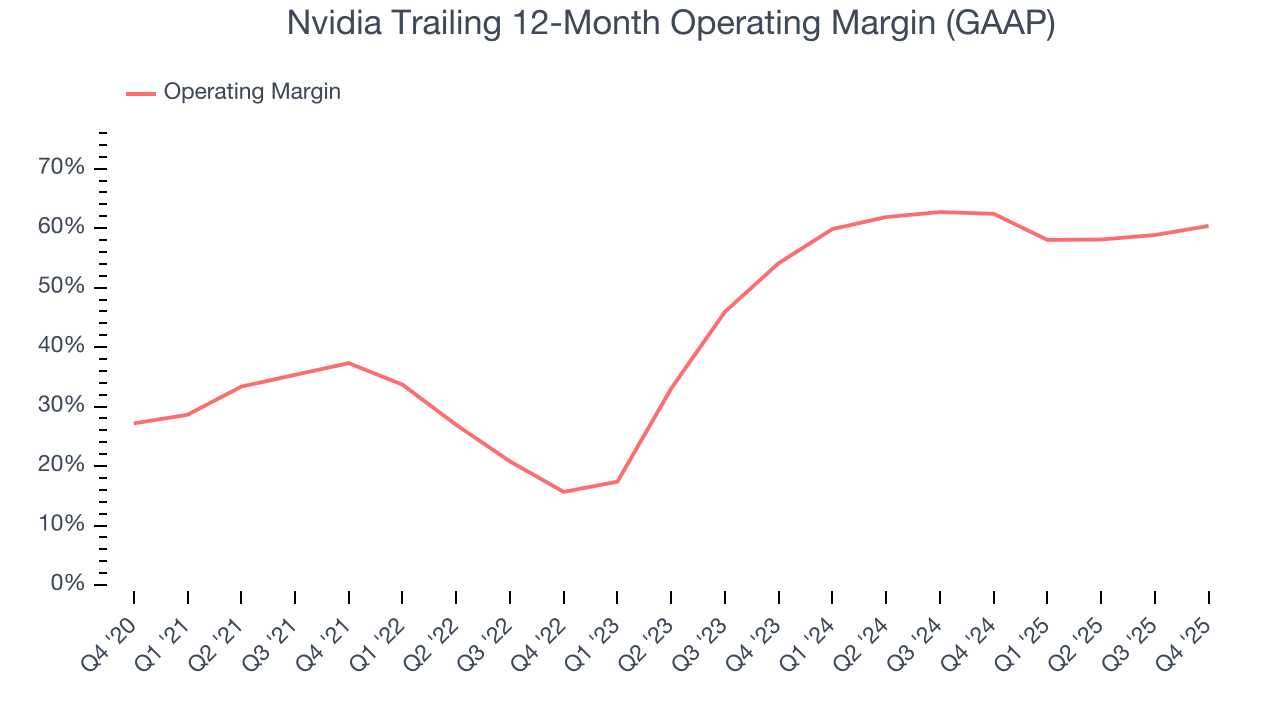
This quarter, Nvidia generated an operating margin profit margin of 65%, up 3.9 percentage points year on year. The increase was encouraging, and because its operating margin rose more than its gross margin, we can infer it was more efficient with expenses such as marketing, R&D, and administrative overhead.
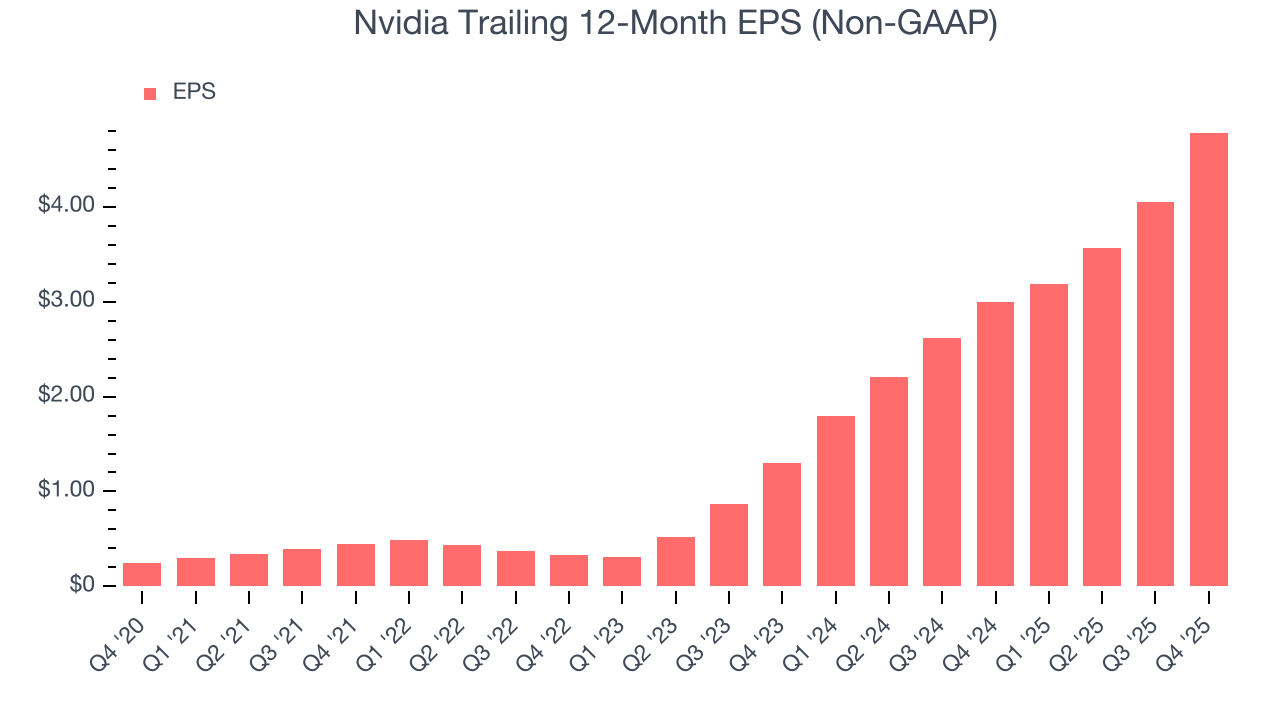
9. Earnings Per Share
Revenue trends explain a company’s historical growth, but the long-term change in earnings per share (EPS) points to the profitability of that growth – for example, a company could inflate its sales through excessive spending on advertising and promotions.
Nvidia’s EPS grew at an astounding 80.5% compounded annual growth rate over the last five years, higher than its 66.9% annualized revenue growth. This tells us the company became more profitable on a per-share basis as it expanded.
We can take a deeper look into Nvidia’s earnings to better understand the drivers of its performance. As we mentioned earlier, Nvidia’s operating margin expanded by 23.1 percentage points over the last five years. On top of that, its share count shrank by 3.2%. These are positive signs for shareholders because improving profitability and share buybacks turbocharge EPS growth relative to revenue growth. 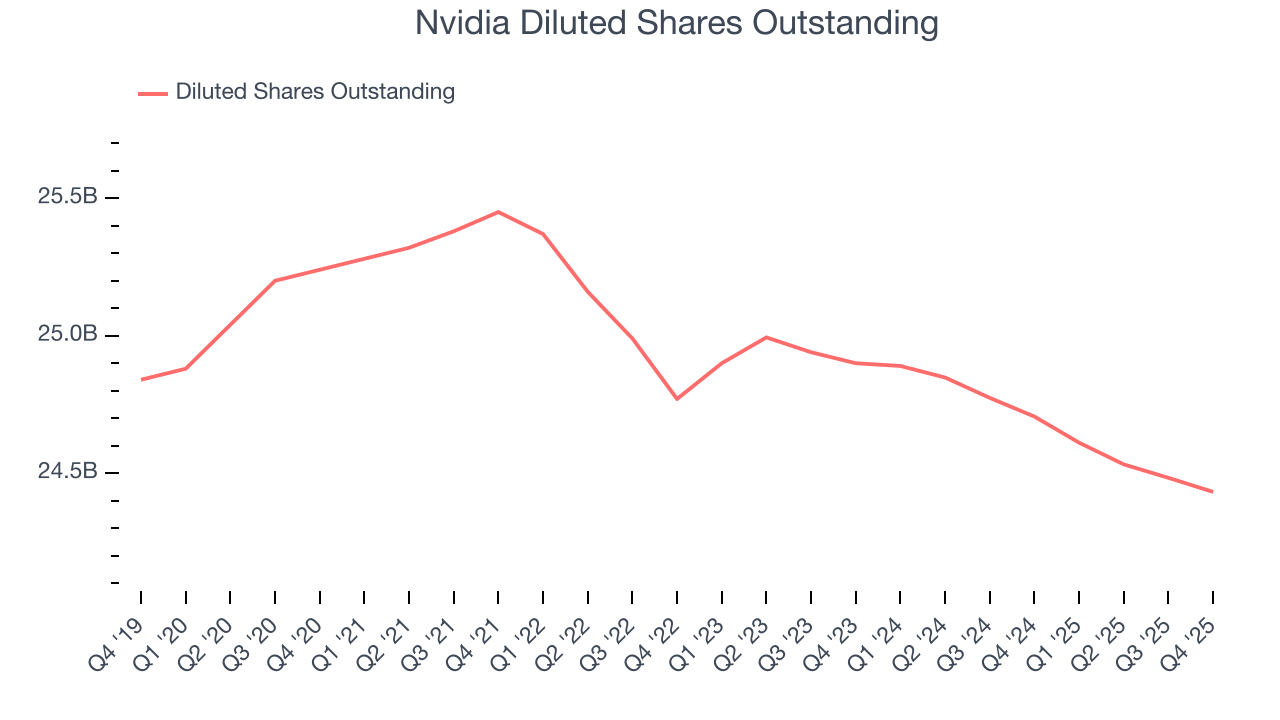
In Q4, Nvidia reported adjusted EPS of $1.62, up from $0.89 in the same quarter last year. This print beat analysts’ estimates by 5.3%. Over the next 12 months, Wall Street expects Nvidia’s full-year EPS of $4.78 to grow 65.6%.
10. Cash Is King
Although earnings are undoubtedly valuable for assessing company performance, we believe cash is king because you can’t use accounting profits to pay the bills.
Nvidia has shown terrific cash profitability, and if sustainable, puts it in an advantageous position to invest in new products, return capital to investors, and consolidate the market during industry downturns. The company’s free cash flow margin was among the best in the semiconductor sector, averaging an eye-popping 45.5% over the last two years.
Taking a step back, we can see that Nvidia’s margin expanded by 14.6 percentage points over the last five years. This is encouraging because it gives the company more optionality.
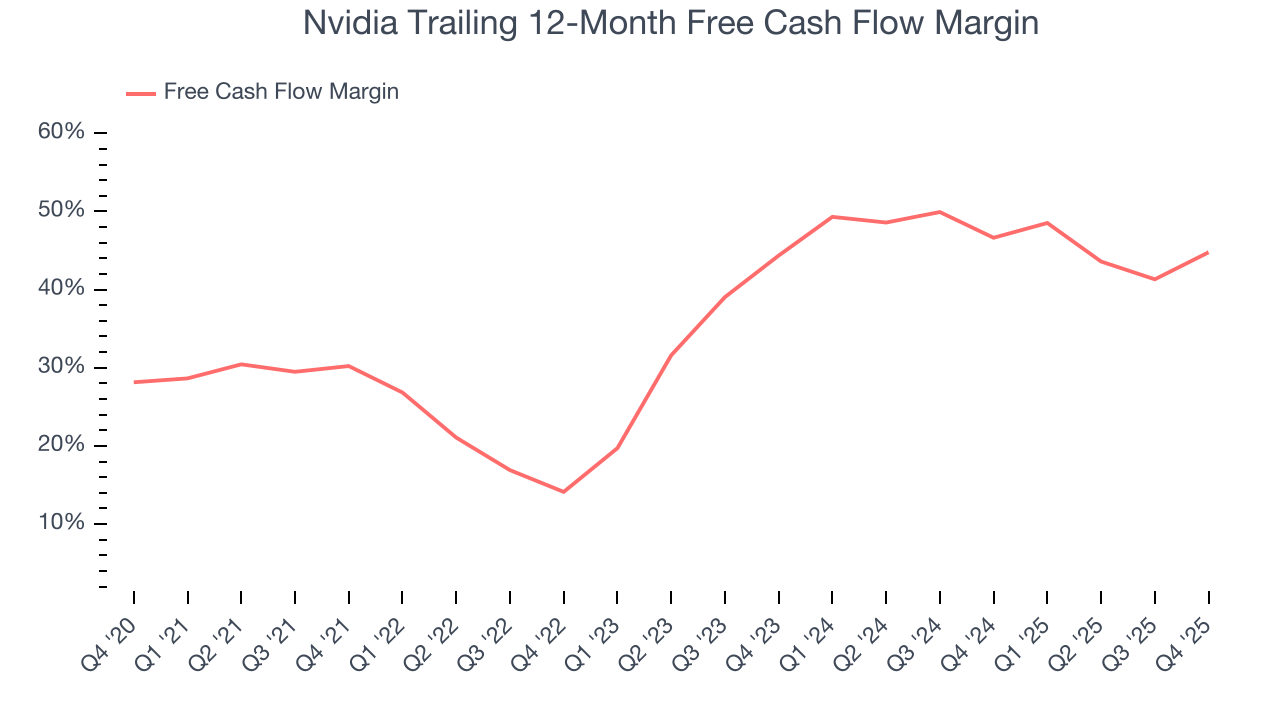
Nvidia’s free cash flow clocked in at $34.9 billion in Q4, equivalent to a 51.2% margin. This result was good as its margin was 11.7 percentage points higher than in the same quarter last year, building on its favorable historical trend.
11. Balance Sheet Assessment
Big corporations like Nvidia are attractive to many investors in times of instability thanks to their fortress balance sheets that buffer pockets of soft demand.
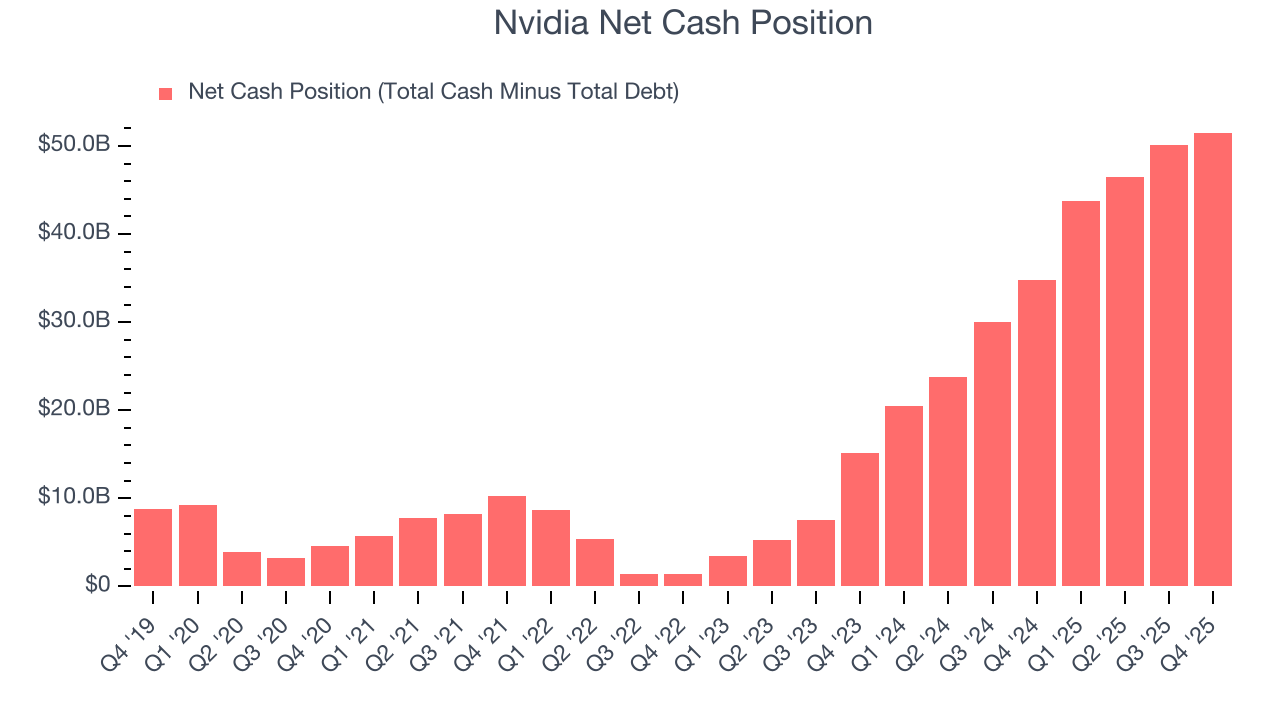
Nvidia has an eye-popping $62.56 billion of cash on its balance sheet (that’s no typo) compared to $11.04 billion of debt. This $51.52 billion net cash position is 1.1% of its market cap and shockingly larger than the value of most public companies, giving it the freedom to borrow money, return capital to shareholders, or invest in growth initiatives. Leverage is not an issue here.
12. Key Takeaways from Nvidia’s Q4 Results
We were impressed by Nvidia’s optimistic revenue guidance for next quarter, which blew past analysts’ expectations. We were also glad its revenue and EPS in the quarter outperformed Wall Street’s estimates. Zooming out, we think this was a solid print. The stock traded up 3.1% to $202.07 immediately following the results.
13. Is Now The Time To Buy Nvidia?
Updated: March 14, 2026 at 10:20 PM EDT
We think that the latest earnings result is only one piece of the bigger puzzle. If you’re deciding whether to own Nvidia, you should also grasp the company’s longer-term business quality and valuation.
Nvidia is an amazing business ranking highly on our list. For starters, its revenue growth was exceptional over the last five years, and analysts believe it can continue growing at these levels. On top of that, its admirable gross margins indicate robust pricing power, and its powerful free cash flow generation enables it to stay ahead of the competition through consistent reinvestment of profits.
Nvidia’s P/E ratio based on the next 12 months is 22.1x. Looking across the spectrum of semiconductor businesses, Nvidia’s fundamentals clearly illustrate it’s a special business. We like the stock at this price.
Wall Street analysts have a consensus one-year price target of $267.54 on the company (compared to the current share price of $180.19), implying they see 48.5% upside in buying Nvidia in the short term.