LGI Homes (LGIH)
We wouldn’t buy LGI Homes. Its plummeting sales and returns on capital show its profits are shrinking as demand fizzles out.― StockStory Analyst Team
1. News


2. Summary
Why We Think LGI Homes Will Underperform
Based in Texas, LGI Homes (NASDAQ:LGIH) is a homebuilding company specializing in constructing affordable, entry-level single-family homes in desirable communities across the United States.
- Customers postponed purchases of its products and services this cycle as its revenue declined by 2.9% annually over the last five years
- Earnings per share decreased by more than its revenue over the last five years, showing each sale was less profitable
- Depletion of cash reserves could lead to a fundraising event that triggers shareholder dilution


LGI Homes is in the doghouse. There are more appealing investments to be made.
Why There Are Better Opportunities Than LGI Homes


LGI Homes is trading at $52.34 per share, or 13.5x forward P/E. LGI Homes’s multiple may seem like a great deal among industrials peers, but we think there are valid reasons why it’s this cheap.
It’s better to pay up for high-quality businesses with higher long-term earnings potential rather than to buy lower-quality stocks because they appear cheap. These challenged businesses often don’t re-rate, a phenomenon known as a “value trap”.
3. LGI Homes (LGIH) Research Report: Q3 CY2025 Update
Affordable single-family home construction company LGI Homes (NASDAQ:LGIH) reported revenue ahead of Wall Streets expectations in Q3 CY2025, but sales fell by 39.2% year on year to $396.6 million. Its GAAP profit of $0.85 per share was 9% below analysts’ consensus estimates.
LGI Homes (LGIH) Q3 CY2025 Highlights:
- Revenue: $396.6 million vs analyst estimates of $390.4 million (39.2% year-on-year decline, 1.6% beat)
- EPS (GAAP): $0.85 vs analyst expectations of $0.93 (9% miss)
- Operating Margin: 5.4%, down from 12.3% in the same quarter last year
- Backlog: $498.7 million at quarter end, up 19.4% year on year
- Market Capitalization: $939.1 million
Company Overview
Based in Texas, LGI Homes (NASDAQ:LGIH) is a homebuilding company specializing in constructing affordable, entry-level single-family homes in desirable communities across the United States.
LGI Homes, Inc. is a residential homebuilder focused on entry-level and active adult offerings across 30+ markets in 20+ states. The company constructs and sells attached and detached single-family homes, townhomes, and luxury homes under the LGI Homes and Terrata Homes brands.
Leveraging an efficient, streamlined construction process, LGI provides move-in ready homes with standardized features and finishes. The company's even-flow methodology enables rapid home turnaround, with average completion times of 108-150 days in 2023. LGI targets first-time and active adult buyers with compelling value propositions through affordable pricing and amenity-rich communities.
The company pursues a flexible land strategy, acquiring finished lots and raw land for residential development in high-growth markets. Geographic diversification across entry-level and move-up price segments reduces exposure to regional housing cycles. LGI's wholesale business constructs homes for bulk sale to rental operators.
LGI Homes primarily generates revenue through the sale of new single-family homes, with the bulk of payment received at closing when ownership is transferred. They don't rely on long-term contracts or milestone payments. A small deposit may be collected when a sales contract is signed, but most revenue is recognized at closing. Additional income streams include mortgage and insurance services through joint ventures and wholesale home sales to institutional investors for rental properties.
4. Home Builders
Traditionally, homebuilders have built competitive advantages with economies of scale that lead to advantaged purchasing and brand recognition among consumers. Aesthetic trends have always been important in the space, but more recently, energy efficiency and conservation are driving innovation. However, these companies are still at the whim of the macro, specifically interest rates that heavily impact new and existing home sales. In fact, homebuilders are one of the most cyclical subsectors within industrials.
Competitors in the residential home construction sector include D.R. Horton (NYSE:DHI), PulteGroup (NYSE:PHM), and Meritage Homes (NYSE:MTH).
5. Revenue Growth
A company’s long-term performance is an indicator of its overall quality. Any business can put up a good quarter or two, but the best consistently grow over the long haul. LGI Homes’s demand was weak over the last five years as its sales fell at a 2.9% annual rate. This was below our standards and suggests it’s a low quality business.
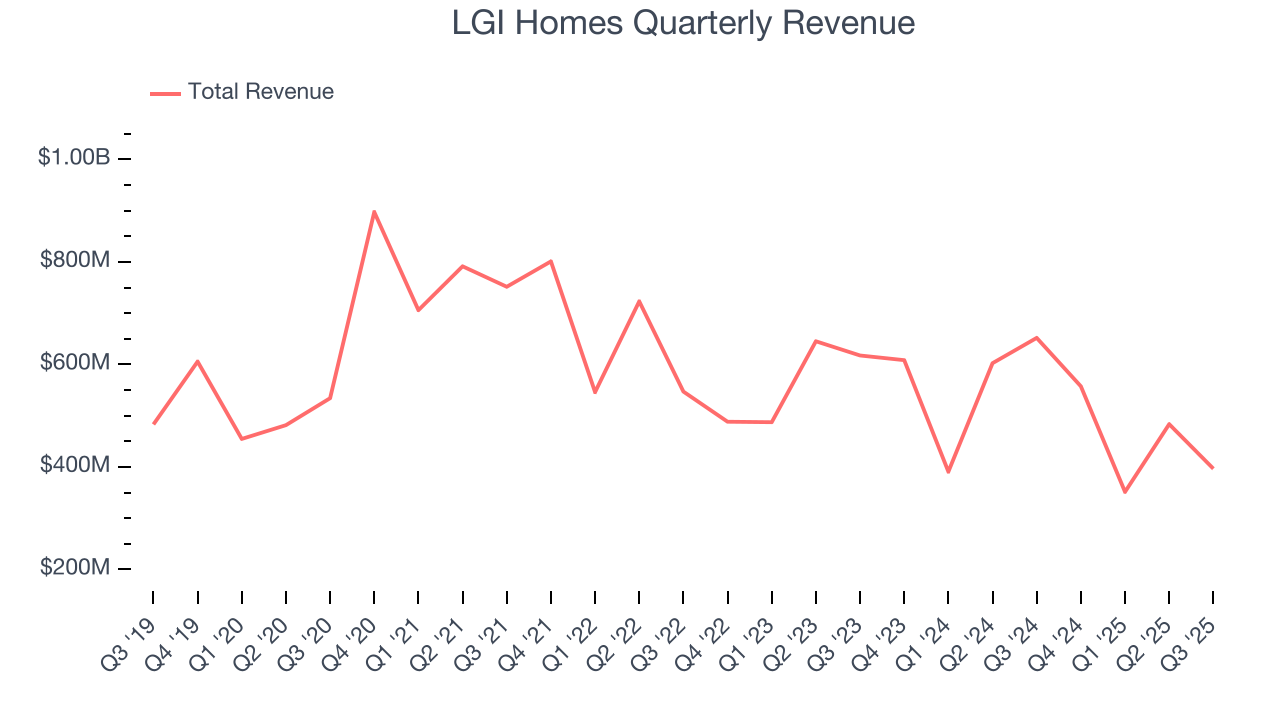
Long-term growth is the most important, but within industrials, a half-decade historical view may miss new industry trends or demand cycles. LGI Homes’s recent performance shows its demand remained suppressed as its revenue has declined by 10.6% annually over the last two years. 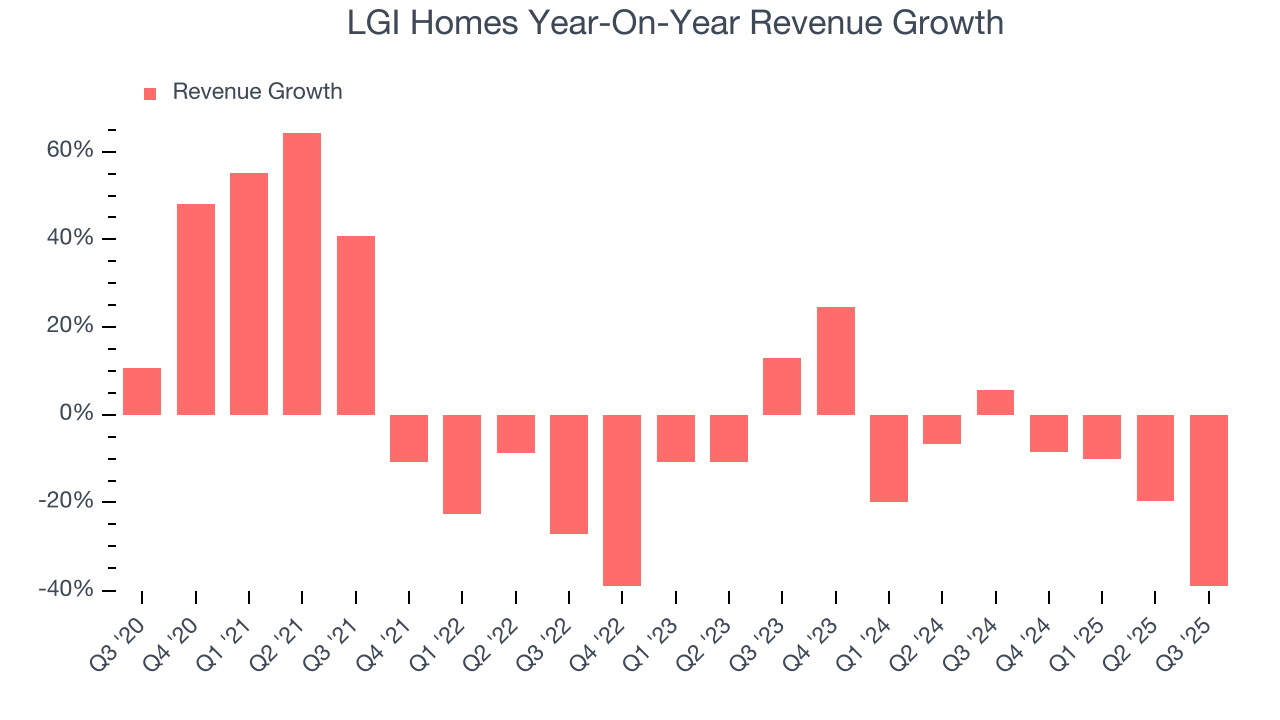
We can better understand the company’s revenue dynamics by analyzing its backlog, or the value of its outstanding orders that have not yet been executed or delivered. LGI Homes’s backlog reached $498.7 million in the latest quarter and averaged 10.4% year-on-year declines over the last two years. Because this number is in line with its revenue growth, we can see the company effectively balanced its new order intake and fulfillment processes. 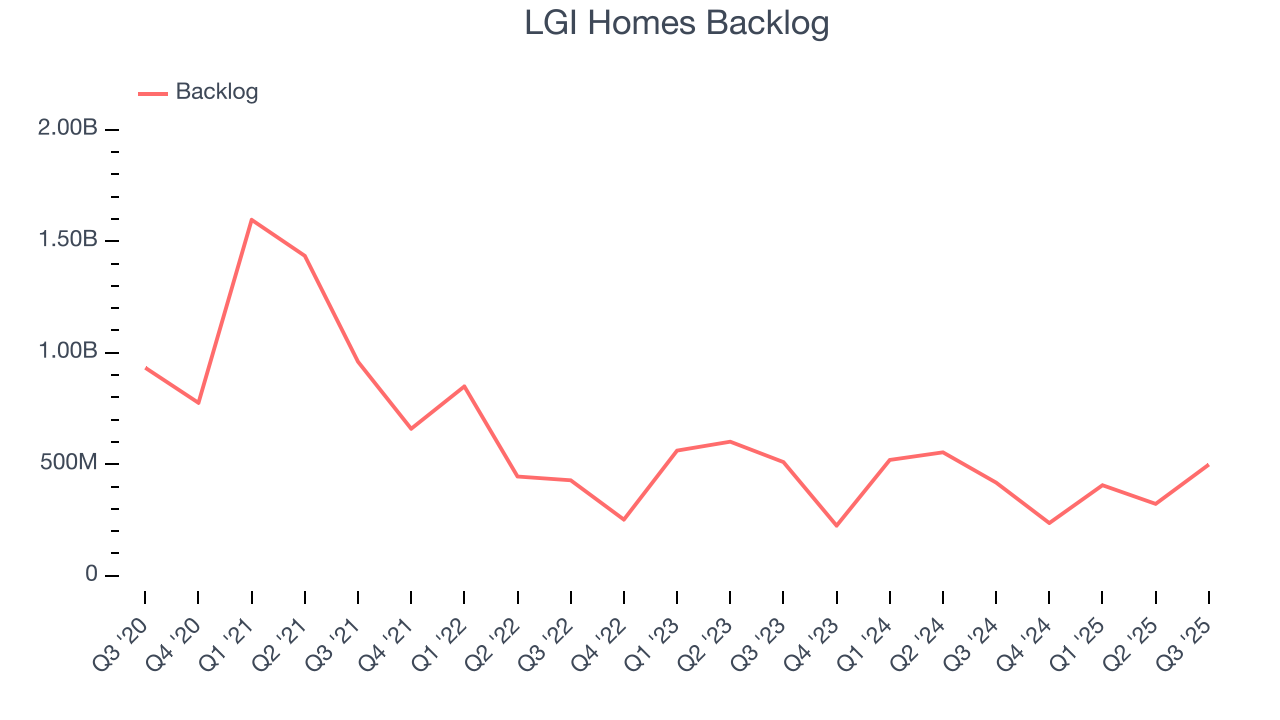
This quarter, LGI Homes’s revenue fell by 39.2% year on year to $396.6 million but beat Wall Street’s estimates by 1.6%.
Looking ahead, sell-side analysts expect revenue to grow 3.1% over the next 12 months. While this projection implies its newer products and services will spur better top-line performance, it is still below average for the sector.
6. Gross Margin & Pricing Power
Cost of sales for an industrials business is usually comprised of the direct labor, raw materials, and supplies needed to offer a product or service. These costs can be impacted by inflation and supply chain dynamics.
LGI Homes has bad unit economics for an industrials company, giving it less room to reinvest and develop new offerings. As you can see below, it averaged a 25.6% gross margin over the last five years. Said differently, LGI Homes had to pay a chunky $74.44 to its suppliers for every $100 in revenue. 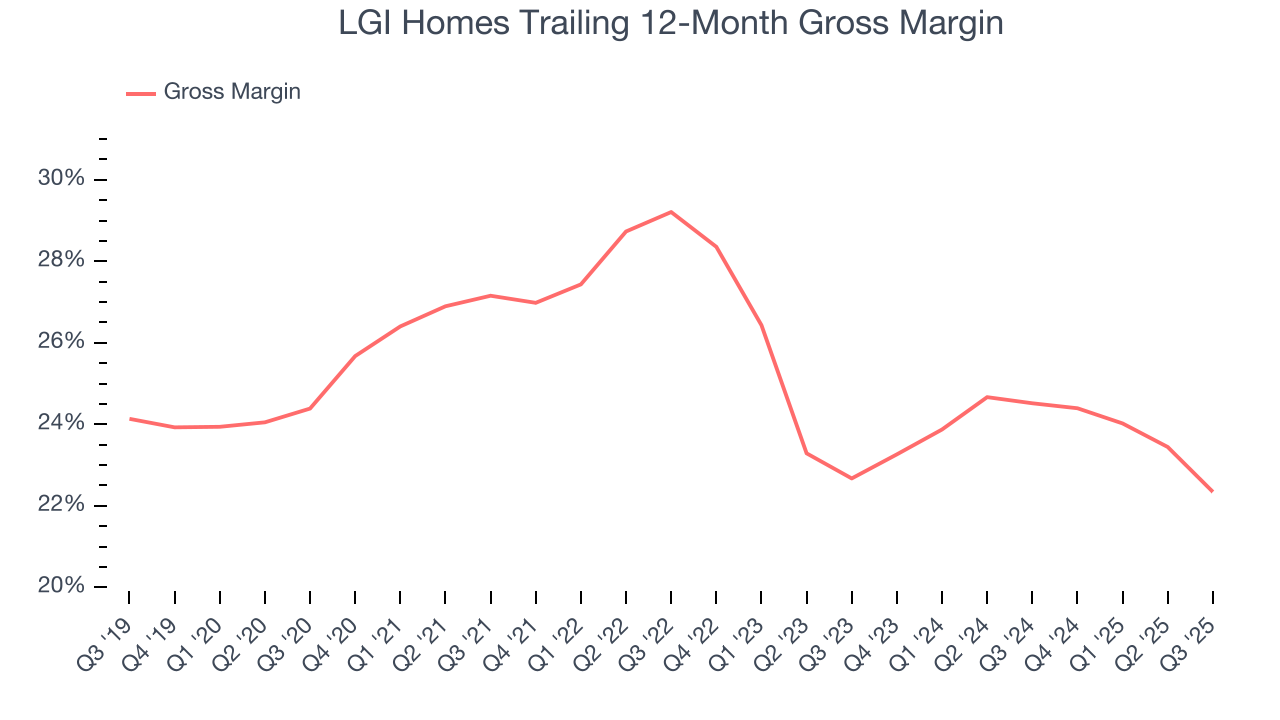
In Q3, LGI Homes produced a 21.5% gross profit margin, marking a 3.8 percentage point decrease from 25.3% in the same quarter last year. LGI Homes’s full-year margin has also been trending down over the past 12 months, decreasing by 2.2 percentage points. If this move continues, it could suggest a more competitive environment with some pressure to lower prices and higher input costs (such as raw materials and manufacturing expenses).
7. Operating Margin
LGI Homes has been an efficient company over the last five years. It was one of the more profitable businesses in the industrials sector, boasting an average operating margin of 13.4%. This result was particularly impressive because of its low gross margin, which is mostly a factor of what it sells and takes huge shifts to move meaningfully. Companies have more control over their operating margins, and it’s a show of well-managed operations if they’re high when gross margins are low.
Analyzing the trend in its profitability, LGI Homes’s operating margin decreased by 12.2 percentage points over the last five years. Even though its historical margin was healthy, shareholders will want to see LGI Homes become more profitable in the future.
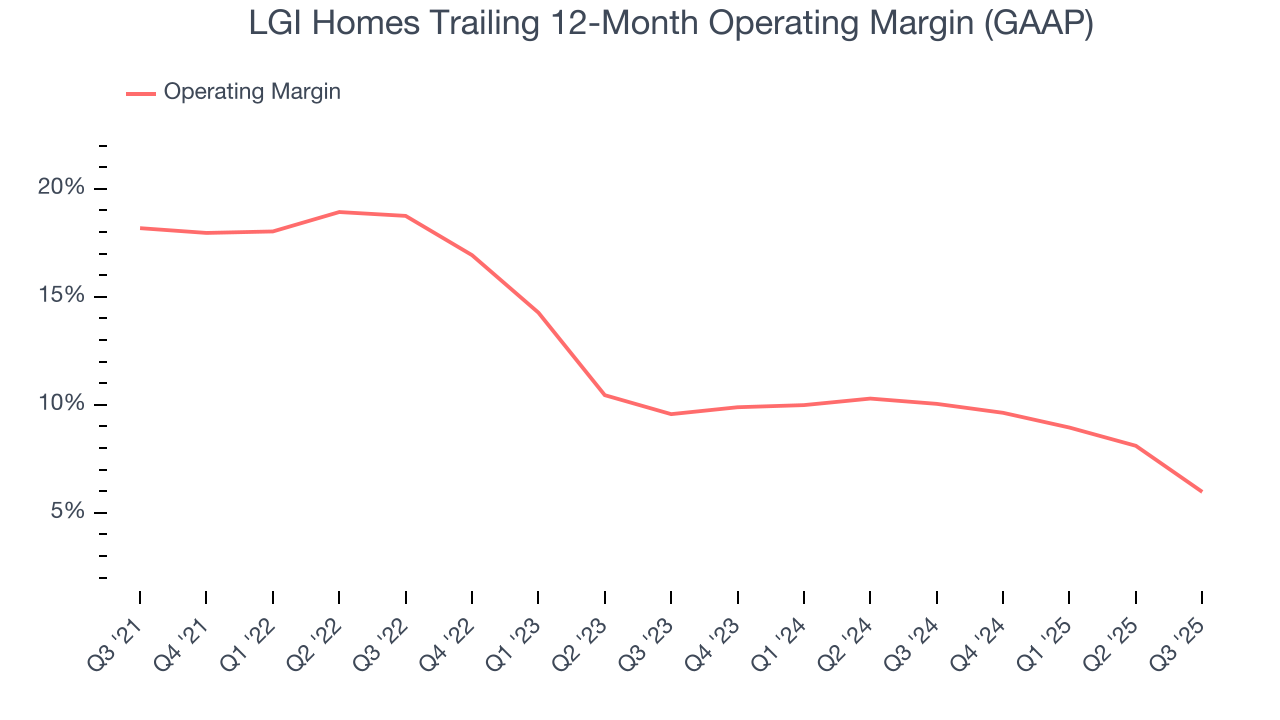
In Q3, LGI Homes generated an operating margin profit margin of 5.4%, down 6.9 percentage points year on year. Since LGI Homes’s operating margin decreased more than its gross margin, we can assume it was less efficient because expenses such as marketing, R&D, and administrative overhead increased.
8. Earnings Per Share
We track the long-term change in earnings per share (EPS) for the same reason as long-term revenue growth. Compared to revenue, however, EPS highlights whether a company’s growth is profitable.
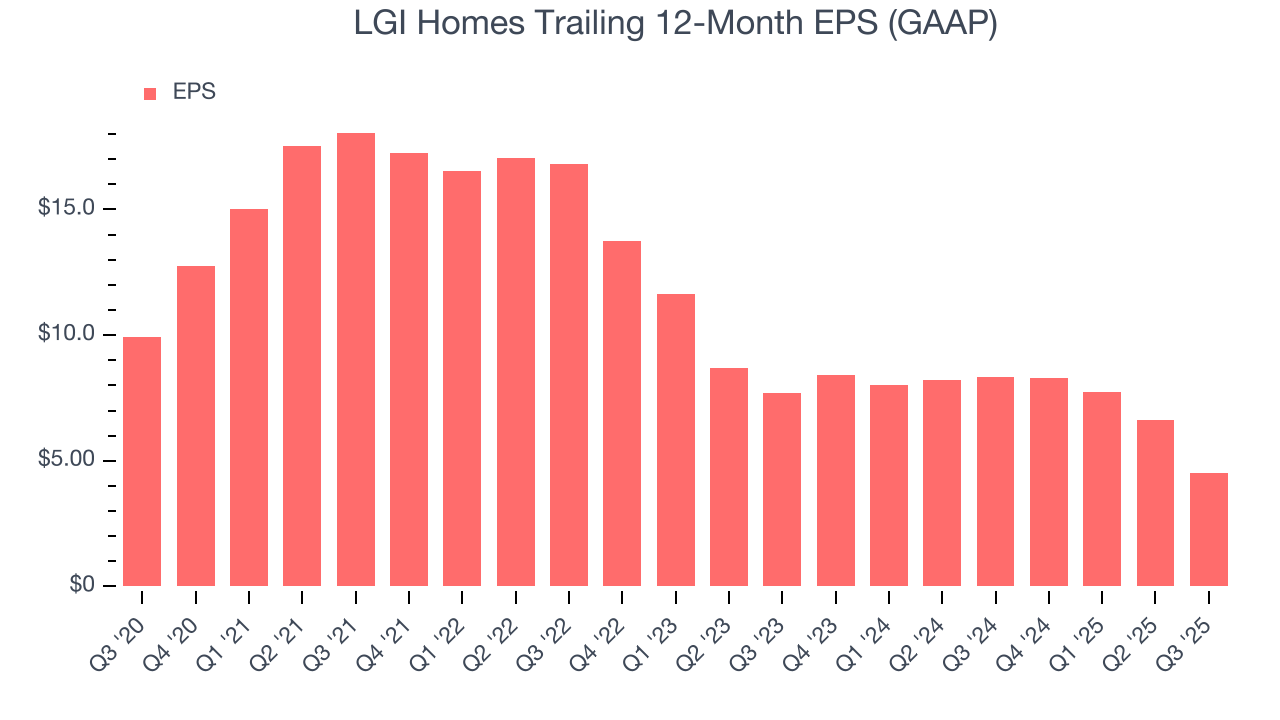
Sadly for LGI Homes, its EPS declined by 14.5% annually over the last five years, more than its revenue. This tells us the company struggled because its fixed cost base made it difficult to adjust to shrinking demand.
Diving into the nuances of LGI Homes’s earnings can give us a better understanding of its performance. As we mentioned earlier, LGI Homes’s operating margin declined by 12.2 percentage points over the last five years. This was the most relevant factor (aside from the revenue impact) behind its lower earnings; interest expenses and taxes can also affect EPS but don’t tell us as much about a company’s fundamentals.
Like with revenue, we analyze EPS over a shorter period to see if we are missing a change in the business.
For LGI Homes, its two-year annual EPS declines of 23.2% show it’s continued to underperform. These results were bad no matter how you slice the data.
In Q3, LGI Homes reported EPS of $0.85, down from $2.95 in the same quarter last year. This print missed analysts’ estimates. Over the next 12 months, Wall Street expects LGI Homes’s full-year EPS of $4.53 to shrink by 4.4%.
9. Cash Is King
Free cash flow isn't a prominently featured metric in company financials and earnings releases, but we think it's telling because it accounts for all operating and capital expenses, making it tough to manipulate. Cash is king.
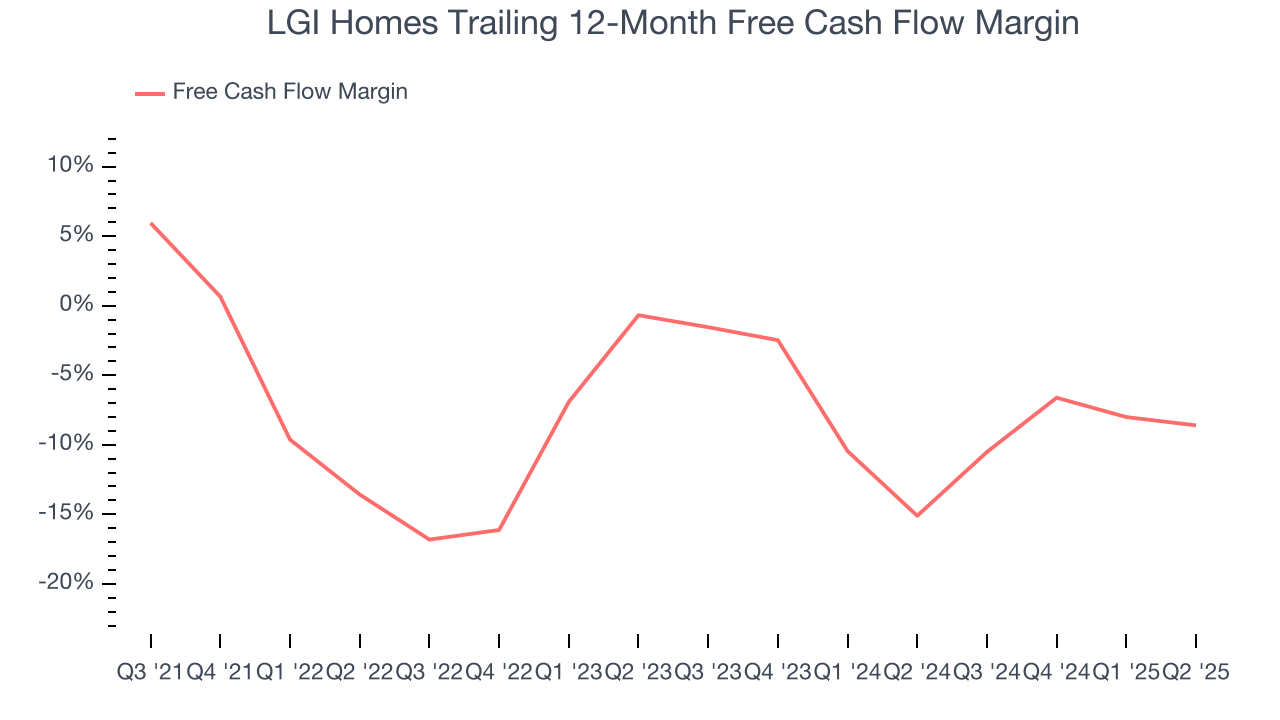
LGI Homes’s demanding reinvestments have drained its resources over the last five years, putting it in a pinch and limiting its ability to return capital to investors. Its free cash flow margin averaged negative 5.9%, meaning it lit $5.86 of cash on fire for every $100 in revenue. This is a stark contrast from its operating margin, and its investments in working capital/capital expenditures are the primary culprit.
Taking a step back, we can see that LGI Homes’s margin dropped by 20.8 percentage points during that time. Almost any movement in the wrong direction is undesirable because it is already burning cash. If the trend continues, it could signal it’s becoming a more capital-intensive business.
10. Return on Invested Capital (ROIC)
EPS and free cash flow tell us whether a company was profitable while growing its revenue. But was it capital-efficient? A company’s ROIC explains this by showing how much operating profit it makes compared to the money it has raised (debt and equity).
LGI Homes’s management team makes decent investment decisions and generates value for shareholders. Its five-year average ROIC was 10.8%, slightly better than typical industrials business.
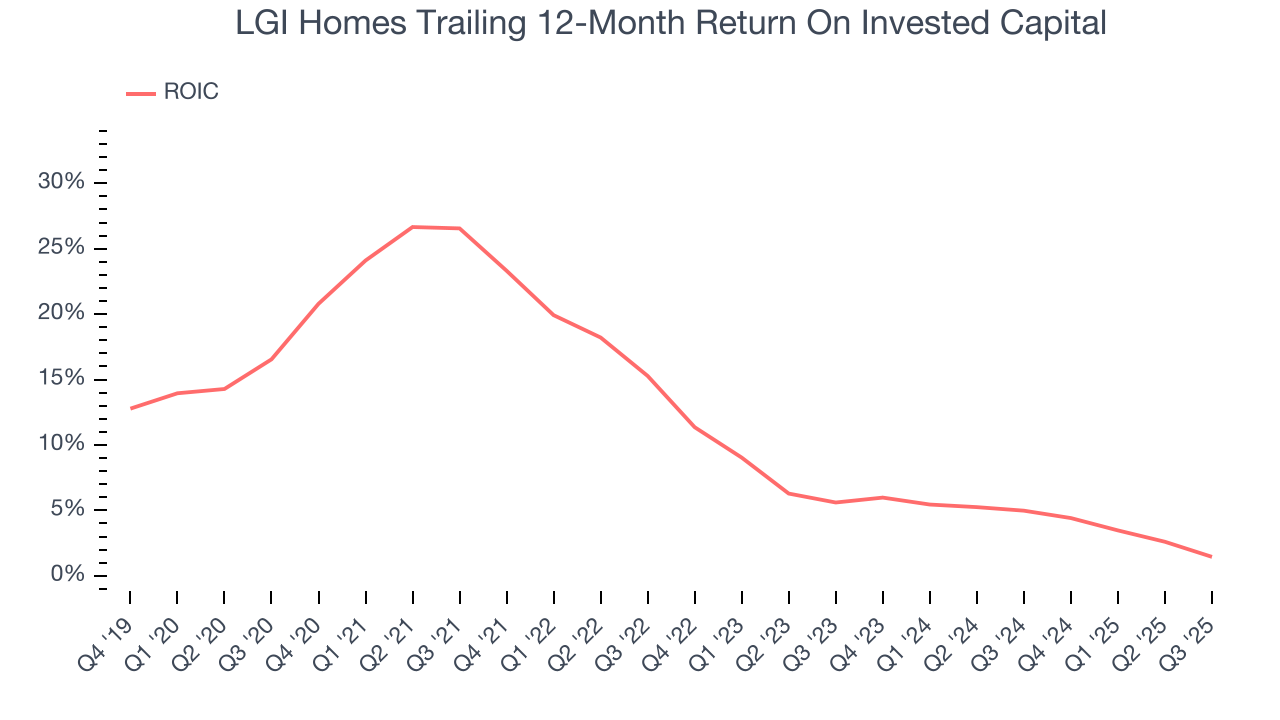
We like to invest in businesses with high returns, but the trend in a company’s ROIC is what often surprises the market and moves the stock price. Over the last few years, LGI Homes’s ROIC has unfortunately decreased significantly. We like what management has done in the past, but its declining returns are perhaps a symptom of fewer profitable growth opportunities.
11. Balance Sheet Risk
Debt is a tool that can boost company returns but presents risks if used irresponsibly. As long-term investors, we aim to avoid companies taking excessive advantage of this instrument because it could lead to insolvency.
LGI Homes’s $3.50 billion of debt exceeds the $61.98 million of cash on its balance sheet. Furthermore, its 31× net-debt-to-EBITDA ratio (based on its EBITDA of $110.6 million over the last 12 months) shows the company is overleveraged.
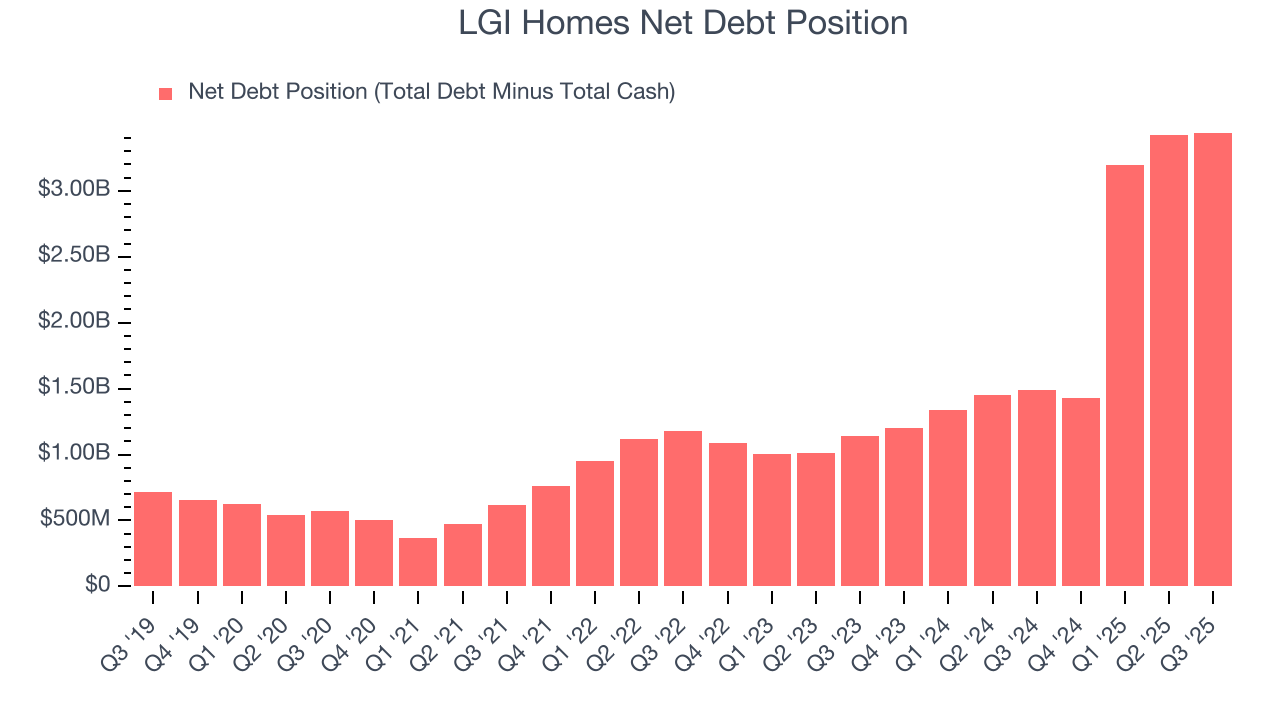
At this level of debt, incremental borrowing becomes increasingly expensive and credit agencies could downgrade the company’s rating if profitability falls. LGI Homes could also be backed into a corner if the market turns unexpectedly – a situation we seek to avoid as investors in high-quality companies.
We hope LGI Homes can improve its balance sheet and remain cautious until it increases its profitability or pays down its debt.
12. Key Takeaways from LGI Homes’s Q3 Results
It was encouraging to see LGI Homes beat analysts’ revenue expectations this quarter. On the other hand, its EPS missed and its backlog fell slightly short of Wall Street’s estimates. Overall, this quarter could have been better. The stock remained flat at $41.01 immediately after reporting.
13. Is Now The Time To Buy LGI Homes?
Updated: January 24, 2026 at 10:36 PM EST
When considering an investment in LGI Homes, investors should account for its valuation and business qualities as well as what’s happened in the latest quarter.
LGI Homes falls short of our quality standards. To begin with, its revenue has declined over the last five years. And while its strong operating margins show it’s a well-run business, the downside is its diminishing returns show management's prior bets haven't worked out. On top of that, its projected EPS for the next year is lacking.
LGI Homes’s P/E ratio based on the next 12 months is 13.5x. This valuation tells us it’s a bit of a market darling with a lot of good news priced in - we think other companies feature superior fundamentals at the moment.
Wall Street analysts have a consensus one-year price target of $67.50 on the company (compared to the current share price of $52.34).
Although the price target is bullish, readers should exercise caution because analysts tend to be overly optimistic. The firms they work for, often big banks, have relationships with companies that extend into fundraising, M&A advisory, and other rewarding business lines. As a result, they typically hesitate to say bad things for fear they will lose out. We at StockStory do not suffer from such conflicts of interest, so we’ll always tell it like it is.