
Landstar (LSTR)
Landstar is in for a bumpy ride. Its poor sales growth and falling returns on capital suggest its growth opportunities are shrinking.― StockStory Analyst Team
1. News


2. Summary
Why We Think Landstar Will Underperform
Covering billions of miles throughout North America, Landstar (NASDAQ:LSTR) is a transportation company specializing in freight and last-mile delivery services.
- Annual sales declines of 5.4% for the past two years show its products and services struggled to connect with the market during this cycle
- Earnings per share have contracted by 6.1% annually over the last five years, a headwind for returns as stock prices often echo long-term EPS performance
- Gross margin of 20.3% reflects its high production costs


Landstar doesn’t measure up to our expectations. There’s a wealth of better opportunities.
Why There Are Better Opportunities Than Landstar


Landstar’s stock price of $147.96 implies a valuation ratio of 27.1x forward P/E. Not only does Landstar trade at a premium to companies in the industrials space, but this multiple is also high for its top-line growth.
There are stocks out there featuring similar valuation multiples with better fundamentals. We prefer to invest in those.
3. Landstar (LSTR) Research Report: Q4 CY2025 Update
Freight delivery company Landstar (NASDAQ:LSTR) fell short of the markets revenue expectations in Q4 CY2025, with sales falling 3.2% year on year to $1.17 billion. Its GAAP profit of $0.70 per share was 29.1% below analysts’ consensus estimates.
Landstar (LSTR) Q4 CY2025 Highlights:
- Revenue: $1.17 billion vs analyst estimates of $1.19 billion (3.2% year-on-year decline, 1.6% miss)
- EPS (GAAP): $0.70 vs analyst expectations of $0.99 (29.1% miss)
- Adjusted EBITDA: $40.06 million vs analyst estimates of $66.15 million (3.4% margin, 39.4% miss)
- Operating Margin: 2.5%, down from 4.8% in the same quarter last year
- Market Capitalization: $5.21 billion
Company Overview
Covering billions of miles throughout North America, Landstar (NASDAQ:LSTR) is a transportation company specializing in freight and last-mile delivery services.
Landstar was created in 1988 to buy IU Truckload Group from NEOAX. Since its inception, the company has acquired several small to mid sized truckload carriers offering similar services to expand its operations. For example, its acquisition of Intermodal Transport Company enabled it to offer deliveries that use more than one type of transportation and TLC Lines provided additional trucks and routes.
Its truckload transportation deliveries involve a truck with a singular customer's goods and offers several specialized options. For instance, its temperature controlled-services use trucks equipped with refrigeration or heating units, ideal for transporting perishable goods like food or pharmaceuticals. For smaller shipments that don’t require a full truck, Landstar's less-than-truckload (LTL) service consolidates cargo from multiple customers into a single truck. It collects smaller shipments from various customers, combines them at a central hub, and then transports them with its own fleet of trucks.
When shipments need to arrive quickly, it offers expedited transportation services which potentially involve air transport. It also provides its customers with intermodal transportation services which combine trucks with trains, ships, or planes to move goods over long distances. In addition to its core offerings, the company also offers warehousing, inventory management, and final delivery services.
Landstar doesn't own a large fleet of trucks or employ many drivers directly. Instead, it uses a network of independent agents who find and coordinate shipping jobs. These agents match these jobs with third-party truck owners and operators, also known as capacity providers, who do the actual transporting.
Landstar contracts can include fixed rates or pricing based on the volume of shipments, with the structure varying according to the delivery method. Contracts for FTL services often feature fixed rates per mile or per load, along with additional fuel surcharges. On the other hand, LTL contracts prices its contracts based on the shipment’s weight, volume, and distance.
4. Ground Transportation
The growth of e-commerce and global trade continues to drive demand for shipping services, especially last-mile delivery, presenting opportunities for ground transportation companies. The industry continues to invest in data, analytics, and autonomous fleets to optimize efficiency and find the most cost-effective routes. Despite the essential services this industry provides, ground transportation companies are still at the whim of economic cycles. Consumer spending, for example, can greatly impact the demand for these companies’ offerings while fuel costs can influence profit margins.
Competitors offering similar products include J.B. Hunt (NASDAQ:JBHT), Old Dominion (NASDAQ:ODFL), and Knight-Swift Transportation (NYSE:SWFT).
5. Revenue Growth
A company’s long-term performance is an indicator of its overall quality. Any business can put up a good quarter or two, but many enduring ones grow for years. Unfortunately, Landstar’s 2.8% annualized revenue growth over the last five years was sluggish. This was below our standards and is a tough starting point for our analysis.
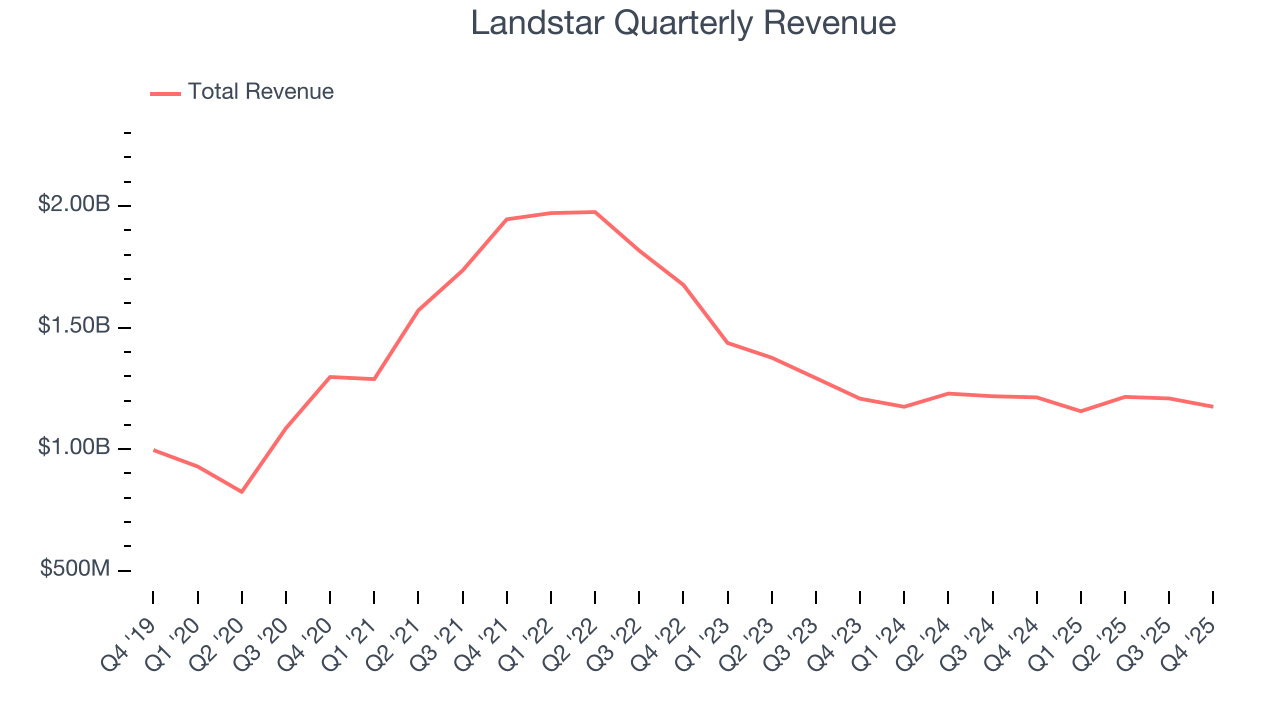
Long-term growth is the most important, but within industrials, a half-decade historical view may miss new industry trends or demand cycles. Landstar’s performance shows it grew in the past but relinquished its gains over the last two years, as its revenue fell by 5.4% annually. Landstar isn’t alone in its struggles as the Ground Transportation industry experienced a cyclical downturn, with many similar businesses observing lower sales at this time. 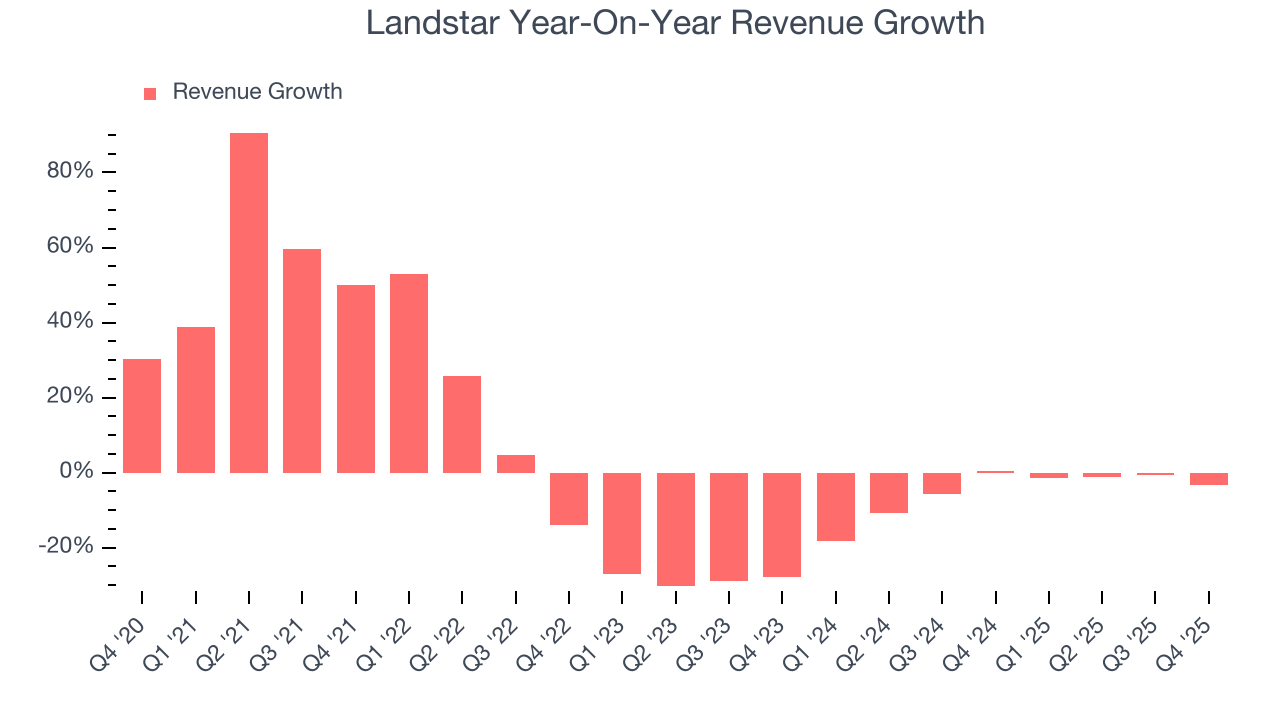
We can dig further into the company’s revenue dynamics by analyzing its most important segments, Van Equipment and Platform Equipment, which are 47.6% and 34.1% of revenue. Over the last two years, Landstar’s Van Equipment revenue (full truckload van transportation) averaged 7.6% year-on-year declines. On the other hand, its Platform Equipment revenue (full truckload trailer transportation) averaged 1.4% growth. 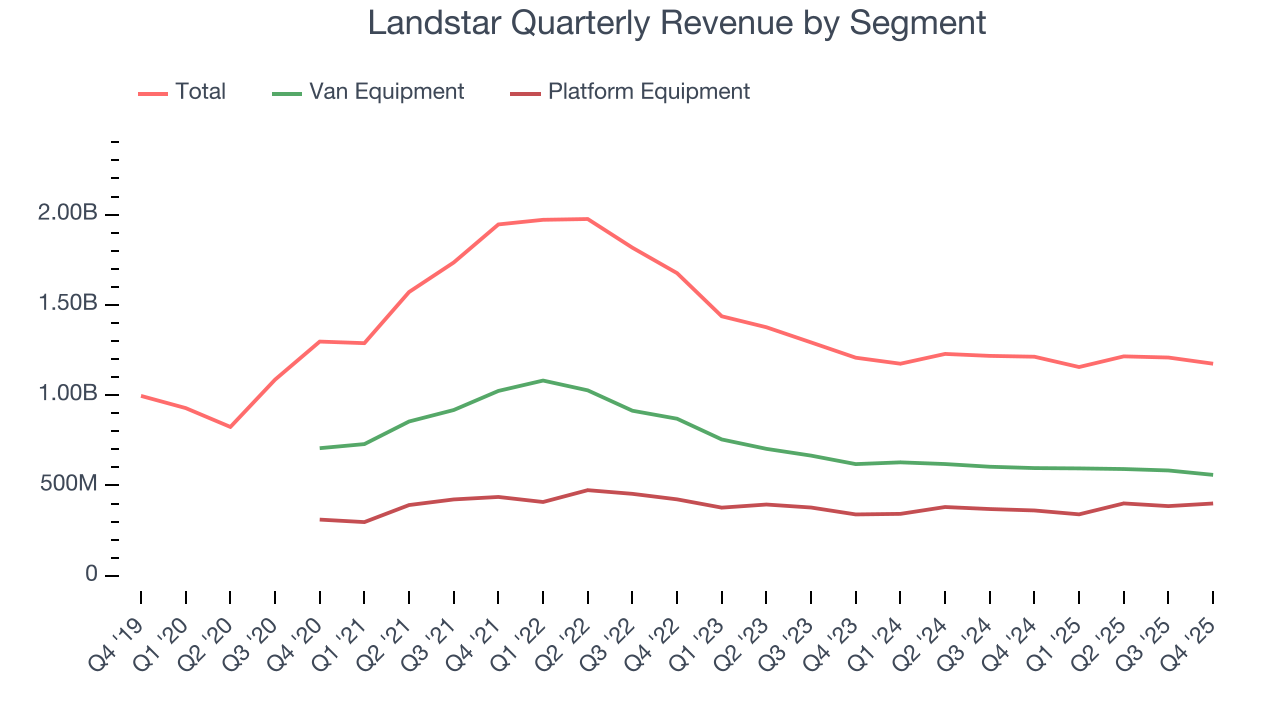
This quarter, Landstar missed Wall Street’s estimates and reported a rather uninspiring 3.2% year-on-year revenue decline, generating $1.17 billion of revenue.
Looking ahead, sell-side analysts expect revenue to grow 6.8% over the next 12 months. While this projection implies its newer products and services will catalyze better top-line performance, it is still below the sector average.
6. Gross Margin & Pricing Power
Landstar has bad unit economics for an industrials business, signaling it operates in a competitive market. As you can see below, it averaged a 19.8% gross margin over the last five years. That means Landstar paid its suppliers a lot of money ($80.21 for every $100 in revenue) to run its business. 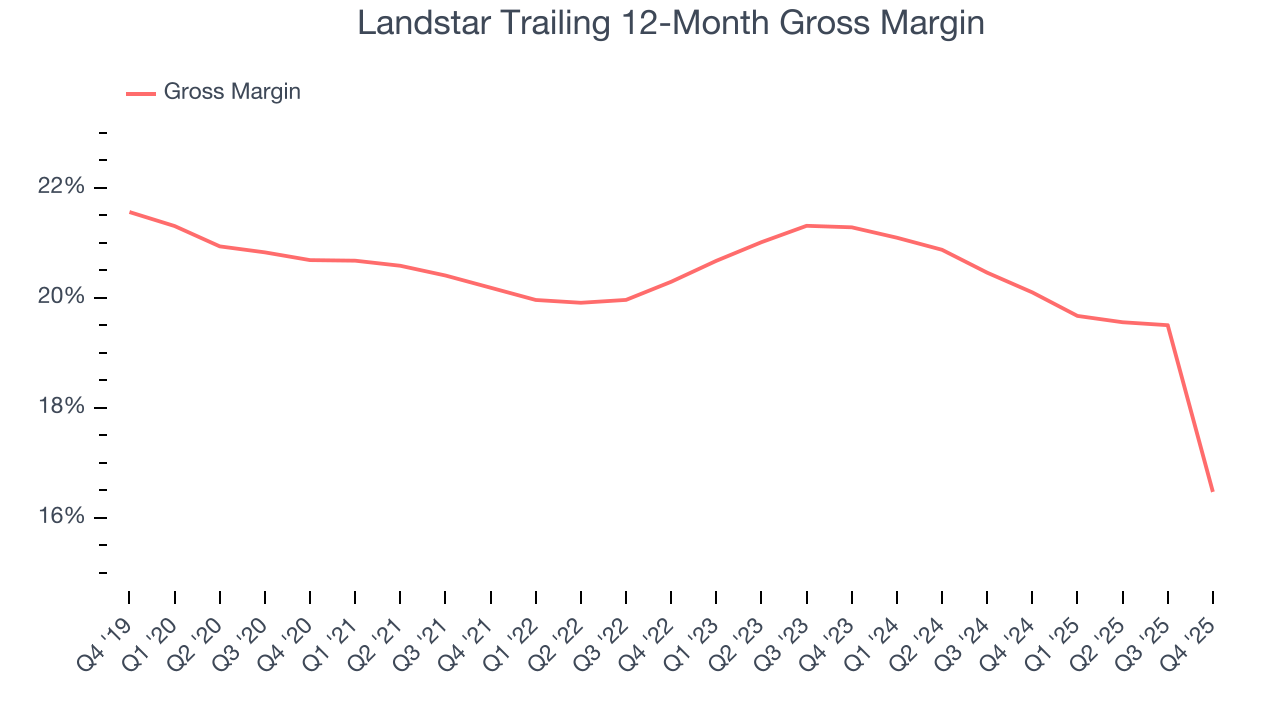
Landstar produced a 7.3% gross profit margin in Q4, down 12.3 percentage points year on year. Landstar’s full-year margin has also been trending down over the past 12 months, decreasing by 3.6 percentage points. If this move continues, it could suggest a more competitive environment with some pressure to lower prices and higher input costs (such as raw materials and manufacturing expenses).
7. Operating Margin
Landstar was profitable over the last five years but held back by its large cost base. Its average operating margin of 6.3% was weak for an industrials business. This result isn’t too surprising given its low gross margin as a starting point.
Looking at the trend in its profitability, Landstar’s operating margin decreased by 4.5 percentage points over the last five years. This raises questions about the company’s expense base because its revenue growth should have given it leverage on its fixed costs, resulting in better economies of scale and profitability. We’ve noticed many Ground Transportation companies also saw their margins fall (along with revenue, as mentioned above) because the cycle turned in the wrong direction, but Landstar’s performance was poor no matter how you look at it. It shows that costs were rising and it couldn’t pass them onto its customers.
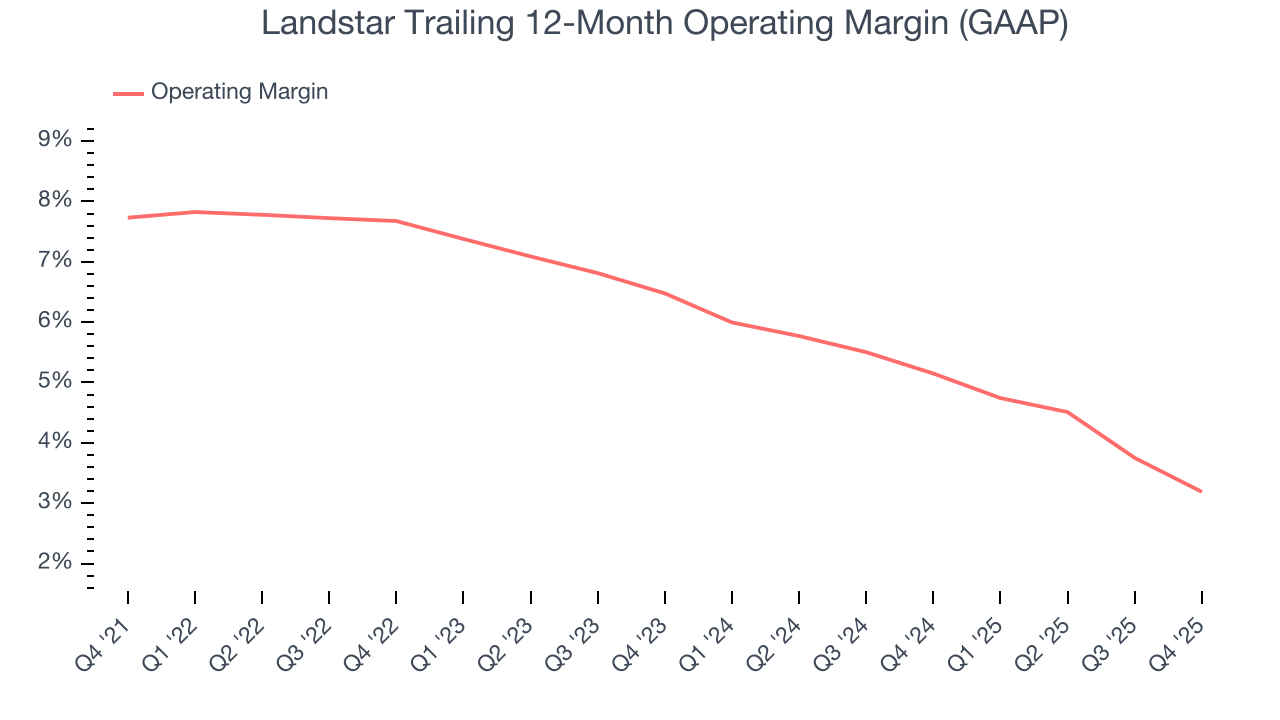
This quarter, Landstar generated an operating margin profit margin of 2.5%, down 2.2 percentage points year on year. Since Landstar’s gross margin decreased more than its operating margin, we can assume its recent inefficiencies were driven more by weaker leverage on its cost of sales rather than increased marketing, R&D, and administrative overhead expenses.
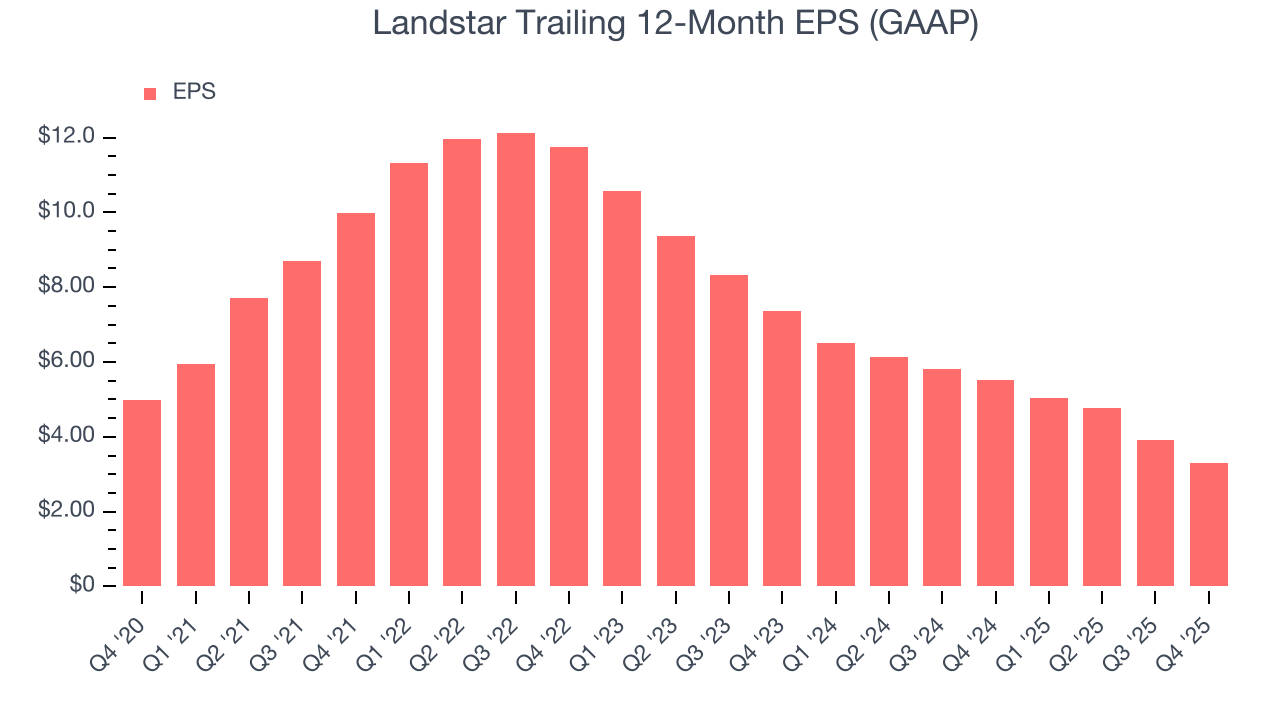
8. Earnings Per Share
Revenue trends explain a company’s historical growth, but the long-term change in earnings per share (EPS) points to the profitability of that growth – for example, a company could inflate its sales through excessive spending on advertising and promotions.
Sadly for Landstar, its EPS declined by 7.9% annually over the last five years while its revenue grew by 2.8%. This tells us the company became less profitable on a per-share basis as it expanded due to non-fundamental factors such as interest expenses and taxes.
Diving into the nuances of Landstar’s earnings can give us a better understanding of its performance. As we mentioned earlier, Landstar’s operating margin declined by 4.5 percentage points over the last five years. This was the most relevant factor (aside from the revenue impact) behind its lower earnings; interest expenses and taxes can also affect EPS but don’t tell us as much about a company’s fundamentals.
Like with revenue, we analyze EPS over a shorter period to see if we are missing a change in the business.
For Landstar, its two-year annual EPS declines of 33% show it’s continued to underperform. These results were bad no matter how you slice the data.
In Q4, Landstar reported EPS of $0.70, down from $1.31 in the same quarter last year. This print missed analysts’ estimates. Over the next 12 months, Wall Street expects Landstar’s full-year EPS of $3.31 to grow 64%.
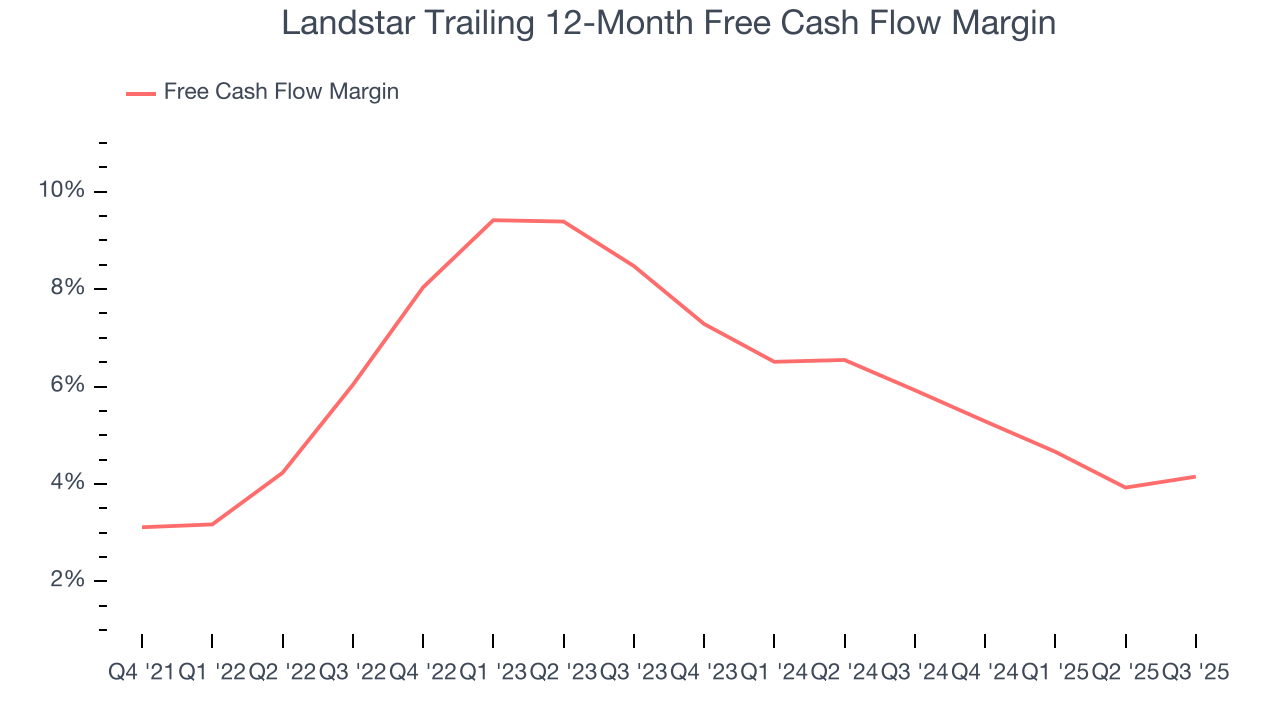
9. Cash Is King
Free cash flow isn't a prominently featured metric in company financials and earnings releases, but we think it's telling because it accounts for all operating and capital expenses, making it tough to manipulate. Cash is king.
Landstar has shown mediocre cash profitability over the last five years, giving the company limited opportunities to return capital to shareholders. Its free cash flow margin averaged 5.7%, subpar for an industrials business.
10. Return on Invested Capital (ROIC)
EPS and free cash flow tell us whether a company was profitable while growing its revenue. But was it capital-efficient? A company’s ROIC explains this by showing how much operating profit it makes compared to the money it has raised (debt and equity).
Although Landstar hasn’t been the highest-quality company lately because of its poor revenue and EPS performance, it found a few growth initiatives in the past that worked out wonderfully. Its five-year average ROIC was 40.4%, splendid for an industrials business.
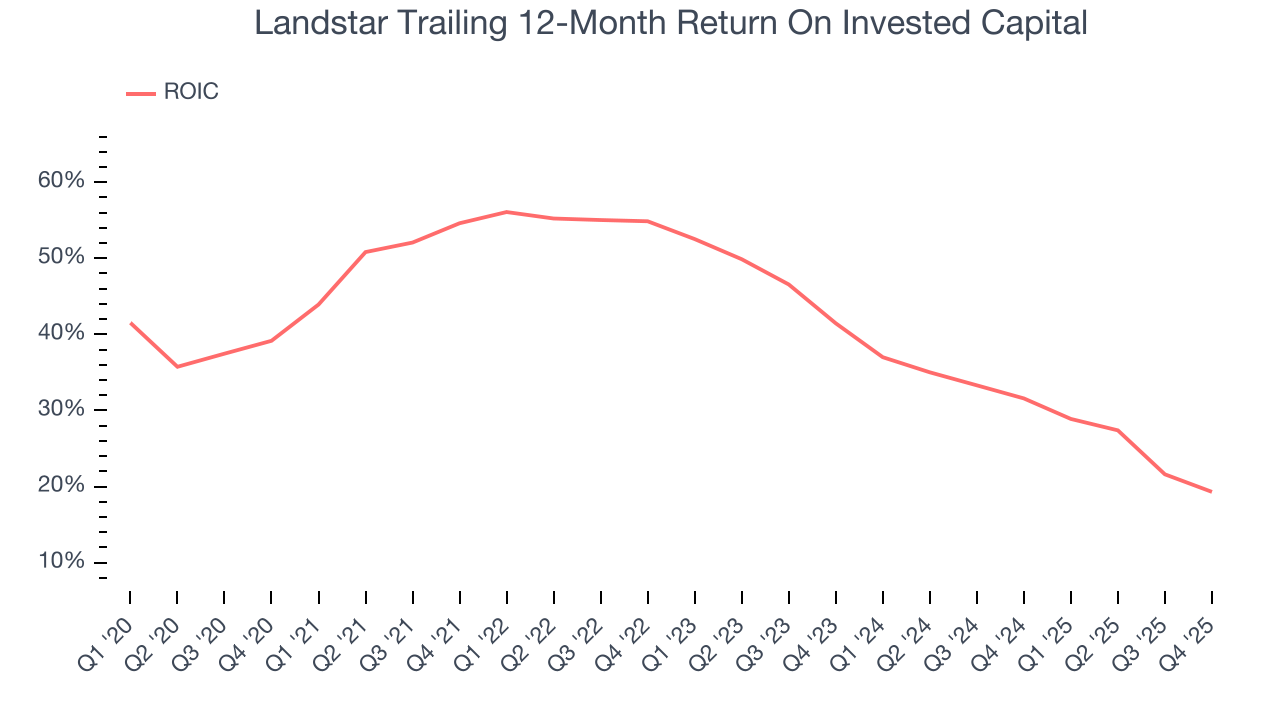
We like to invest in businesses with high returns, but the trend in a company’s ROIC is what often surprises the market and moves the stock price. Over the last few years, Landstar’s ROIC has unfortunately decreased significantly. We like what management has done in the past, but its declining returns are perhaps a symptom of fewer profitable growth opportunities.
11. Balance Sheet Assessment
Companies with more cash than debt have lower bankruptcy risk.
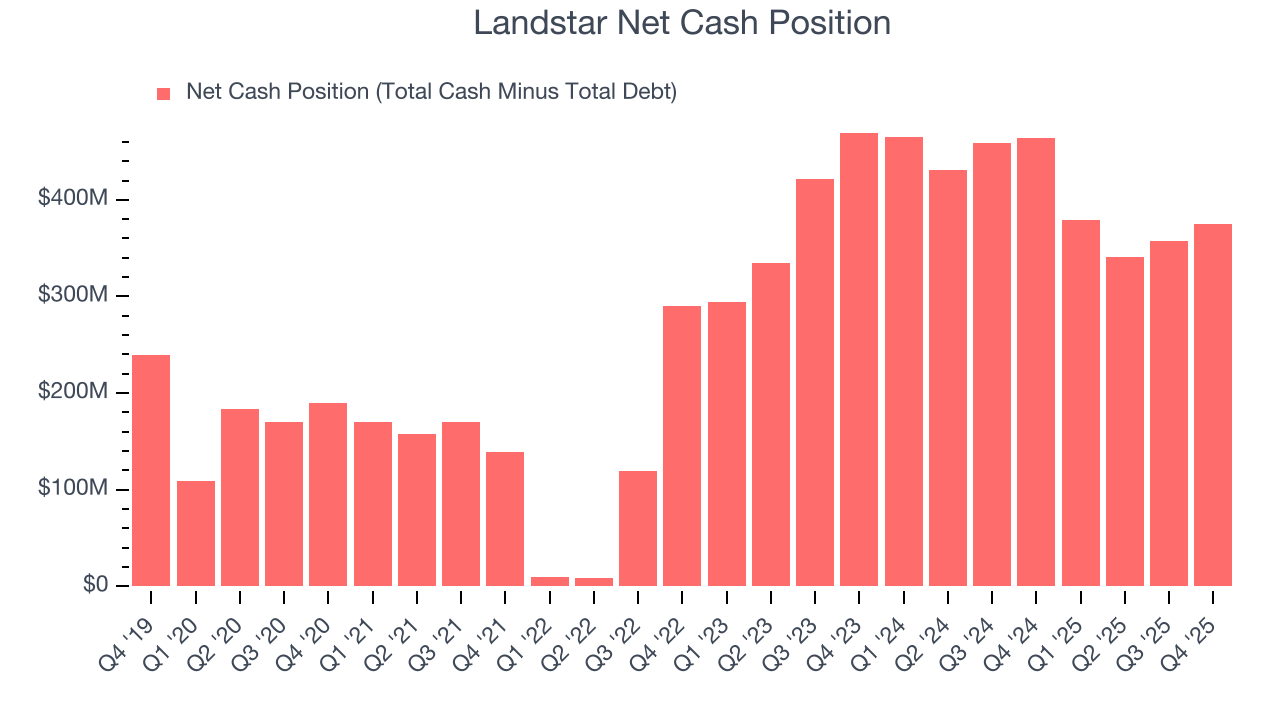
Landstar is a profitable, well-capitalized company with $452.2 million of cash and $76.82 million of debt on its balance sheet. This $375.4 million net cash position is 7.3% of its market cap and gives it the freedom to borrow money, return capital to shareholders, or invest in growth initiatives. Leverage is not an issue here.
12. Key Takeaways from Landstar’s Q4 Results
We were impressed by how significantly Landstar blew past analysts’ Platform Equipment revenue expectations this quarter. On the other hand, its Van Equipment revenue missed and its EBITDA fell short of Wall Street’s estimates. Overall, this was a weaker quarter. The stock traded down 2% to $150.23 immediately following the results.
13. Is Now The Time To Buy Landstar?
Updated: March 15, 2026 at 11:32 PM EDT
Before making an investment decision, investors should account for Landstar’s business fundamentals and valuation in addition to what happened in the latest quarter.
Landstar doesn’t pass our quality test. To begin with, its revenue growth was weak over the last five years. While its projected EPS for the next year implies the company’s fundamentals will improve, the downside is its diminishing returns show management's prior bets haven't worked out. On top of that, its declining EPS over the last five years makes it a less attractive asset to the public markets.
Landstar’s P/E ratio based on the next 12 months is 27.1x. This valuation tells us it’s a bit of a market darling with a lot of good news priced in - we think there are better opportunities elsewhere.
Wall Street analysts have a consensus one-year price target of $151.27 on the company (compared to the current share price of $147.96).