
Lululemon (LULU)
Lululemon is a compelling stock. It generates heaps of cash that are reinvested into the business, creating a virtuous cycle of returns.― StockStory Analyst Team
1. News


2. Summary
Why We Like Lululemon
Originally serving yogis and hockey players, Lululemon (NASDAQ:LULU) is a designer, distributor, and retailer of athletic apparel for men and women.
- Offensive push to build new stores and attack its untapped market opportunities is backed by its same-store sales growth
- Unique assortment of products and pricing power are reflected in its best-in-class gross margin of 57.9%
- Successful business model is illustrated by its impressive operating margin


We have an affinity for Lululemon. The valuation looks fair when considering its quality, so this might be a good time to invest in some shares.
Why Is Now The Time To Buy Lululemon?


Lululemon is trading at $156.68 per share, or 12.9x forward P/E. Scanning the consumer retail landscape, we think this multiple is reasonable - arguably even attractive - for the quality you get.
Entry price matters far less than business fundamentals if you’re investing for a multi-year period. But if you can get a bargain price it’s certainly icing on the cake.
3. Lululemon (LULU) Research Report: Q4 CY2025 Update
Athletic apparel retailer Lululemon (NASDAQ:LULU) reported revenue ahead of Wall Street’s expectations in Q4 CY2025, but sales were flat year on year at $3.64 billion. On the other hand, next quarter’s revenue guidance of $2.42 billion was less impressive, coming in 2.1% below analysts’ estimates. Its GAAP profit of $5.01 per share was 4.9% above analysts’ consensus estimates.
Lululemon (LULU) Q4 CY2025 Highlights:
- Revenue: $3.64 billion vs analyst estimates of $3.57 billion (flat year on year, 1.8% beat)
- EPS (GAAP): $5.01 vs analyst estimates of $4.78 (4.9% beat)
- Revenue Guidance for Q1 CY2026 is $2.42 billion at the midpoint, below analyst estimates of $2.47 billion
- EPS (GAAP) guidance for the upcoming financial year 2026 is $12.20 at the midpoint, missing analyst estimates by 2.8%
- Operating Margin: 22.3%, down from 28.9% in the same quarter last year
- Locations: 811 at quarter end, up from 767 in the same quarter last year
- Same-Store Sales rose 3% year on year, in line with the same quarter last year
- Market Capitalization: $18.76 billion
Company Overview
Originally serving yogis and hockey players, Lululemon (NASDAQ:LULU) is a designer, distributor, and retailer of athletic apparel for men and women.
Lululemon was founded in 1998 to provide stylish athletic wear that supports an active and healthy lifestyle. The brand emerged from the growing demand for functional yet fashionable fitness apparel, starting with yoga wear and expanding to a wide range of athletic and leisure clothing.
The company's offerings encompass athletic wear, including yoga pants, running gear, workout accessories, and lifestyle apparel. It addresses the gap in the market for premium, well-crafted athletic apparel that can transition seamlessly from the gym to daily life - you might have heard the term 'Athleisure', which Lululemon pioneered. The brand has cultivated a loyal customer base through its products, customer support (such as free alterations), and community events.
Lululemon's revenue stems from product sales in its company-owned stores and direct-to-consumer channels. E-commerce makes up a large chunk of its revenue, and customers are encouraged to download its mobile app to track purchases and create support tickets for alterations. It also generates sales through certain wholesale accounts, licenses and supply arrangements, gently-used products through its "Like New" program, and connected hardware and associated subscriptions through Lululemon Studio.
4. Apparel Retailer
Apparel sales are not driven so much by personal needs but by seasons, trends, and innovation, and over the last few decades, the category has shifted meaningfully online. Retailers that once only had brick-and-mortar stores are responding with omnichannel presences. The online shopping experience continues to improve and retail foot traffic in places like shopping malls continues to stall, so the evolution of clothing sellers marches on.
Competitors in the athletic apparel industry include Nike (NYSE:NKE), Under Armour (NYSE:UA), and Columbia Sportswear (NASDAQ:COLM).
5. Revenue Growth
A company’s long-term sales performance is one signal of its overall quality. Any business can put up a good quarter or two, but the best consistently grow over the long haul.
With $11.1 billion in revenue over the past 12 months, Lululemon is a mid-sized retailer, which sometimes brings disadvantages compared to larger competitors benefiting from better economies of scale. On the bright side, it can still flex high growth rates because it’s working from a smaller revenue base.
As you can see below, Lululemon’s sales grew at a decent 11% compounded annual growth rate over the last three years as it opened new stores and increased sales at existing, established locations.
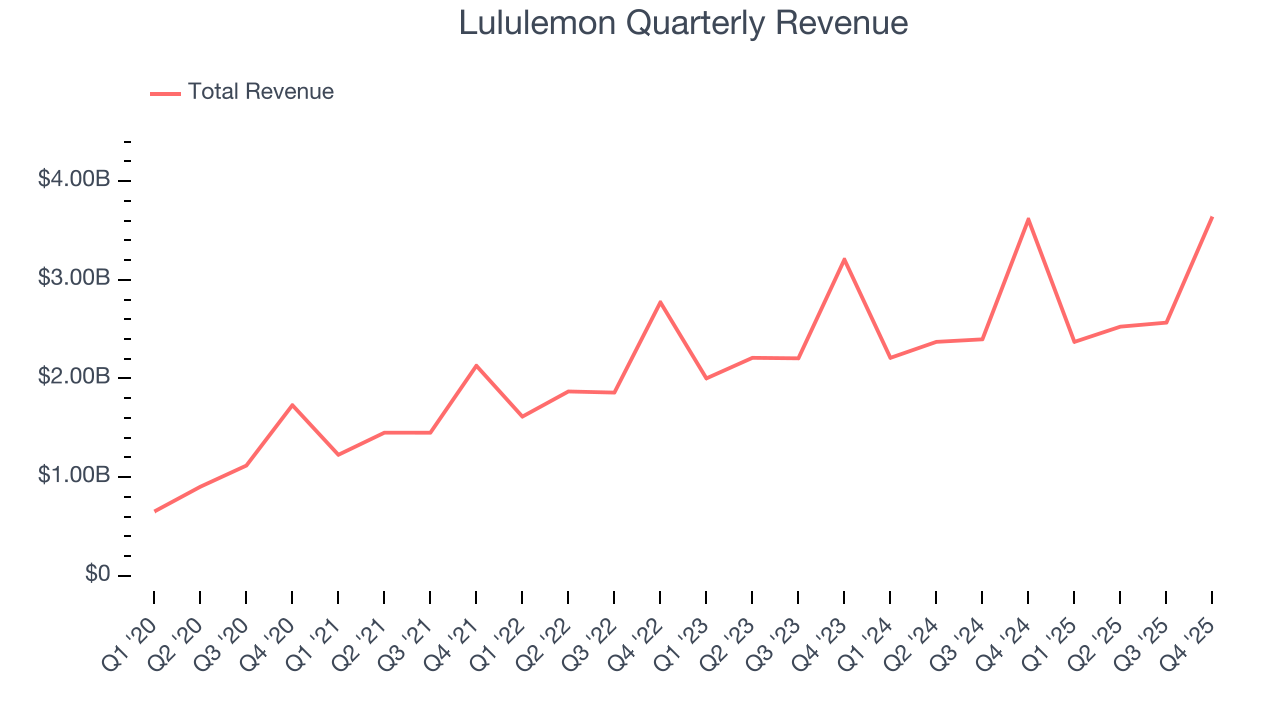
This quarter, Lululemon’s $3.64 billion of revenue was flat year on year but beat Wall Street’s estimates by 1.8%. Company management is currently guiding for a 1.9% year-on-year increase in sales next quarter.
Looking further ahead, sell-side analysts expect revenue to grow 3.3% over the next 12 months, a deceleration versus the last three years. We still think its growth trajectory is satisfactory given its scale and indicates the market is baking in success for its products.
6. Store Performance
Number of Stores
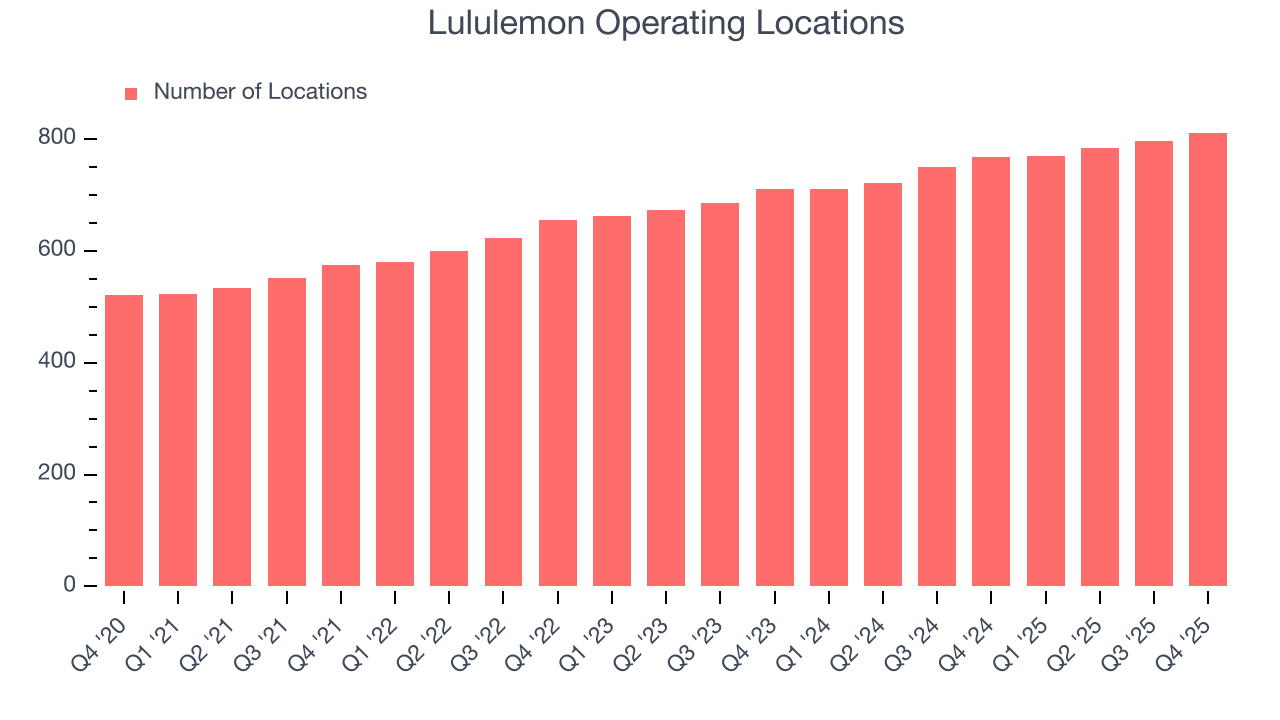
A retailer’s store count often determines how much revenue it can generate.
Lululemon sported 811 locations in the latest quarter. Over the last two years, it has opened new stores at a rapid clip by averaging 7.6% annual growth, among the fastest in the consumer retail sector. This gives it a chance to become a large, scaled business over time.
When a retailer opens new stores, it usually means it’s investing for growth because demand is greater than supply, especially in areas where consumers may not have a store within reasonable driving distance.
Same-Store Sales
The change in a company's store base only tells one side of the story. The other is the performance of its existing locations and e-commerce sales, which informs management teams whether they should expand or downsize their physical footprints. Same-store sales gives us insight into this topic because it measures organic growth for a retailer's e-commerce platform and brick-and-mortar shops that have existed for at least a year.
Lululemon’s demand has been healthy for a retailer over the last two years. On average, the company has grown its same-store sales by a robust 2.6% per year. This performance suggests its rollout of new stores could be beneficial for shareholders. When a retailer has demand, more locations should help it reach more customers and boost revenue growth.

In the latest quarter, Lululemon’s same-store sales rose 3% year on year. This performance was more or less in line with its historical levels.
7. Gross Margin & Pricing Power
We prefer higher gross margins because they not only make it easier to generate more operating profits but also indicate product differentiation, negotiating leverage, and pricing power.
Lululemon has best-in-class unit economics for a retailer, enabling it to invest in areas such as marketing and talent. As you can see below, it averaged an elite 57.9% gross margin over the last two years. That means for every $100 in revenue, only $42.12 went towards paying for inventory, transportation, and distribution. 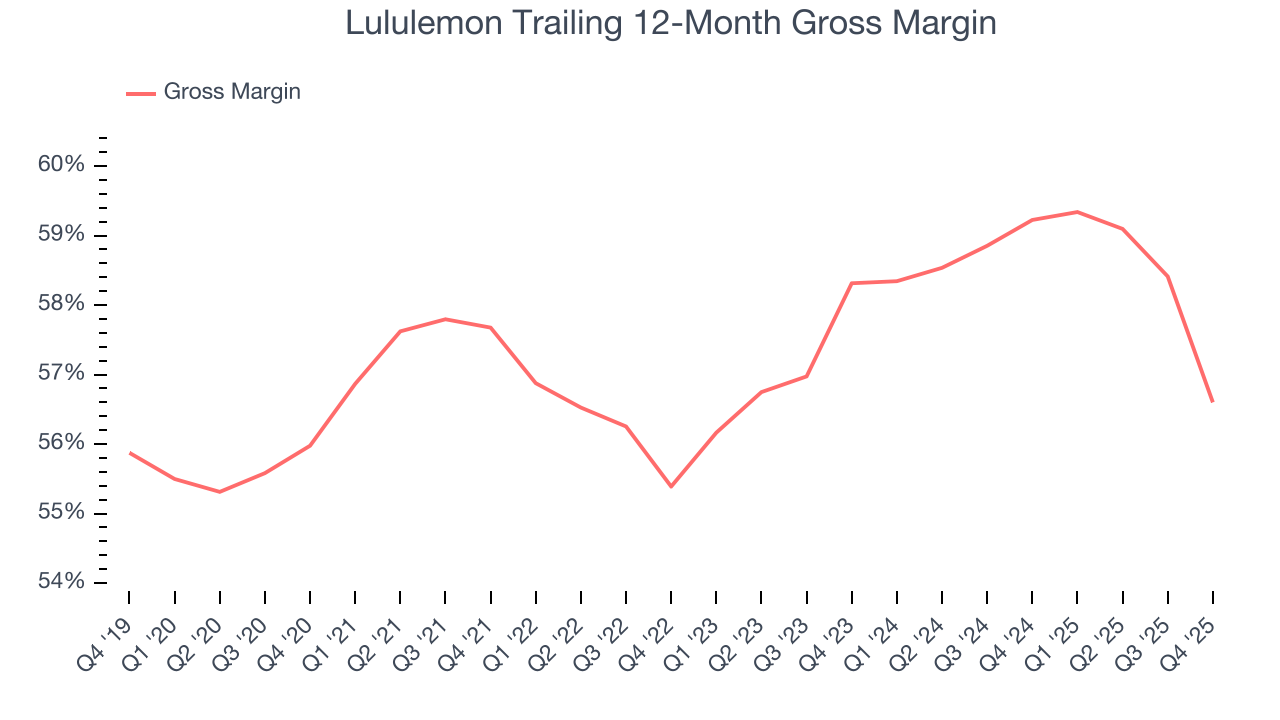
Lululemon produced a 54.9% gross profit margin in Q4 , marking a 5.5 percentage point decrease from 60.4% in the same quarter last year. Lululemon’s full-year margin has also been trending down over the past 12 months, decreasing by 2.6 percentage points. If this move continues, it could suggest a more competitive environment with some pressure to discount products and higher input costs (such as labor and freight expenses to transport goods).
8. Operating Margin
Lululemon has been a well-oiled machine over the last two years. It demonstrated elite profitability for a consumer retail business, boasting an average operating margin of 21.7%. This result isn’t surprising as its high gross margin gives it a favorable starting point.
Looking at the trend in its profitability, Lululemon’s operating margin decreased by 3.8 percentage points over the last year. This raises questions about the company’s expense base because its revenue growth should have given it leverage on its fixed costs, resulting in better economies of scale and profitability.
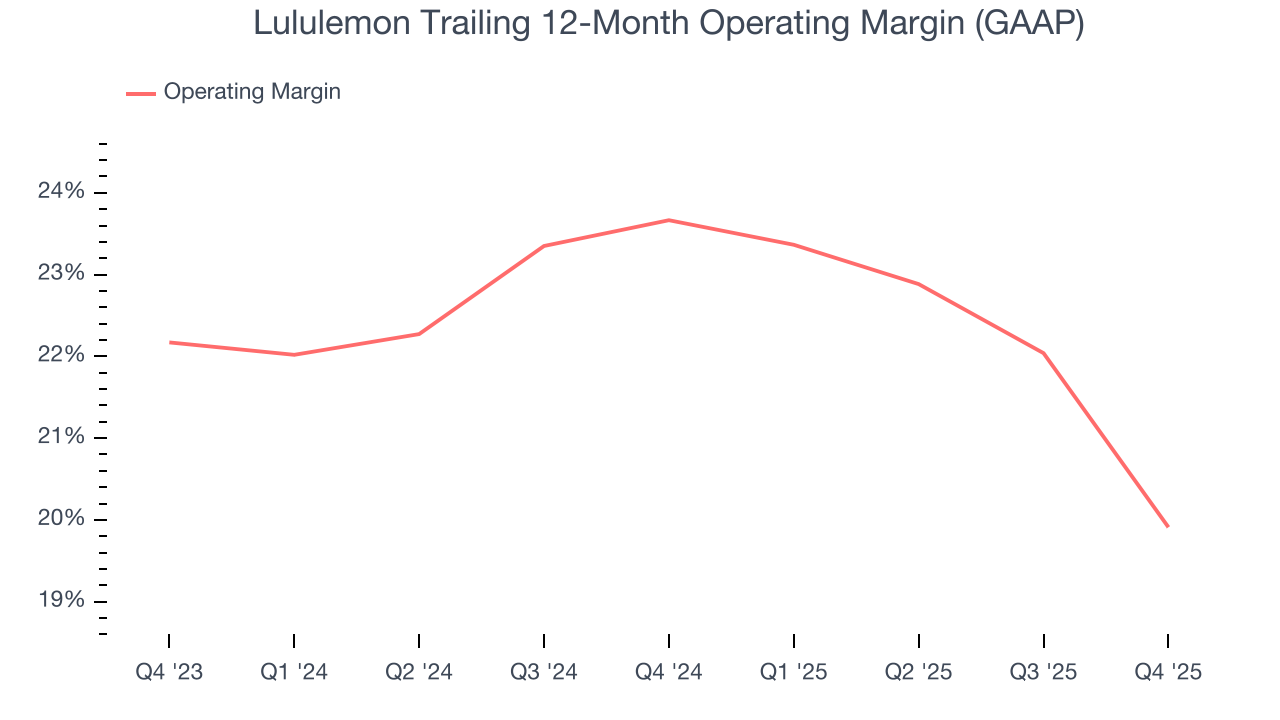
In Q4, Lululemon generated an operating margin profit margin of 22.3%, down 6.5 percentage points year on year. Since Lululemon’s operating margin decreased more than its gross margin, we can assume it was less efficient because expenses such as marketing, and administrative overhead increased.
9. Earnings Per Share
Revenue trends explain a company’s historical growth, but the long-term change in earnings per share (EPS) points to the profitability of that growth – for example, a company could inflate its sales through excessive spending on advertising and promotions.
Lululemon’s EPS grew at 25.8% compounded annual growth rate over the last three years, higher than its 11% annualized revenue growth. However, this alone doesn’t tell us much about its business quality because its operating margin didn’t improve.
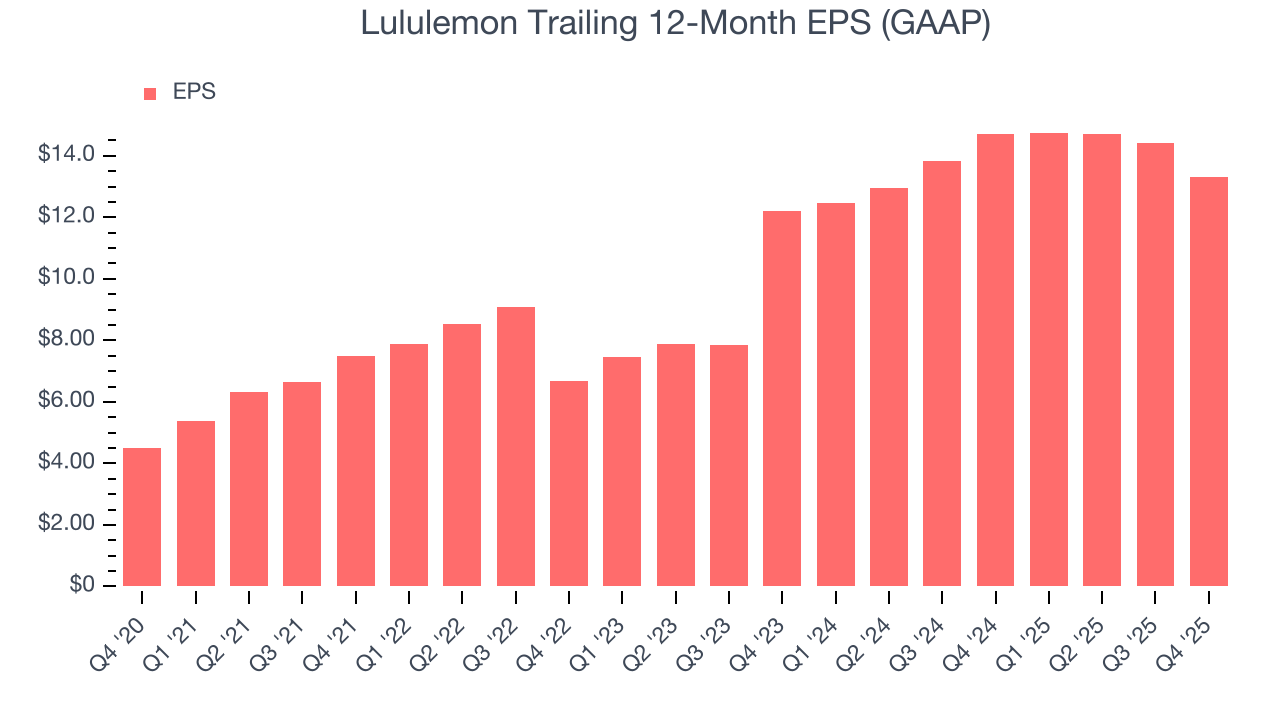
In Q4, Lululemon reported EPS of $5.01, down from $6.14 in the same quarter last year. Despite falling year on year, this print beat analysts’ estimates by 4.9%. Over the next 12 months, Wall Street expects Lululemon’s full-year EPS of $13.30 to shrink by 6.5%.
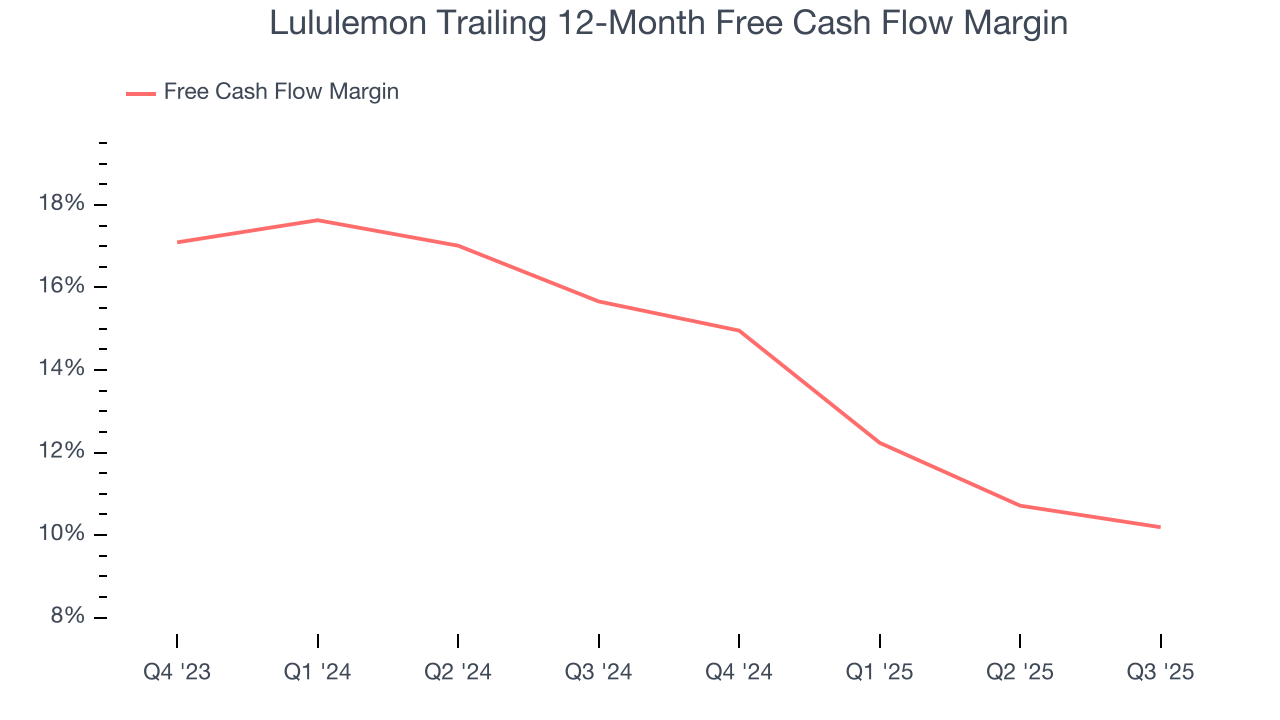
10. Cash Is King
Although earnings are undoubtedly valuable for assessing company performance, we believe cash is king because you can’t use accounting profits to pay the bills.
Lululemon has shown robust cash profitability, driven by its attractive business model that enables it to reinvest or return capital to investors. The company’s free cash flow margin averaged 8.6% over the last two years, quite impressive for a consumer retail business.
11. Return on Invested Capital (ROIC)
EPS and free cash flow tell us whether a company was profitable while growing its revenue. But was it capital-efficient? A company’s ROIC explains this by showing how much operating profit it makes compared to the money it has raised (debt and equity).
Lululemon’s five-year average ROIC was 46.8%, placing it among the best consumer retail companies. This illustrates its management team’s ability to invest in highly profitable ventures and produce tangible results for shareholders.
12. Balance Sheet Assessment
Businesses that maintain a cash surplus face reduced bankruptcy risk.
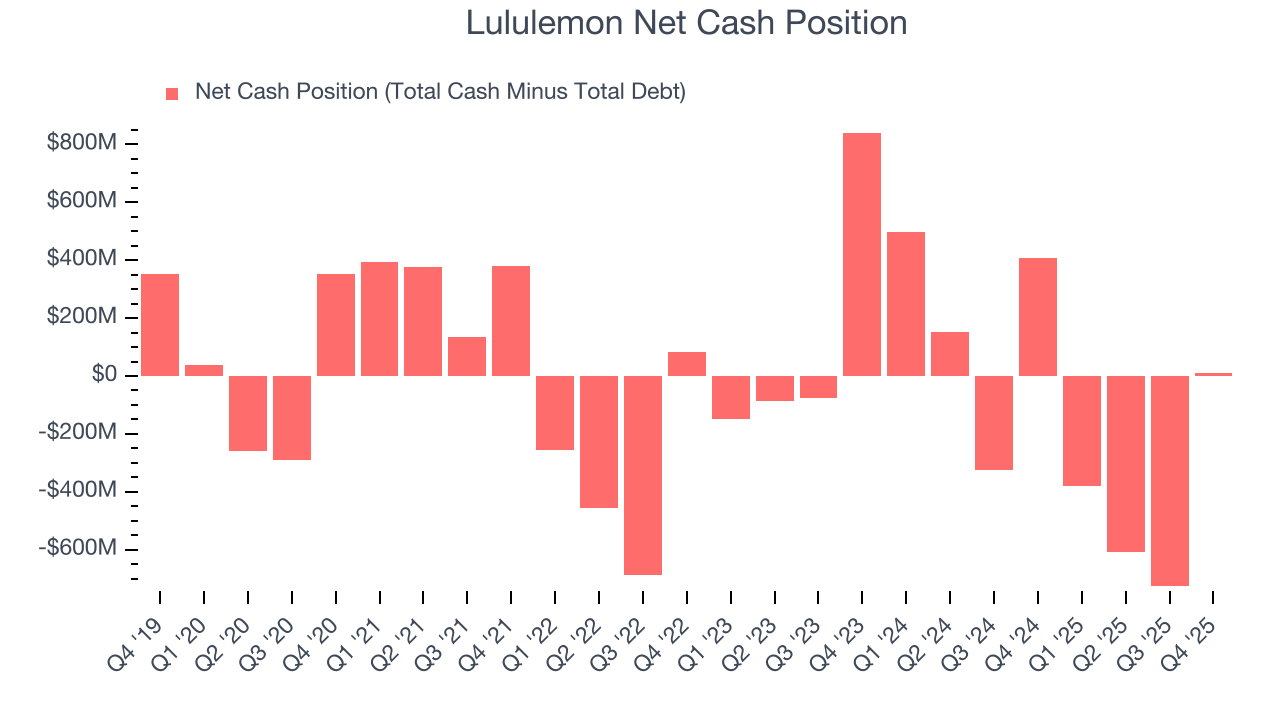
Lululemon is a profitable, well-capitalized company with $1.81 billion of cash and $1.80 billion of debt on its balance sheet. This $8.76 million net cash position gives it the freedom to borrow money, return capital to shareholders, or invest in growth initiatives. Leverage is not an issue here.
13. Key Takeaways from Lululemon’s Q4 Results
It was encouraging to see Lululemon beat analysts’ revenue expectations this quarter. We were also glad its EPS outperformed Wall Street’s estimates. On the other hand, its EPS guidance for next quarter missed and its full-year EPS guidance fell short of Wall Street’s estimates. Overall, this quarter could have been better. The stock traded down 2.1% to $156.79 immediately after reporting.
14. Is Now The Time To Buy Lululemon?
Updated: March 17, 2026 at 10:58 PM EDT
We think that the latest earnings result is only one piece of the bigger puzzle. If you’re deciding whether to own Lululemon, you should also grasp the company’s longer-term business quality and valuation.
There are several reasons why we think Lululemon is a great business. First of all, the company’s revenue growth was decent over the last three years. On top of that, its new store openings have increased its brand equity, and its admirable gross margins are a wonderful starting point for the overall profitability of the business.
Lululemon’s P/E ratio based on the next 12 months is 12.9x. Looking at the consumer retail landscape today, Lululemon’s fundamentals really stand out, and we like it at this price.
Wall Street analysts have a consensus one-year price target of $204.63 on the company (compared to the current share price of $156.68), implying they see 30.6% upside in buying Lululemon in the short term.