
Lululemon (LULU)
We like Lululemon. It repeatedly invests in lucrative growth initiatives, generating robust cash flows and returns on capital.― StockStory Analyst Team
1. News


2. Summary
Why We Like Lululemon
Originally serving yogis and hockey players, Lululemon (NASDAQ:LULU) is a designer, distributor, and retailer of athletic apparel for men and women.
- Fast expansion of new stores to reach markets with few or no locations is justified by its same-store sales growth
- Differentiated product assortment is reflected in its best-in-class gross margin of 58.6%
- Excellent operating margin highlights the strength of its business model


Lululemon is a standout company. The valuation seems fair based on its quality, so this could be an opportune time to invest in some shares.
Why Is Now The Time To Buy Lululemon?


Lululemon is trading at $177.10 per share, or 14.5x forward P/E. This valuation is fair - even cheap depending on how much you like the story - for the quality you get.
Our analysis and backtests show high-quality businesses routinely outperform the market over a multi-year period, especially when priced like this.
3. Lululemon (LULU) Research Report: Q3 CY2025 Update
Athletic apparel retailer Lululemon (NASDAQ:LULU) announced better-than-expected revenue in Q3 CY2025, with sales up 7.1% year on year to $2.57 billion. On the other hand, next quarter’s revenue guidance of $3.54 billion was less impressive, coming in 0.7% below analysts’ estimates. Its GAAP profit of $2.59 per share was 17.1% above analysts’ consensus estimates.
Lululemon (LULU) Q3 CY2025 Highlights:
- CEO Calvin McDonald will depart in January
- Revenue: $2.57 billion vs analyst estimates of $2.48 billion (7.1% year-on-year growth, 3.7% beat)
- EPS (GAAP): $2.59 vs analyst estimates of $2.21 (17.1% beat)
- Revenue Guidance for Q4 CY2025 is $3.54 billion at the midpoint, below analyst estimates of $3.57 billion
- EPS (GAAP) guidance for the full year is $12.97 at the midpoint, roughly in line with what analysts were expecting
- Operating Margin: 17%, down from 20.5% in the same quarter last year
- Locations: 796 at quarter end, up from 749 in the same quarter last year
- Same-Store Sales rose 1% year on year (4% in the same quarter last year)
- Market Capitalization: $22.25 billion
Company Overview
Originally serving yogis and hockey players, Lululemon (NASDAQ:LULU) is a designer, distributor, and retailer of athletic apparel for men and women.
Lululemon was founded in 1998 to provide stylish athletic wear that supports an active and healthy lifestyle. The brand emerged from the growing demand for functional yet fashionable fitness apparel, starting with yoga wear and expanding to a wide range of athletic and leisure clothing.
The company's offerings encompass athletic wear, including yoga pants, running gear, workout accessories, and lifestyle apparel. It addresses the gap in the market for premium, well-crafted athletic apparel that can transition seamlessly from the gym to daily life - you might have heard the term 'Athleisure', which Lululemon pioneered. The brand has cultivated a loyal customer base through its products, customer support (such as free alterations), and community events.
Lululemon's revenue stems from product sales in its company-owned stores and direct-to-consumer channels. E-commerce makes up a large chunk of its revenue, and customers are encouraged to download its mobile app to track purchases and create support tickets for alterations. It also generates sales through certain wholesale accounts, licenses and supply arrangements, gently-used products through its "Like New" program, and connected hardware and associated subscriptions through Lululemon Studio.
4. Apparel Retailer
Apparel sales are not driven so much by personal needs but by seasons, trends, and innovation, and over the last few decades, the category has shifted meaningfully online. Retailers that once only had brick-and-mortar stores are responding with omnichannel presences. The online shopping experience continues to improve and retail foot traffic in places like shopping malls continues to stall, so the evolution of clothing sellers marches on.
Competitors in the athletic apparel industry include Nike (NYSE:NKE), Under Armour (NYSE:UA), and Columbia Sportswear (NASDAQ:COLM).
5. Revenue Growth
Reviewing a company’s long-term sales performance reveals insights into its quality. Any business can put up a good quarter or two, but the best consistently grow over the long haul.
With $11.07 billion in revenue over the past 12 months, Lululemon is a mid-sized retailer, which sometimes brings disadvantages compared to larger competitors benefiting from better economies of scale. On the bright side, it can still flex high growth rates because it’s working from a smaller revenue base.
As you can see below, Lululemon’s sales grew at a solid 14% compounded annual growth rate over the last three years (we compare to 2019 to normalize for COVID-19 impacts) as it opened new stores and increased sales at existing, established locations.
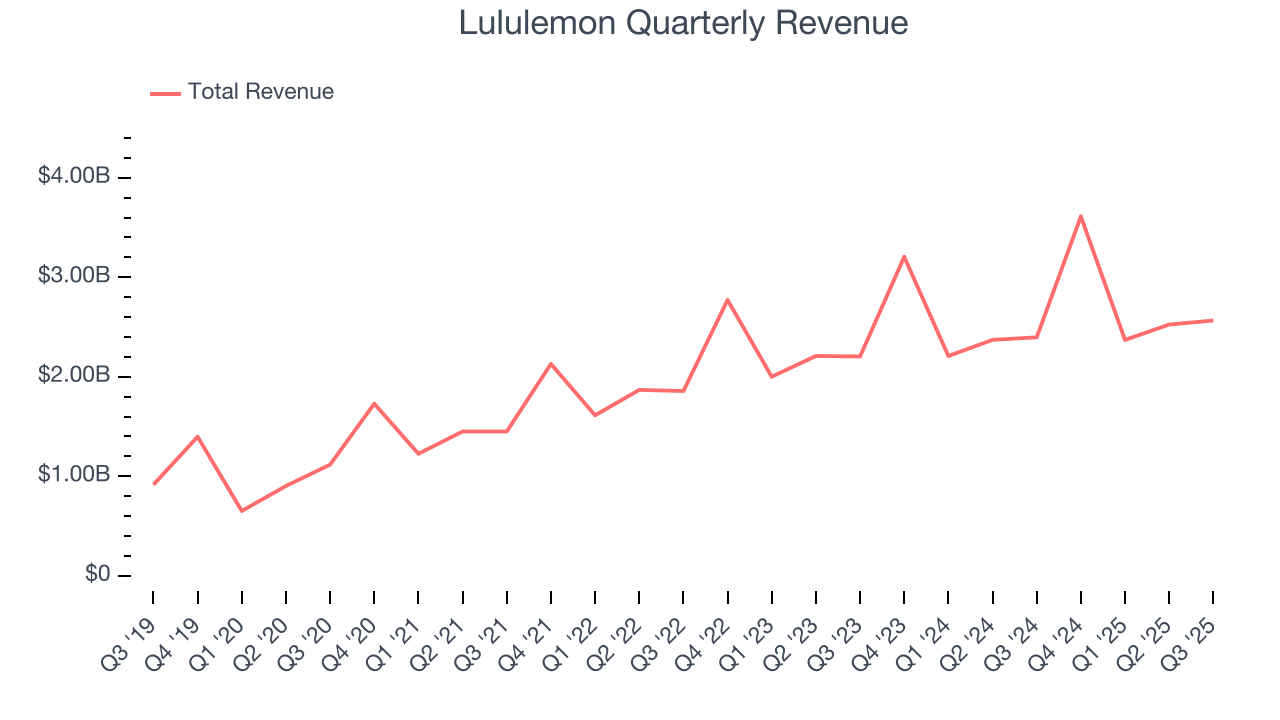
This quarter, Lululemon reported year-on-year revenue growth of 7.1%, and its $2.57 billion of revenue exceeded Wall Street’s estimates by 3.7%. Company management is currently guiding for a 1.9% year-on-year decline in sales next quarter.
Looking further ahead, sell-side analysts expect revenue to grow 1.4% over the next 12 months, a deceleration versus the last three years. This projection doesn't excite us and indicates its products will face some demand challenges. At least the company is tracking well in other measures of financial health.
6. Store Performance
Number of Stores
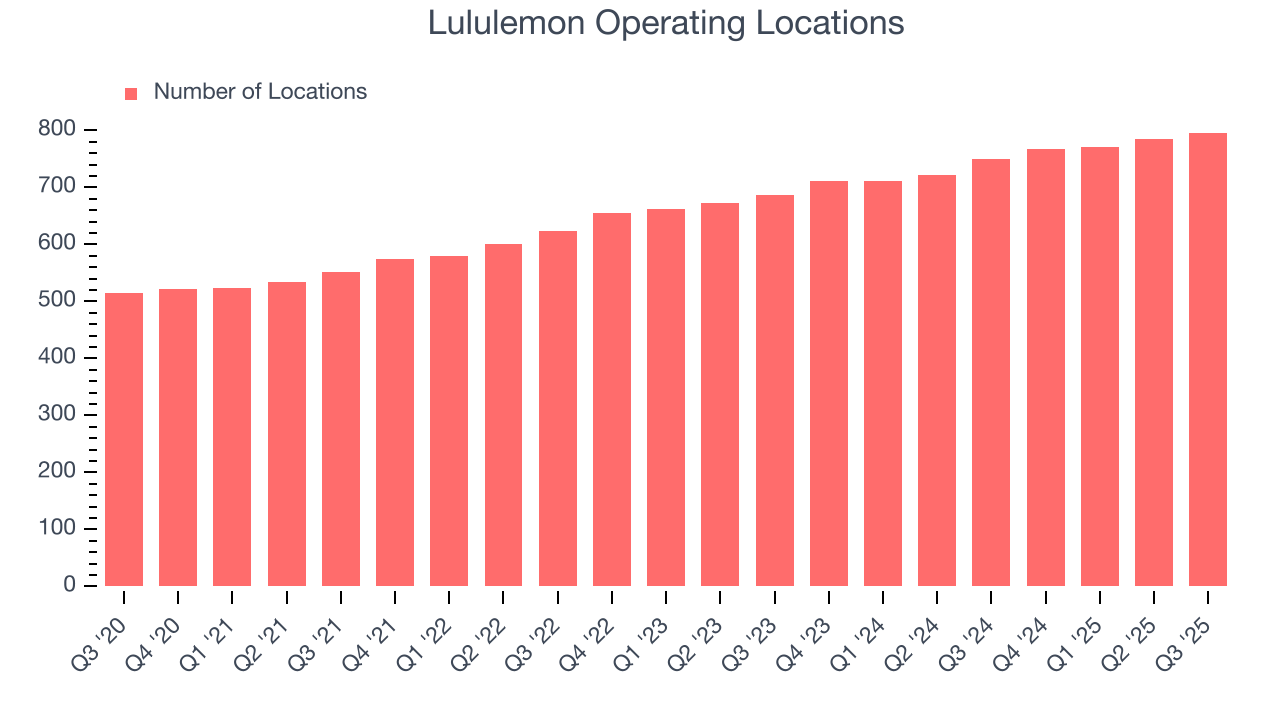
A retailer’s store count often determines how much revenue it can generate.
Lululemon operated 796 locations in the latest quarter. It has opened new stores at a rapid clip over the last two years, averaging 8% annual growth, much faster than the broader consumer retail sector. This gives it a chance to become a large, scaled business over time.
When a retailer opens new stores, it usually means it’s investing for growth because demand is greater than supply, especially in areas where consumers may not have a store within reasonable driving distance.
Same-Store Sales
A company's store base only paints one part of the picture. When demand is high, it makes sense to open more. But when demand is low, it’s prudent to close some locations and use the money in other ways. Same-store sales gives us insight into this topic because it measures organic growth for a retailer's e-commerce platform and brick-and-mortar shops that have existed for at least a year.
Lululemon’s demand has been spectacular for a retailer over the last two years. On average, the company has increased its same-store sales by an impressive 3.8% per year. This performance suggests its rollout of new stores is beneficial for shareholders. We like this backdrop because it gives Lululemon multiple ways to win: revenue growth can come from new stores, e-commerce, or increased foot traffic and higher sales per customer at existing locations.
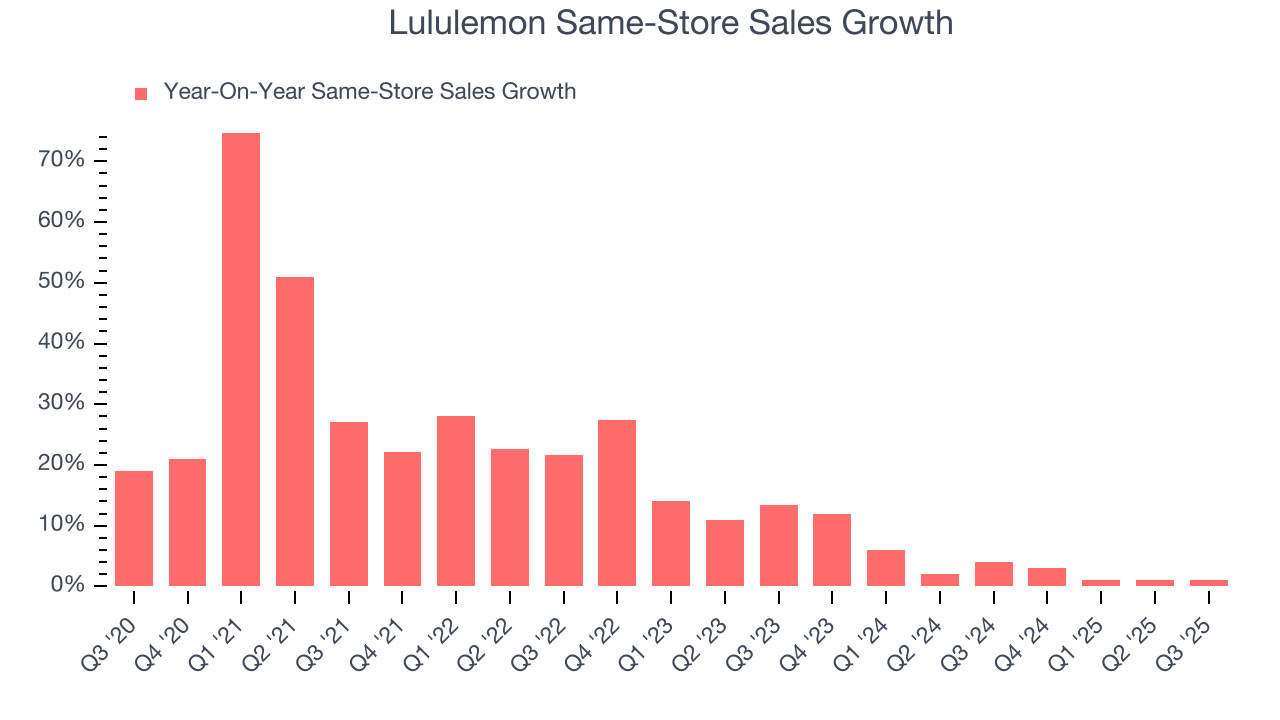
In the latest quarter, Lululemon’s same-store sales rose 1% year on year. This was a meaningful deceleration from its historical levels. We’ll be watching closely to see if Lululemon can reaccelerate growth.
7. Gross Margin & Pricing Power
At StockStory, we prefer high gross margin businesses because they indicate pricing power or differentiated products, giving the company a chance to generate higher operating profits.
Lululemon has best-in-class unit economics for a retailer, enabling it to invest in areas such as marketing and talent. As you can see below, it averaged an elite 58.6% gross margin over the last two years. That means Lululemon only paid its suppliers $41.38 for every $100 in revenue. 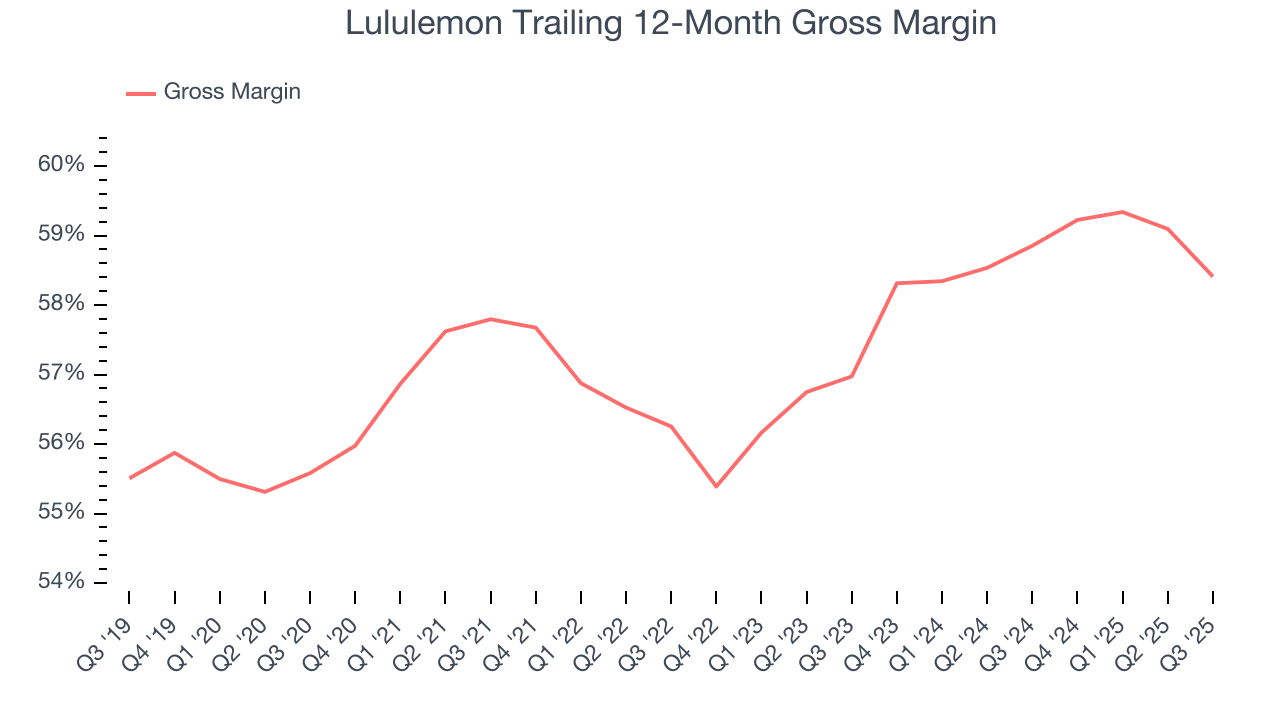
In Q3, Lululemon produced a 55.6% gross profit margin, down 2.9 percentage points year on year. On a wider time horizon, the company’s full-year margin has remained steady over the past four quarters, suggesting it strives to keep prices low for customers and has stable input costs (such as labor and freight expenses to transport goods).
8. Operating Margin
Operating margin is a key profitability metric because it accounts for all expenses necessary to run a store, including wages, inventory, rent, advertising, and other administrative costs.
Lululemon has been a well-oiled machine over the last two years. It demonstrated elite profitability for a consumer retail business, boasting an average operating margin of 22.7%. This result isn’t surprising as its high gross margin gives it a favorable starting point.
Looking at the trend in its profitability, Lululemon’s operating margin decreased by 1.3 percentage points over the last year. This raises questions about the company’s expense base because its revenue growth should have given it leverage on its fixed costs, resulting in better economies of scale and profitability.
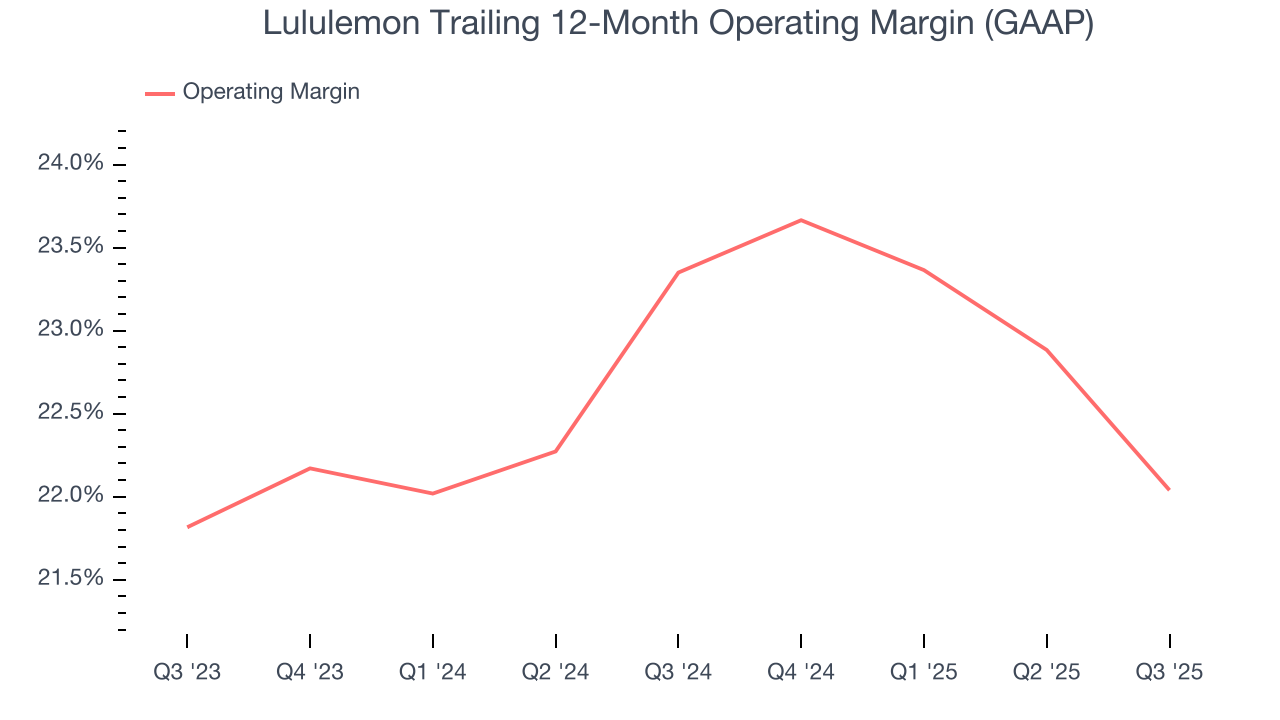
In Q3, Lululemon generated an operating margin profit margin of 17%, down 3.5 percentage points year on year. Since Lululemon’s operating margin decreased more than its gross margin, we can assume it was less efficient because expenses such as marketing, and administrative overhead increased.
9. Earnings Per Share
Revenue trends explain a company’s historical growth, but the long-term change in earnings per share (EPS) points to the profitability of that growth – for example, a company could inflate its sales through excessive spending on advertising and promotions.
Lululemon’s EPS grew at a decent 16.6% compounded annual growth rate over the last three years, higher than its 14% annualized revenue growth. However, this alone doesn’t tell us much about its business quality because its operating margin didn’t improve.
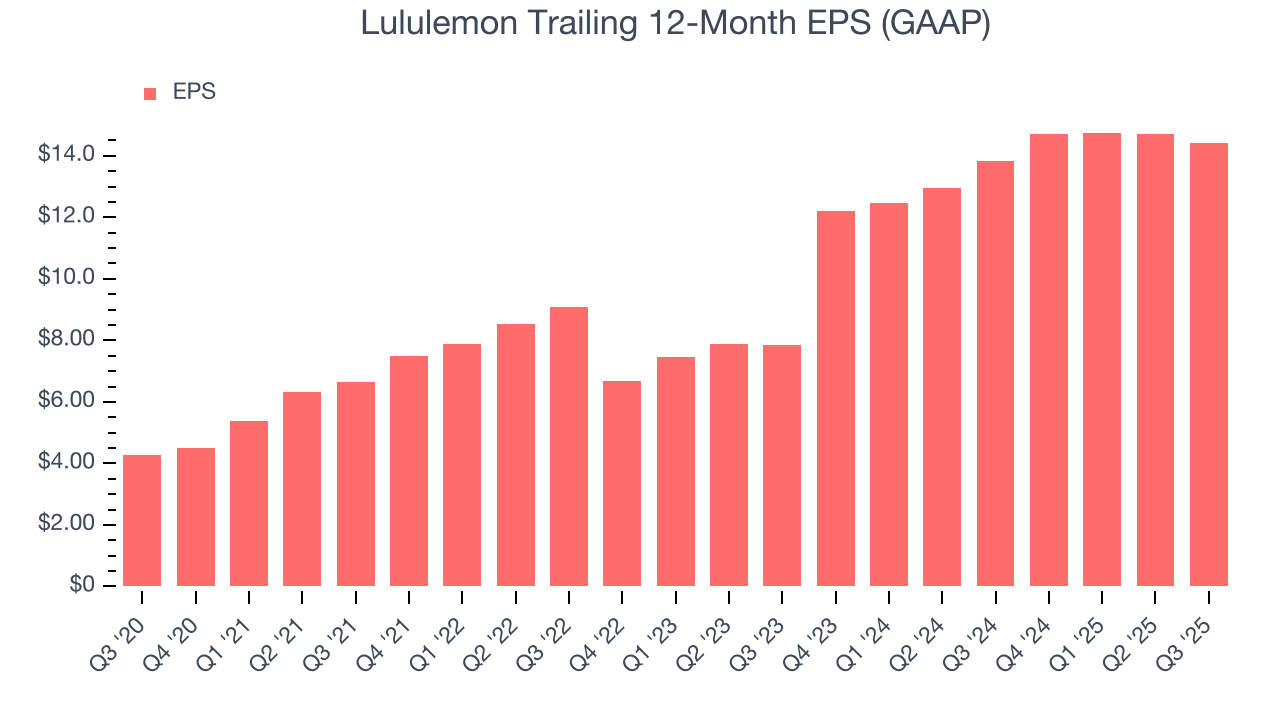
In Q3, Lululemon reported EPS of $2.59, down from $2.87 in the same quarter last year. Despite falling year on year, this print easily cleared analysts’ estimates. Over the next 12 months, Wall Street expects Lululemon’s full-year EPS of $14.43 to shrink by 15.5%.
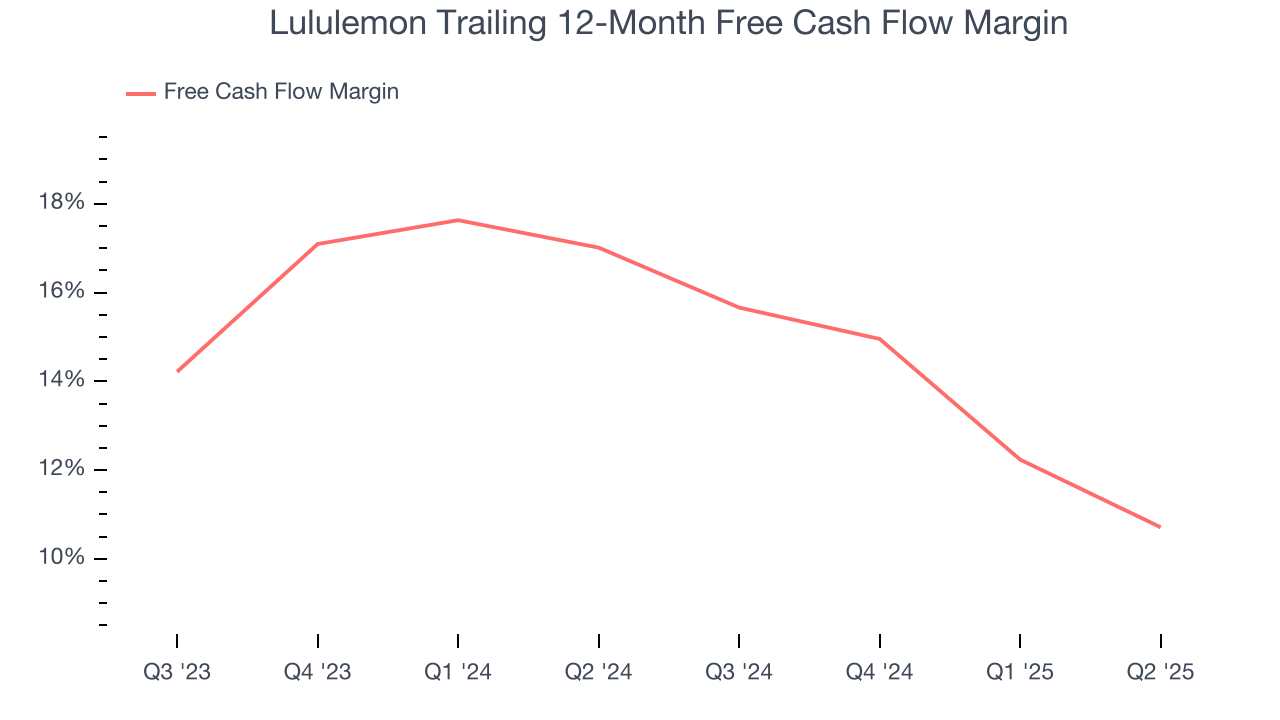
10. Cash Is King
Although earnings are undoubtedly valuable for assessing company performance, we believe cash is king because you can’t use accounting profits to pay the bills.
Lululemon has shown terrific cash profitability, driven by its lucrative business model that enables it to reinvest, return capital to investors, and stay ahead of the competition. The company’s free cash flow margin was among the best in the consumer retail sector, averaging 14.1% over the last two years.
11. Return on Invested Capital (ROIC)
EPS and free cash flow tell us whether a company was profitable while growing its revenue. But was it capital-efficient? Enter ROIC, a metric showing how much operating profit a company generates relative to the money it has raised (debt and equity).
Lululemon’s five-year average ROIC was 46.4%, placing it among the best consumer retail companies. This illustrates its management team’s ability to invest in highly profitable ventures and produce tangible results for shareholders.
12. Balance Sheet Assessment
Lululemon reported $1.04 billion of cash and $1.76 billion of debt on its balance sheet in the most recent quarter. As investors in high-quality companies, we primarily focus on two things: 1) that a company’s debt level isn’t too high and 2) that its interest payments are not excessively burdening the business.
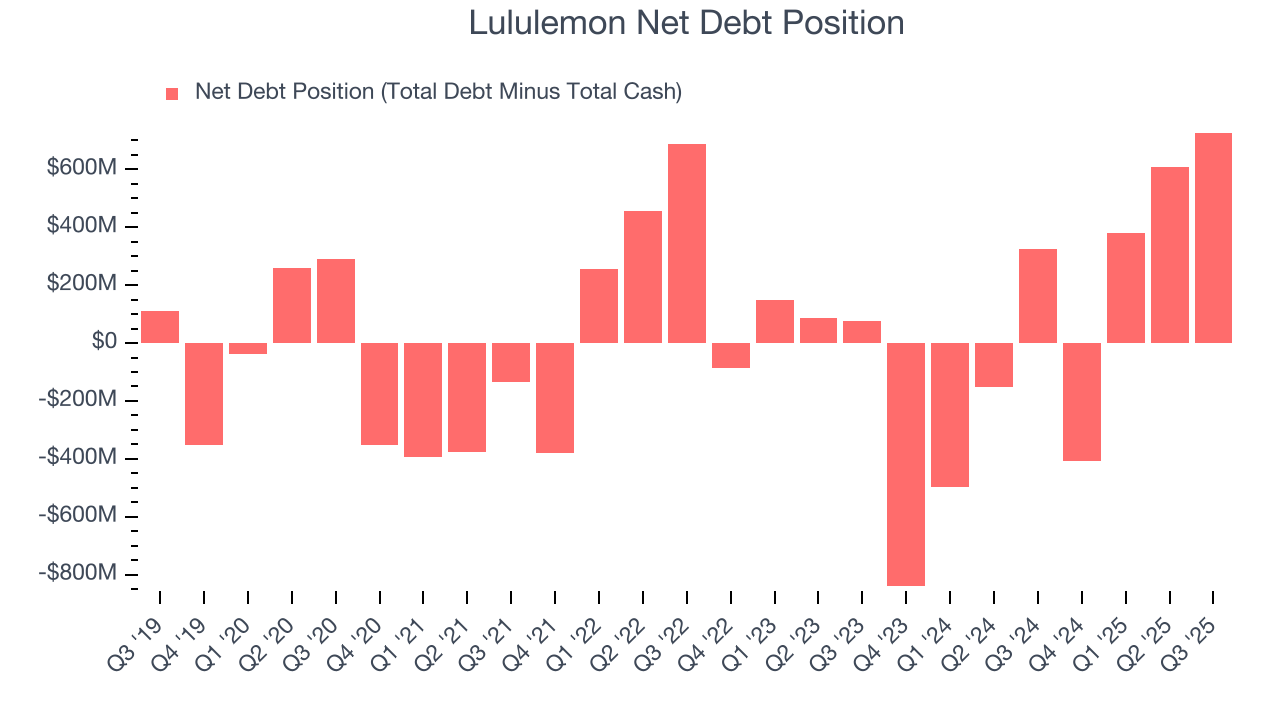
With $2.94 billion of EBITDA over the last 12 months, we view Lululemon’s 0.2× net-debt-to-EBITDA ratio as safe. The company’s profits give it plenty of breathing room, allowing it to continue investing in growth initiatives.
13. Key Takeaways from Lululemon’s Q3 Results
We enjoyed seeing Lululemon beat analysts’ revenue expectations this quarter. We were also glad its EPS outperformed Wall Street’s estimates. On the other hand, its EPS guidance for next quarter missed. The company also announced that CEO Calvin McDonald will depart in January, and after a year of lackluster performance, the market seems to be cheering this move. Overall, this print was mixed with a potential new CEO breathing some life into shares. The stock traded up 10.4% to $207.01 immediately following the results.
14. Is Now The Time To Buy Lululemon?
Updated: February 17, 2026 at 9:10 PM EST
Are you wondering whether to buy Lululemon or pass? We urge investors to not only consider the latest earnings results but also longer-term business quality and valuation as well.
Lululemon is an amazing business ranking highly on our list. First of all, the company’s revenue growth was good over the last three years. And while its projected EPS for the next year is lacking, its new store openings have increased its brand equity. Additionally, Lululemon’s admirable gross margins are a wonderful starting point for the overall profitability of the business.
Lululemon’s P/E ratio based on the next 12 months is 14.5x. Looking at the consumer retail landscape today, Lululemon’s fundamentals really stand out, and we like it at this price.
Wall Street analysts have a consensus one-year price target of $209.12 on the company (compared to the current share price of $177.10), implying they see 18.1% upside in buying Lululemon in the short term.