Lyft (LYFT)
We admire Lyft. It not only produces heaps of cash but also has improved its profitability, showing its quality is rising.― StockStory Analyst Team
1. News


2. Summary
Why We Like Lyft
Founded by Logan Green and John Zimmer as a long-distance intercity carpooling company Zimride, Lyft (NASDAQ: LYFT) operates a ridesharing network in the US and Canada.
- Additional sales over the last three years increased its profitability as the 64.1% annual growth in its earnings per share outpaced its revenue
- Growing active riders over the last two years create opportunities to boost monetization through new features and premium offerings
- Platform’s growing usage and its ability to increase user spending by 7.7% annually showcases its high switching costs


We see a bright future for Lyft. The price seems fair based on its quality, so this could be an opportune time to buy some shares.
Why Is Now The Time To Buy Lyft?


Lyft is trading at $13.49 per share, or 7.1x forward EV/EBITDA. The stock’s multiple sure seems like a bargain relative to its business quality and fundamentals.
We jump for joy when high-quality companies trade at bargain prices because shareholders can benefit from both earnings growth and a positive re-rating - a powerful one-two punch.
3. Lyft (LYFT) Research Report: Q4 CY2025 Update
Ride sharing service Lyft (NASDAQ: LYFT) fell short of the market’s revenue expectations in Q4 CY2025 as sales rose 2.7% year on year to $1.59 billion. Its GAAP profit of $6.59 per share was significantly above analysts’ consensus estimates.
Lyft (LYFT) Q4 CY2025 Highlights:
- Revenue: $1.59 billion vs analyst estimates of $1.75 billion (2.7% year-on-year growth, 9.1% miss)
- EPS (GAAP): $6.59 vs analyst estimates of $0.12 (significant beat)
- Adjusted EBITDA: $154.1 million vs analyst estimates of $147.5 million (9.7% margin, 4.5% beat)
- EBITDA guidance for Q1 CY2026 is $130 million at the midpoint, below analyst estimates of $139.9 million
- Operating Margin: -11.6%, down from 1.8% in the same quarter last year
- Free Cash Flow Margin: 14.3%, down from 16.5% in the previous quarter
- Active Riders: 29.2 million, up 4.5 million year on year
- Market Capitalization: $6.73 billion
Company Overview
Founded by Logan Green and John Zimmer as a long-distance intercity carpooling company Zimride, Lyft (NASDAQ: LYFT) operates a ridesharing network in the US and Canada.
Uber created the first ride hailing app, allowing users to summon black limousines via their mobile devices, an innovation that disrupted modern transportation. Lyft followed and expanded the service to the mass market, positioning it as a casual, friendly carpool experience that aimed to appeal to younger generations. Initially, Lyft’s drivers had a pink mustache affixed to the grill of their car, which has since been replaced by an “Amp” device, which lights up the car’s dashboard to help riders easily find their car.
The company’s value propositions are multiple. For individuals, Lyft effectively lowered the cost per mile for taxi transportation vs. legacy cabs, while providing ease of use and convenience. For drivers, it has provided flexible earning opportunities.
4. Gig Economy
The iPhone changed the world, ushering in the era of the “always-on” internet and “on-demand” services - anything someone could want is just a few taps away. Likewise, the gig economy sprang up in a similar fashion, with a proliferation of tech-enabled freelance labor marketplaces, which work hand and hand with many on demand services. Individuals can now work on demand too. What began with tech-enabled platforms that aggregated riders and drivers has expanded over the past decade to include food delivery, groceries, and now even a plumber or graphic designer are all just a few taps away.
Lyft’s (NASDAQ: LYFT) main competitor in ride hailing is Uber (NYSE:UBER).
5. Revenue Growth
A company’s long-term sales performance can indicate its overall quality. Any business can put up a good quarter or two, but the best consistently grow over the long haul. Thankfully, Lyft’s 15.5% annualized revenue growth over the last three years was solid. Its growth beat the average consumer internet company and shows its offerings resonate with customers, a helpful starting point for our analysis.
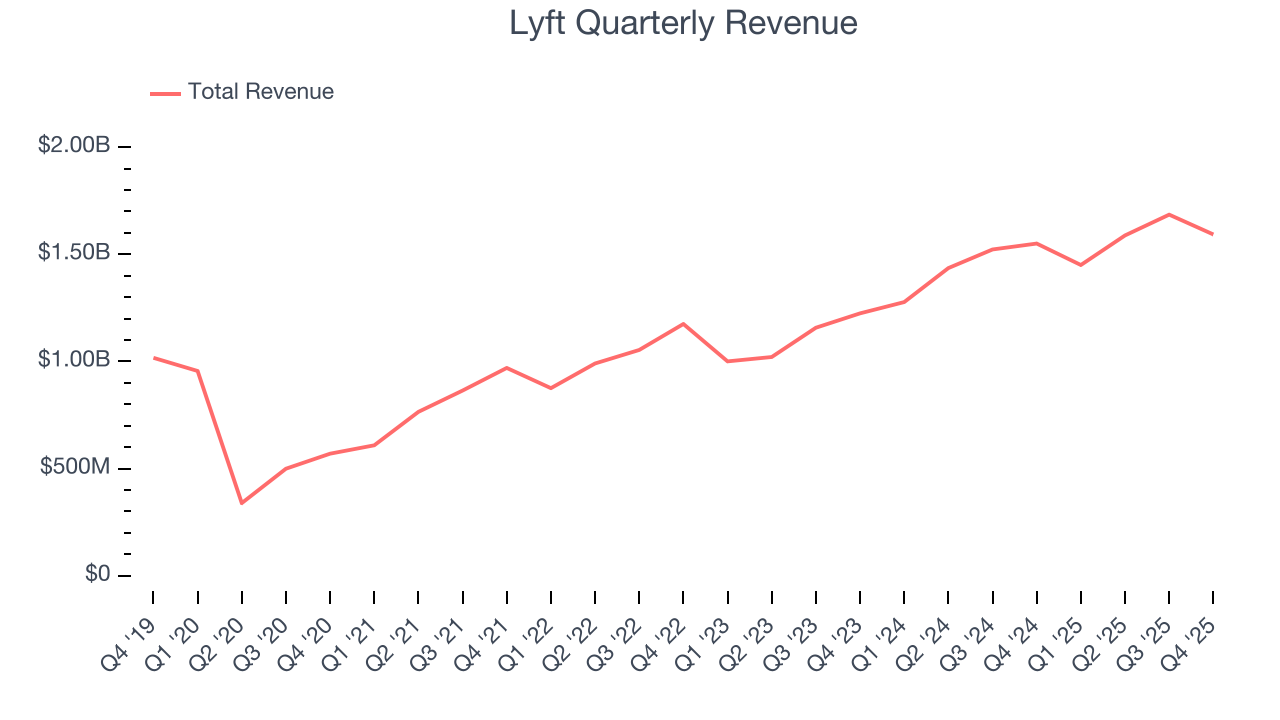
This quarter, Lyft’s revenue grew by 2.7% year on year to $1.59 billion, falling short of Wall Street’s estimates.
Looking ahead, sell-side analysts expect revenue to grow 16.8% over the next 12 months, similar to its three-year rate. This projection is commendable and indicates its newer products and services will fuel better top-line performance.
6. Active Riders
User Growth
As a gig economy marketplace, Lyft generates revenue growth by expanding the number of services on its platform (e.g. rides, deliveries, freelance jobs) and raising the commission fee from each service provided.
Over the last two years, Lyft’s active riders, a key performance metric for the company, increased by 12.2% annually to 29.2 million in the latest quarter. This growth rate is strong for a consumer internet business and indicates people love using its offerings. 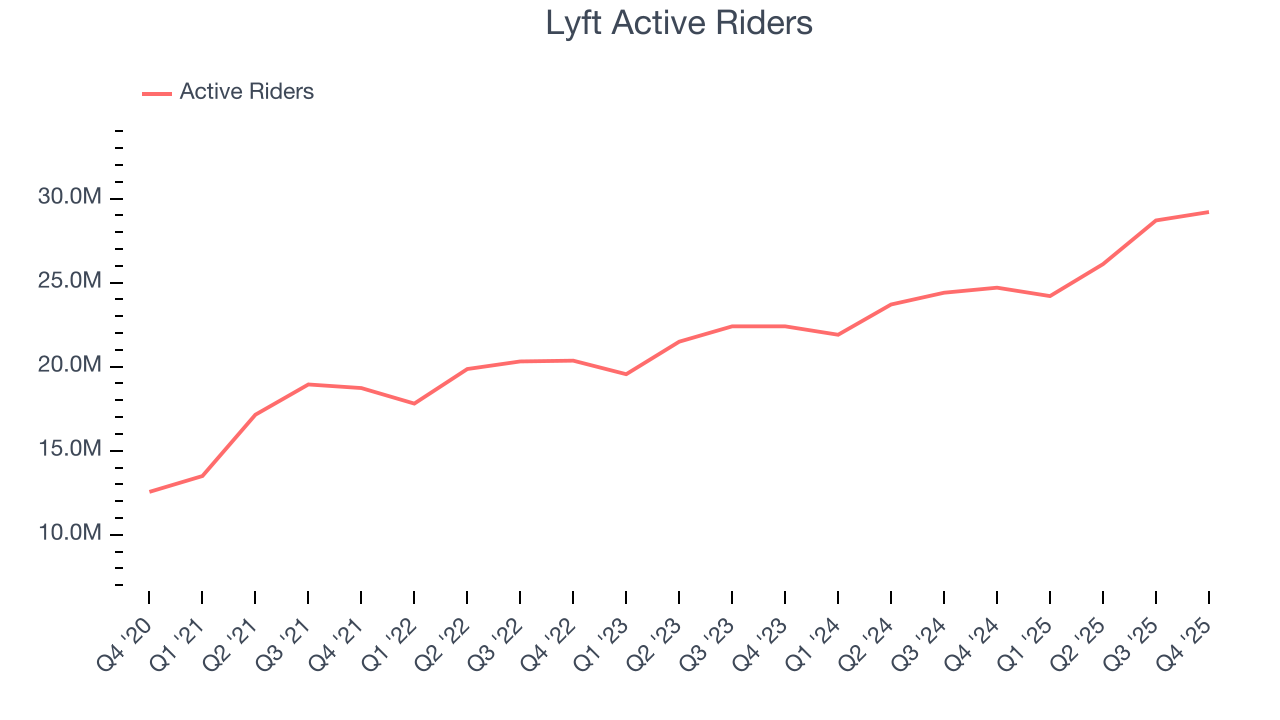
In Q4, Lyft added 4.5 million active riders, leading to 18.2% year-on-year growth. The quarterly print was higher than its two-year result, suggesting its new initiatives are accelerating user growth.
Revenue Per User
Average revenue per user (ARPU) is a critical metric to track because it measures how much the company earns in transaction fees from each user. This number also informs us about Lyft’s take rate, which represents its pricing leverage over the ecosystem, or "cut" from each transaction.
Lyft’s ARPU growth has been impressive over the last two years, averaging 7.7%. Its ability to increase monetization while quickly growing its active riders reflects the strength of its platform, as its users continue to spend more each year. 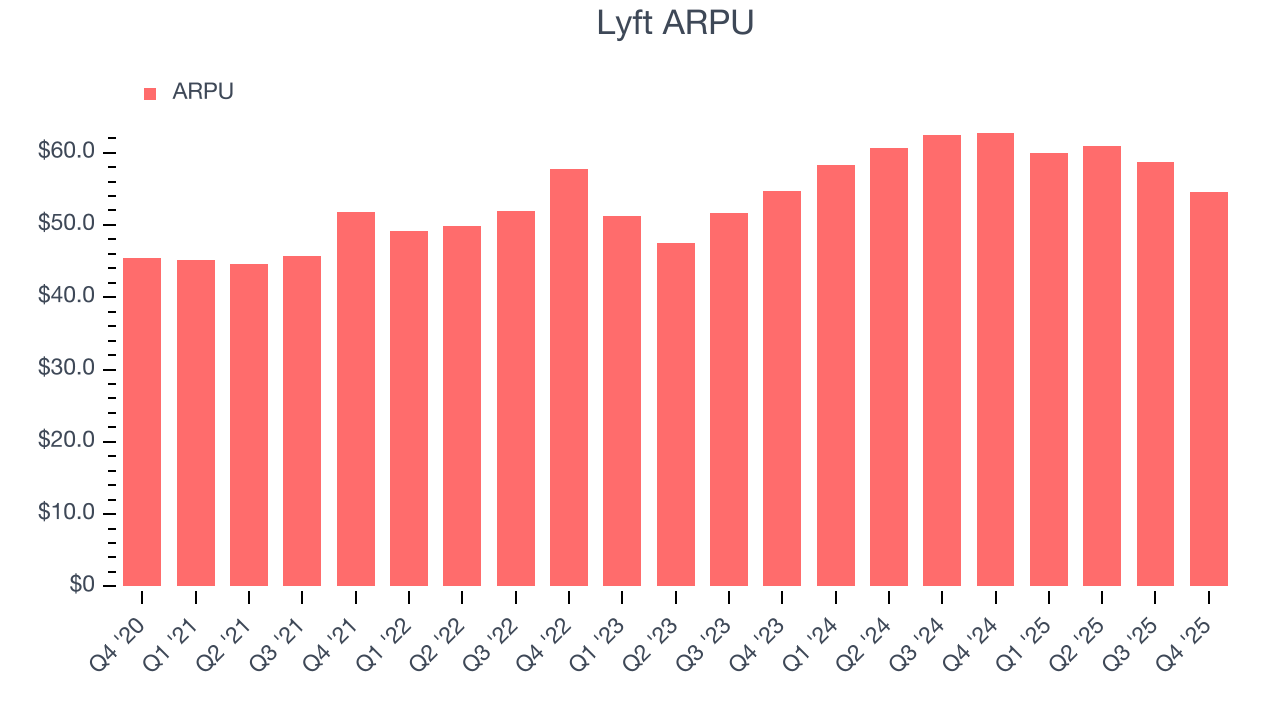
This quarter, Lyft’s ARPU clocked in at $54.54. It declined 13.1% year on year, worse than the change in its active riders.
7. Gross Margin & Pricing Power
For gig economy businesses like Lyft, gross profit tells us how much money the company gets to keep after covering the base cost of its products and services, which typically include server hosting, customer support, and payment processing fees. Another cost of revenue could also be insurance to protect against liabilities arising from providing transportation, housing, or freelance work services.
Lyft’s unit economics are far below other consumer internet companies, signaling it operates in a competitive market and must pay many third parties a slice of its sales to distribute its products and services. As you can see below, it averaged a 35% gross margin over the last two years. Said differently, Lyft had to pay a chunky $64.96 to its service providers for every $100 in revenue. 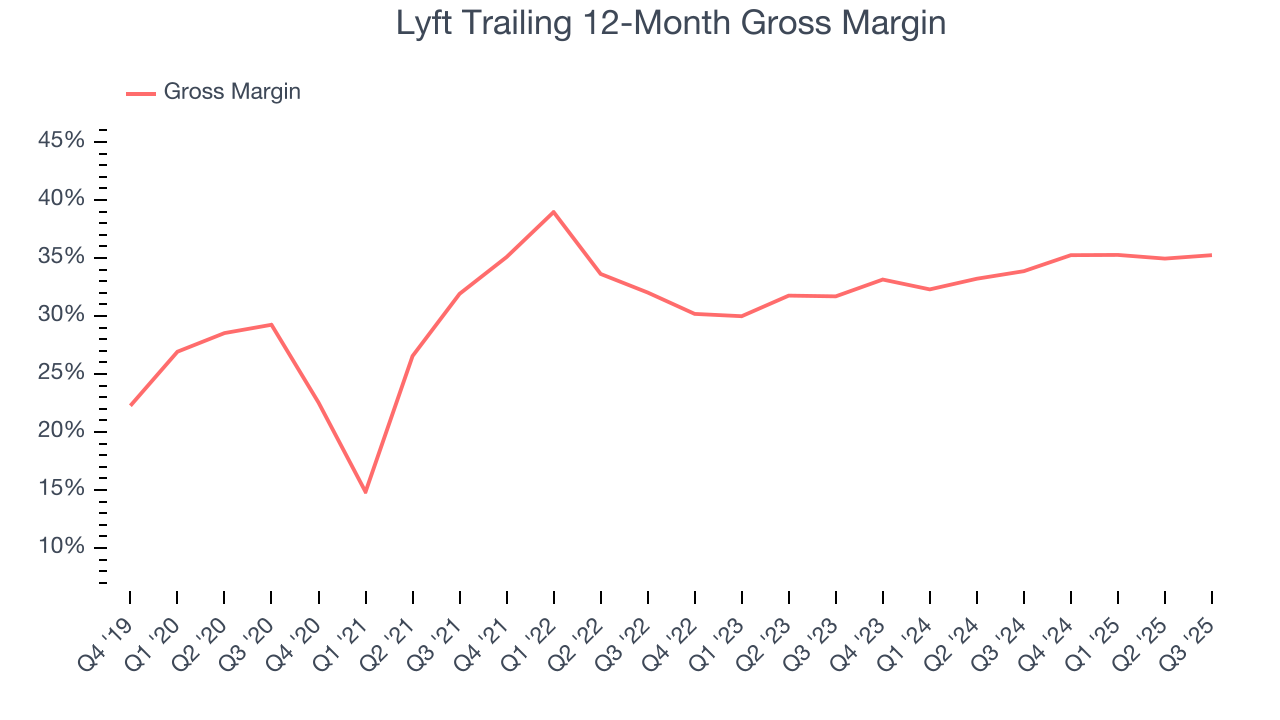
8. User Acquisition Efficiency
Unlike enterprise software that’s typically sold by dedicated sales teams, consumer internet businesses like Lyft grow from a combination of product virality, paid advertisement, and incentives.
Lyft is efficient at acquiring new users, spending 37.5% of its gross profit on sales and marketing expenses over the last year. This efficiency indicates relatively solid competitive positioning, giving Lyft the freedom to invest its resources into new growth initiatives. 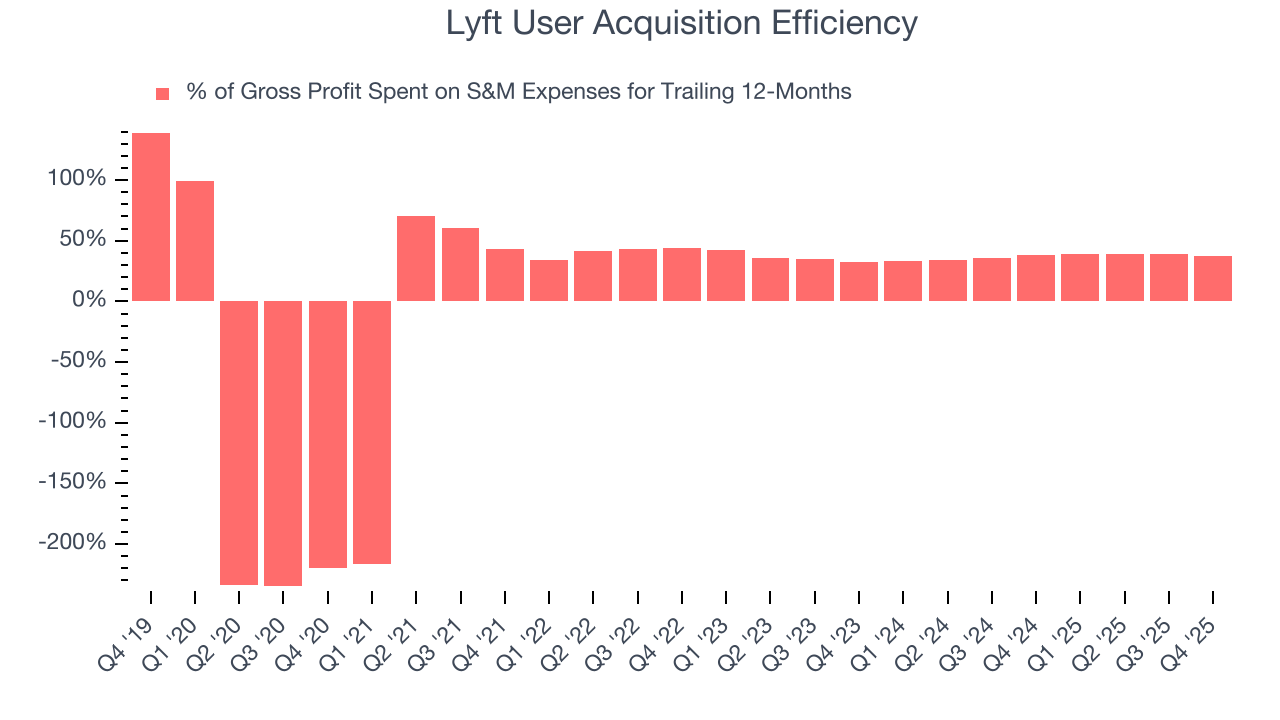
9. EBITDA
EBITDA is a good way of judging operating profitability for consumer internet companies because it excludes various one-time or non-cash expenses (depreciation), providing a more standardized view of the business’s profit potential.
Lyft has managed its cost base well over the last two years. It demonstrated solid profitability for a consumer internet business, producing an average EBITDA margin of 7.5%. This result was particularly impressive because of its low gross margin, which is mostly a factor of what it sells and takes huge shifts to move meaningfully. Companies have more control over their operating margins, and it’s a show of well-managed operations if they’re high when gross margins are low.
Looking at the trend in its profitability, Lyft’s EBITDA margin rose by 18.5 percentage points over the last few years, as its sales growth gave it immense operating leverage.
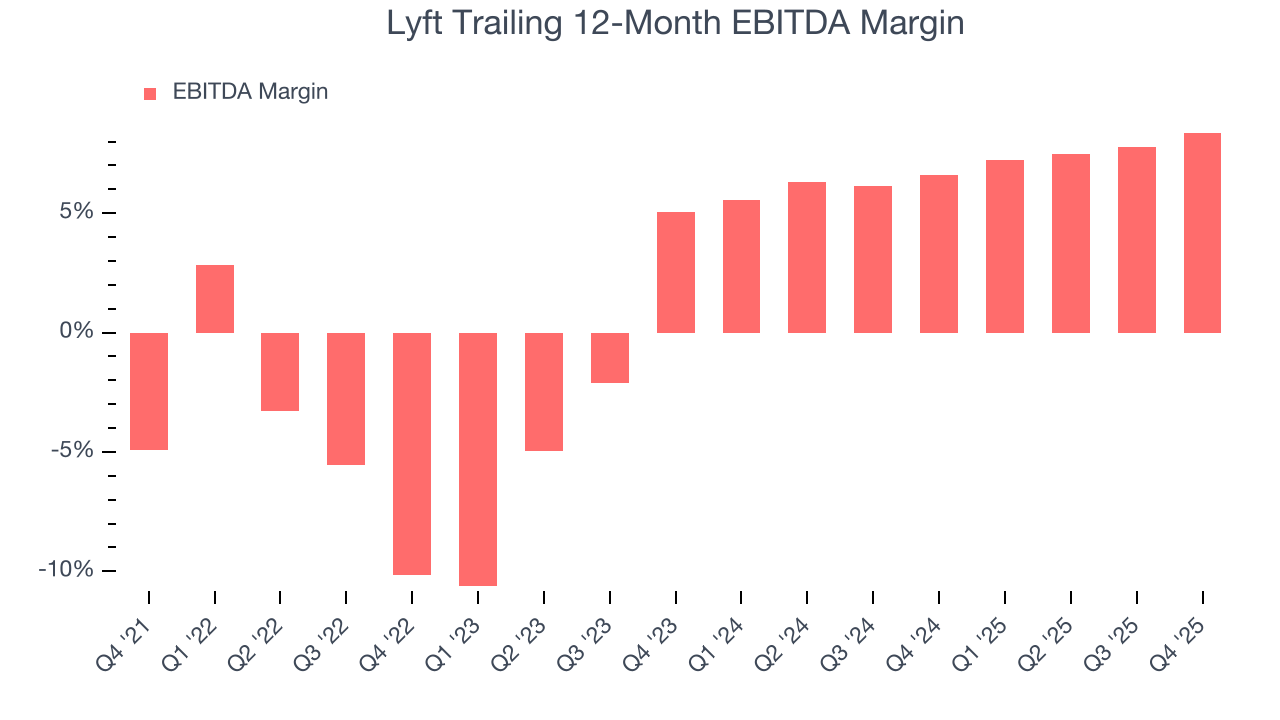
In Q4, Lyft generated an EBITDA margin profit margin of 9.7%, up 2.4 percentage points year on year. The increase was a welcome development and shows its expenses recently grew slower than its revenue, leading to higher efficiency.
10. Earnings Per Share
Revenue trends explain a company’s historical growth, but the long-term change in earnings per share (EPS) points to the profitability of that growth – for example, a company could inflate its sales through excessive spending on advertising and promotions.
Lyft’s full-year EPS flipped from negative to positive over the last three years. This is a good sign and shows it’s at an inflection point.
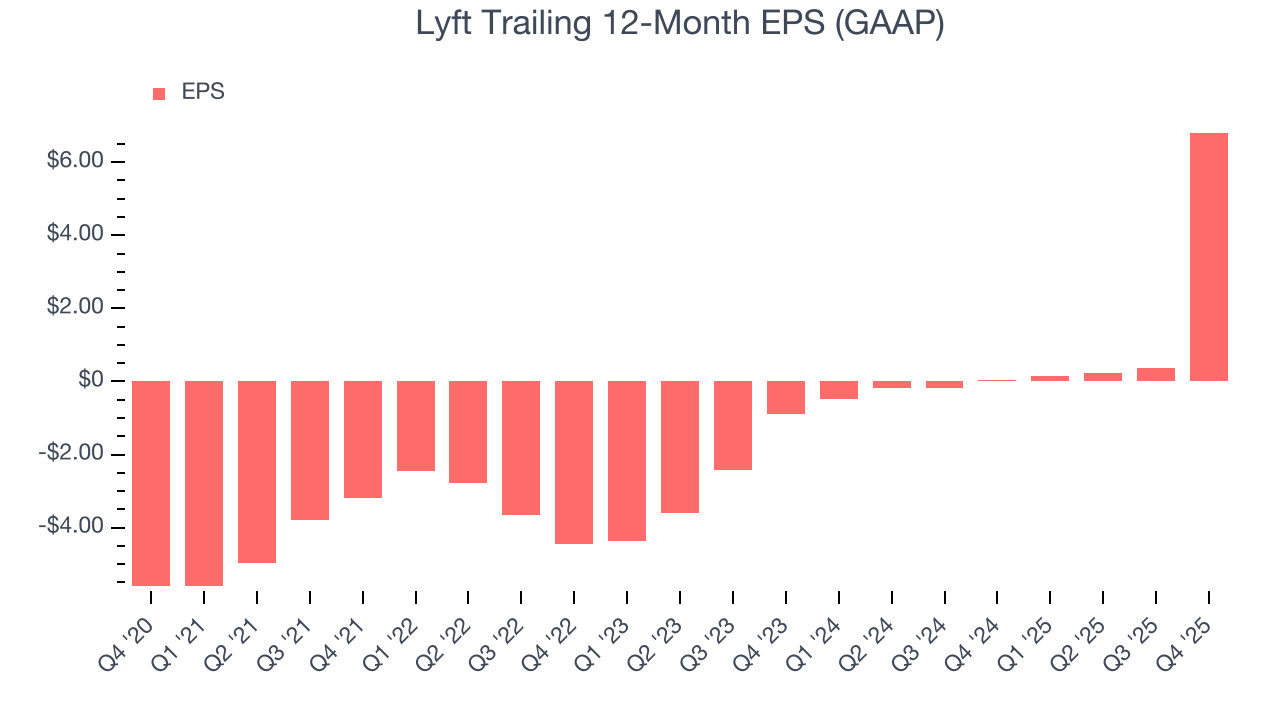
In Q4, Lyft reported EPS of $6.59, up from $0.15 in the same quarter last year. This print easily cleared analysts’ estimates, and shareholders should be content with the results. Over the next 12 months, Wall Street expects Lyft’s full-year EPS of $6.81 to shrink by 90.8%.
11. Cash Is King
Although EBITDA is undoubtedly valuable for assessing company performance, we believe cash is king because you can’t use accounting profits to pay the bills.
Lyft has shown robust cash profitability, driven by its cost-effective customer acquisition strategy that enables it to invest in new products and services rather than sales and marketing. The company’s free cash flow margin averaged 15.5% over the last two years, quite impressive for a consumer internet business.
Taking a step back, we can see that Lyft’s margin expanded by 26.3 percentage points over the last few years. This is encouraging, and we can see it became a less capital-intensive business because its free cash flow profitability rose more than its operating profitability.
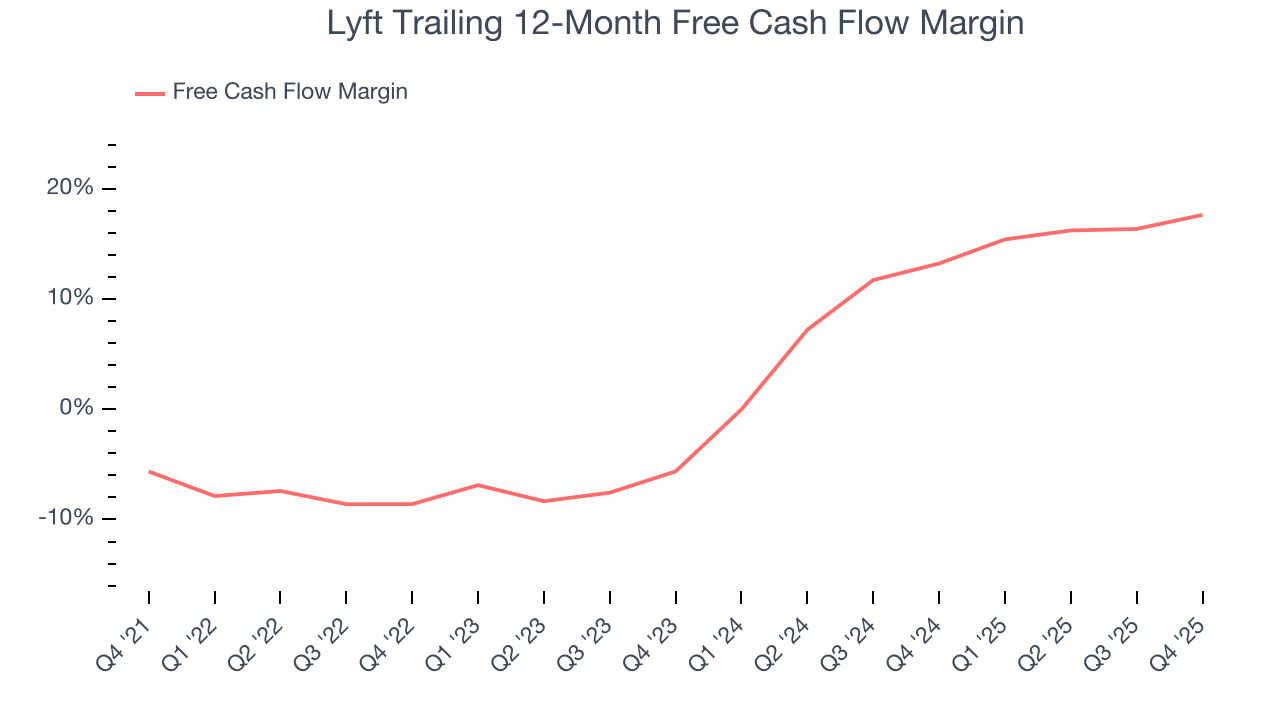
Lyft’s free cash flow clocked in at $227.6 million in Q4, equivalent to a 14.3% margin. This result was good as its margin was 5.3 percentage points higher than in the same quarter last year, building on its favorable historical trend.
12. Balance Sheet Assessment
Businesses that maintain a cash surplus face reduced bankruptcy risk.
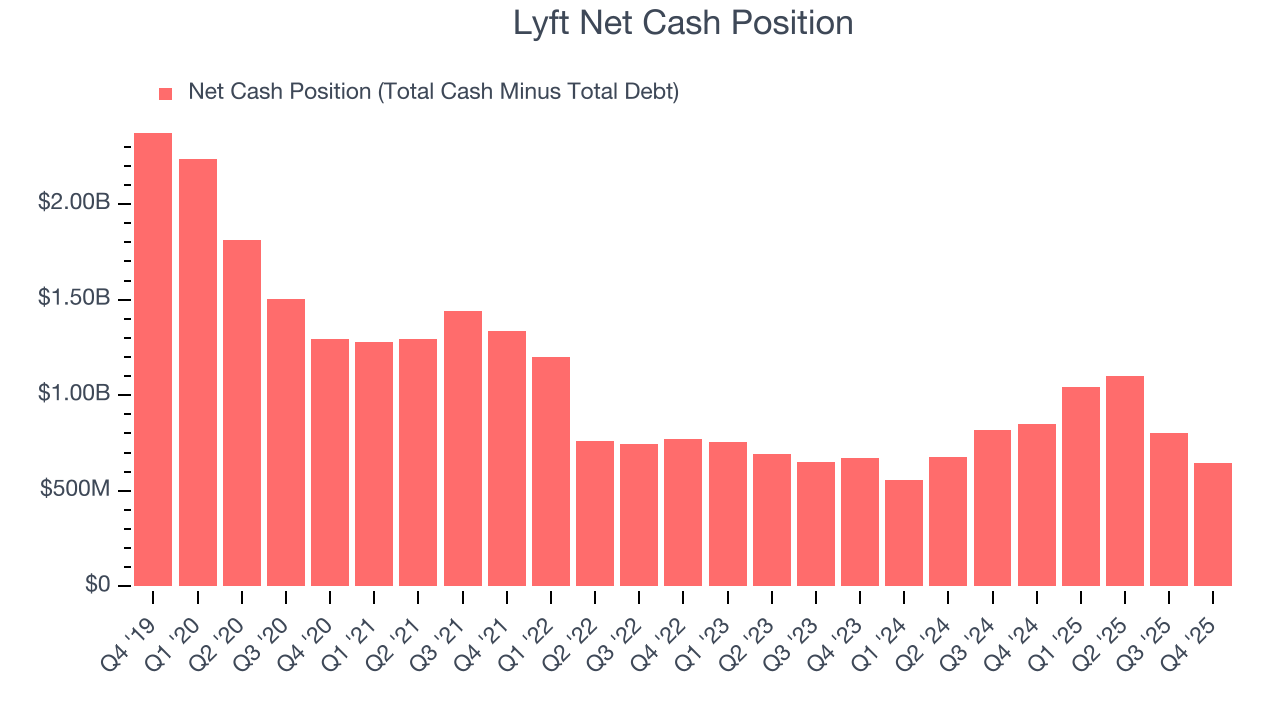
Lyft is a well-capitalized company with $1.84 billion of cash and $1.19 billion of debt on its balance sheet. This $646.8 million net cash position is 9.6% of its market cap and gives it the freedom to borrow money, return capital to shareholders, or invest in growth initiatives. Leverage is not an issue here.
13. Key Takeaways from Lyft’s Q4 Results
We enjoyed seeing Lyft beat analysts’ EBITDA expectations this quarter. We were also glad it expanded its number of users. On the other hand, its revenue missed and its EBITDA guidance for next quarter fell short of Wall Street’s estimates. Overall, this was a weaker quarter. The stock traded down 9% to $15.36 immediately following the results.
14. Is Now The Time To Buy Lyft?
Updated: March 20, 2026 at 10:21 PM EDT
Are you wondering whether to buy Lyft or pass? We urge investors to not only consider the latest earnings results but also longer-term business quality and valuation as well.
There are several reasons why we think Lyft is a great business. First, the company’s revenue growth was solid over the last three years, and analysts believe this will continue. And while its gross margins make it extremely difficult to reach positive operating profits compared to other consumer internet businesses, its rising cash profitability gives it more optionality. On top of that, Lyft’s expanding EBITDA margin shows the business has become more efficient.
Lyft’s EV/EBITDA ratio based on the next 12 months is 7.1x. Looking at the consumer internet space today, Lyft’s fundamentals really stand out, and we like it at this bargain price.
Wall Street analysts have a consensus one-year price target of $19.55 on the company (compared to the current share price of $13.49), implying they see 44.9% upside in buying Lyft in the short term.