
Manhattan Associates (MANH)
We’re wary of Manhattan Associates. Its weak revenue growth and gross margin show it not only lacks demand but also decent unit economics.― StockStory Analyst Team
1. News


2. Summary
Why We Think Manhattan Associates Will Underperform
Built on a "versionless" cloud architecture that delivers quarterly updates to all customers, Manhattan Associates (NASDAQ:MANH) develops cloud-based software that helps retailers, wholesalers, and manufacturers manage their supply chains, inventory, and omnichannel operations.
- Gross margin of 56.3% reflects its high servicing costs
- Products, pricing, or go-to-market strategy may need some adjustments as its 4.1% average billings growth over the last year was weak
- On the bright side, its successful business model is illustrated by its impressive operating margin


Manhattan Associates doesn’t check our boxes. We’re on the lookout for more interesting opportunities.
Why There Are Better Opportunities Than Manhattan Associates


At $140.56 per share, Manhattan Associates trades at 7.5x forward price-to-sales. This multiple is higher than most software companies, and we think it’s quite expensive for the weaker revenue growth you get.
There are stocks out there featuring similar valuation multiples with better fundamentals. We prefer to invest in those.
3. Manhattan Associates (MANH) Research Report: Q4 CY2025 Update
Supply chain software provider Manhattan Associates (NASDAQ:MANH) reported Q4 CY2025 results beating Wall Street’s revenue expectations, with sales up 5.7% year on year to $270.4 million. The company expects the full year’s revenue to be around $1.14 billion, close to analysts’ estimates. Its non-GAAP profit of $1.21 per share was 6.7% above analysts’ consensus estimates.
Manhattan Associates (MANH) Q4 CY2025 Highlights:
- Revenue: $270.4 million vs analyst estimates of $264.7 million (5.7% year-on-year growth, 2.2% beat)
- Adjusted EPS: $1.21 vs analyst estimates of $1.13 (6.7% beat)
- Adjusted EBITDA: $99.13 million vs analyst estimates of $89.09 million (36.7% margin, 11.3% beat)
- Adjusted EPS guidance for the upcoming financial year 2026 is $5.12 at the midpoint, missing analyst estimates by 3.6%
- Operating Margin: 24.8%, up from 23.7% in the same quarter last year
- Free Cash Flow Margin: 1.7%, down from 31.6% in the previous quarter
- Billings: $310.2 million at quarter end, up 8.8% year on year
- Market Capitalization: $10.68 billion
Company Overview
Built on a "versionless" cloud architecture that delivers quarterly updates to all customers, Manhattan Associates (NASDAQ:MANH) develops cloud-based software that helps retailers, wholesalers, and manufacturers manage their supply chains, inventory, and omnichannel operations.
Manhattan's software solutions are organized into three main portfolios. Its Supply Chain solutions include warehouse management systems that optimize distribution center operations and transportation management systems that help companies minimize freight costs while meeting service requirements. Its Omnichannel solutions enable retailers to provide seamless shopping experiences across physical stores and digital channels, with capabilities like order management, point-of-sale, and store fulfillment options such as buy online, pickup in store. The Inventory portfolio helps businesses forecast demand and optimize inventory levels across locations.
The company's Manhattan Active platform is cloud-native and updated quarterly, ensuring customers always have access to the latest features without disruptive upgrades. This platform is fully extensible, allowing customers to modify the user interface, data model, and business logic to meet their specific needs. Manhattan has also embedded artificial intelligence capabilities throughout its applications, with increasing investment in generative AI to enhance productivity and user experiences.
A typical Manhattan customer might be a national retailer using the company's software to manage inventory across distribution centers and stores, optimize order fulfillment from the most cost-effective location, and provide store associates with mobile tools to process transactions and fulfill online orders. Manhattan generates revenue through multi-year cloud subscriptions (typically five years or more), professional services, and maintenance for on-premises solutions.
4. Vertical Software
Software is eating the world, and while a large number of solutions such as project management or video conferencing software can be useful to a wide array of industries, some have very specific needs. As a result, vertical software, which addresses industry-specific workflows, is growing and fueled by the pressures to improve productivity, whether it be for a life sciences, education, or banking company.
Manhattan Associates' competitors include ERP vendors like Oracle, SAP, and Infor; supply chain software providers such as Blue Yonder (owned by Panasonic), Korber, and IBM Sterling Commerce; and point-of-sale vendors including Aptos and Oracle Retail.
5. Revenue Growth
A company’s long-term sales performance is one signal of its overall quality. Any business can put up a good quarter or two, but many enduring ones grow for years. Over the last five years, Manhattan Associates grew its sales at a 13% annual rate. Although this growth is acceptable on an absolute basis, it fell short of our standards for the software sector, which enjoys a number of secular tailwinds.
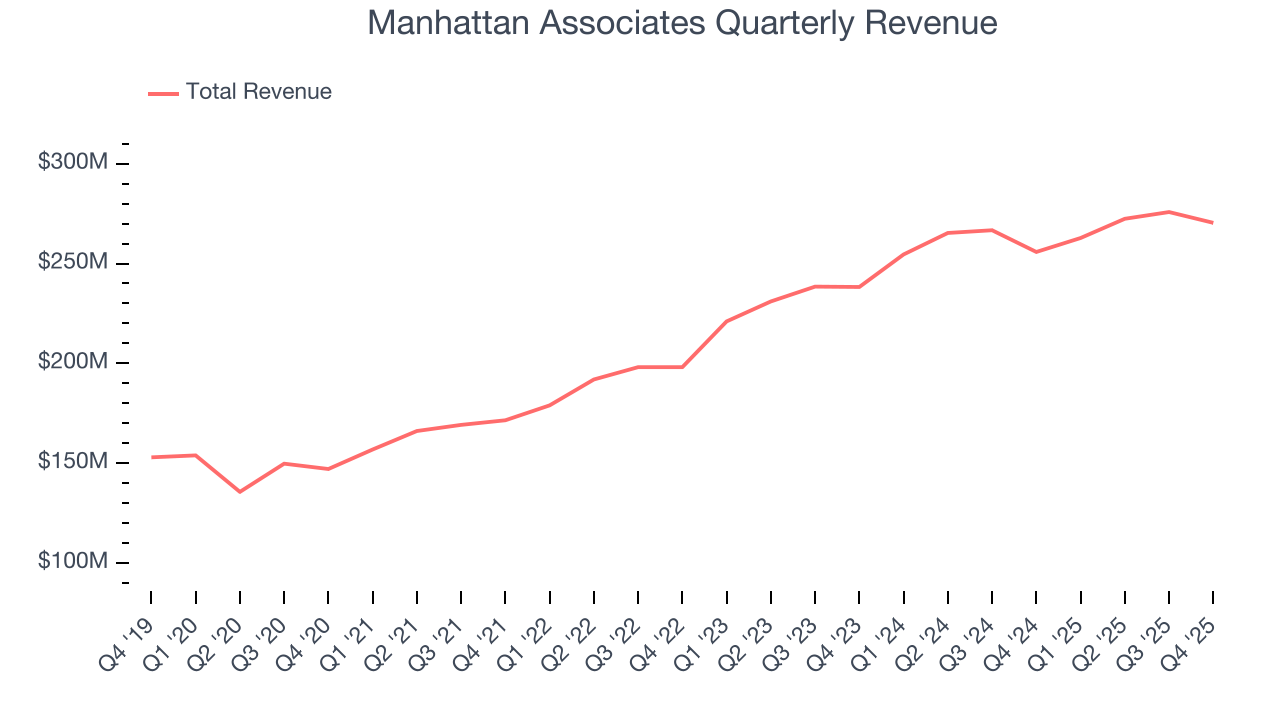
We at StockStory place the most emphasis on long-term growth, but within software, a half-decade historical view may miss recent innovations or disruptive industry trends. Manhattan Associates’s recent performance shows its demand has slowed as its annualized revenue growth of 7.9% over the last two years was below its five-year trend. 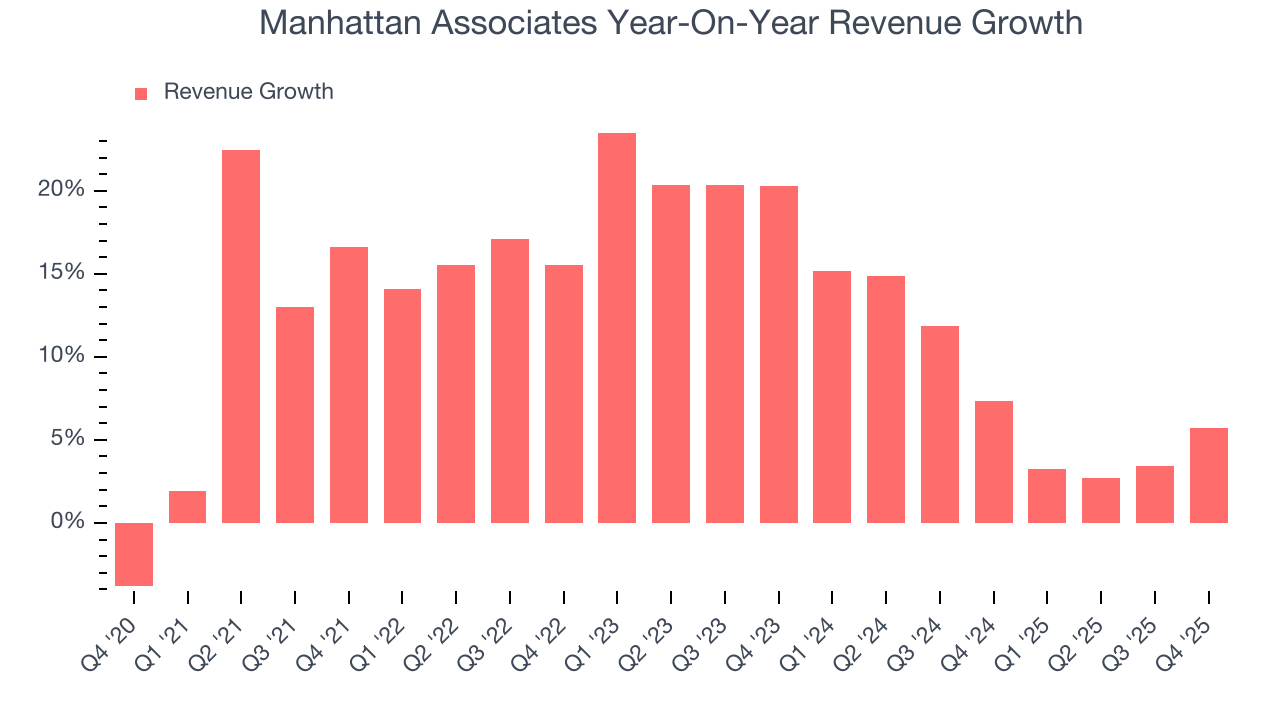
This quarter, Manhattan Associates reported year-on-year revenue growth of 5.7%, and its $270.4 million of revenue exceeded Wall Street’s estimates by 2.2%.
Looking ahead, sell-side analysts expect revenue to grow 5.7% over the next 12 months, a slight deceleration versus the last two years. This projection is underwhelming and suggests its products and services will see some demand headwinds.
6. Billings
Billings is a non-GAAP metric that is often called “cash revenue” because it shows how much money the company has collected from customers in a certain period. This is different from revenue, which must be recognized in pieces over the length of a contract.
Manhattan Associates’s billings came in at $310.2 million in Q4, and over the last four quarters, its growth was underwhelming as it averaged 4.1% year-on-year increases. This performance mirrored its total sales and suggests that increasing competition is causing challenges in acquiring/retaining customers. 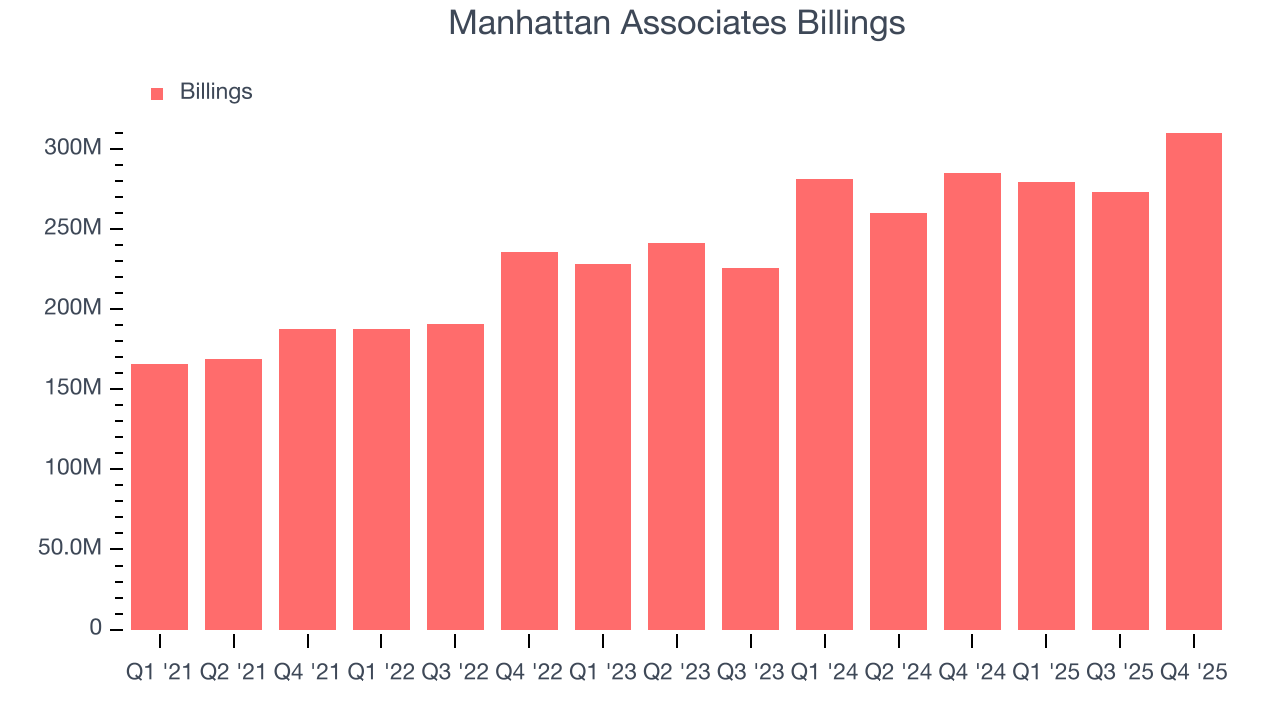
7. Customer Acquisition Efficiency
The customer acquisition cost (CAC) payback period measures the months a company needs to recoup the money spent on acquiring a new customer. This metric helps assess how quickly a business can break even on its sales and marketing investments.
Manhattan Associates is extremely efficient at acquiring new customers, and its CAC payback period checked in at 10 months this quarter. The company’s rapid recovery of its customer acquisition costs means it can attempt to spur growth by increasing its sales and marketing investments.
8. Gross Margin & Pricing Power
For software companies like Manhattan Associates, gross profit tells us how much money remains after paying for the base cost of products and services (typically servers, licenses, and certain personnel). These costs are usually low as a percentage of revenue, explaining why software is more lucrative than other sectors.
Manhattan Associates’s gross margin is substantially worse than most software businesses, signaling it has relatively high infrastructure costs compared to asset-lite businesses like ServiceNow. As you can see below, it averaged a 56.3% gross margin over the last year. Said differently, Manhattan Associates had to pay a chunky $43.68 to its service providers for every $100 in revenue.
The market not only cares about gross margin levels but also how they change over time because expansion creates firepower for profitability and free cash generation. Manhattan Associates has seen gross margins improve by 2.7 percentage points over the last 2 year, which is very good in the software space.
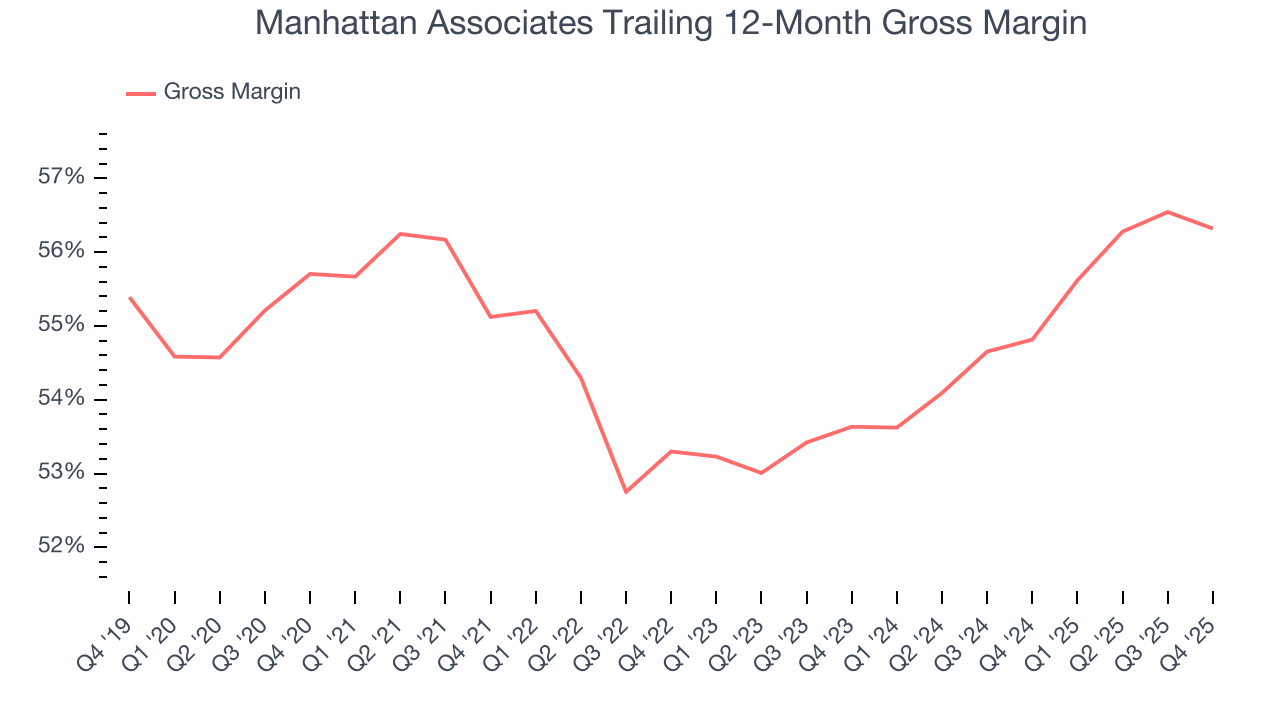
This quarter, Manhattan Associates’s gross profit margin was 55%, in line with the same quarter last year. Zooming out, Manhattan Associates’s full-year margin has been trending up over the past 12 months, increasing by 1.5 percentage points. If this move continues, it could suggest better unit economics due to more leverage from its growing sales on the fixed portion of its cost of goods sold (such as servers).
9. Operating Margin
While many software businesses point investors to their adjusted profits, which exclude stock-based compensation (SBC), we prefer GAAP operating margin because SBC is a legitimate expense used to attract and retain talent. This metric shows how much revenue remains after accounting for all core expenses – everything from the cost of goods sold to sales and R&D.
Manhattan Associates has been a well-oiled machine over the last year. It demonstrated elite profitability for a software business, boasting an average operating margin of 25.9%. This result was particularly impressive because of its low gross margin, which is mostly a factor of what it sells and takes huge shifts to move meaningfully. Companies have more control over their operating margins, and it’s a show of well-managed operations if they’re high when gross margins are low.
Analyzing the trend in its profitability, Manhattan Associates’s operating margin might fluctuated slightly but has generally stayed the same over the last two years. This raises questions about the company’s expense base because its revenue growth should have given it leverage on its fixed costs, resulting in better economies of scale and profitability.
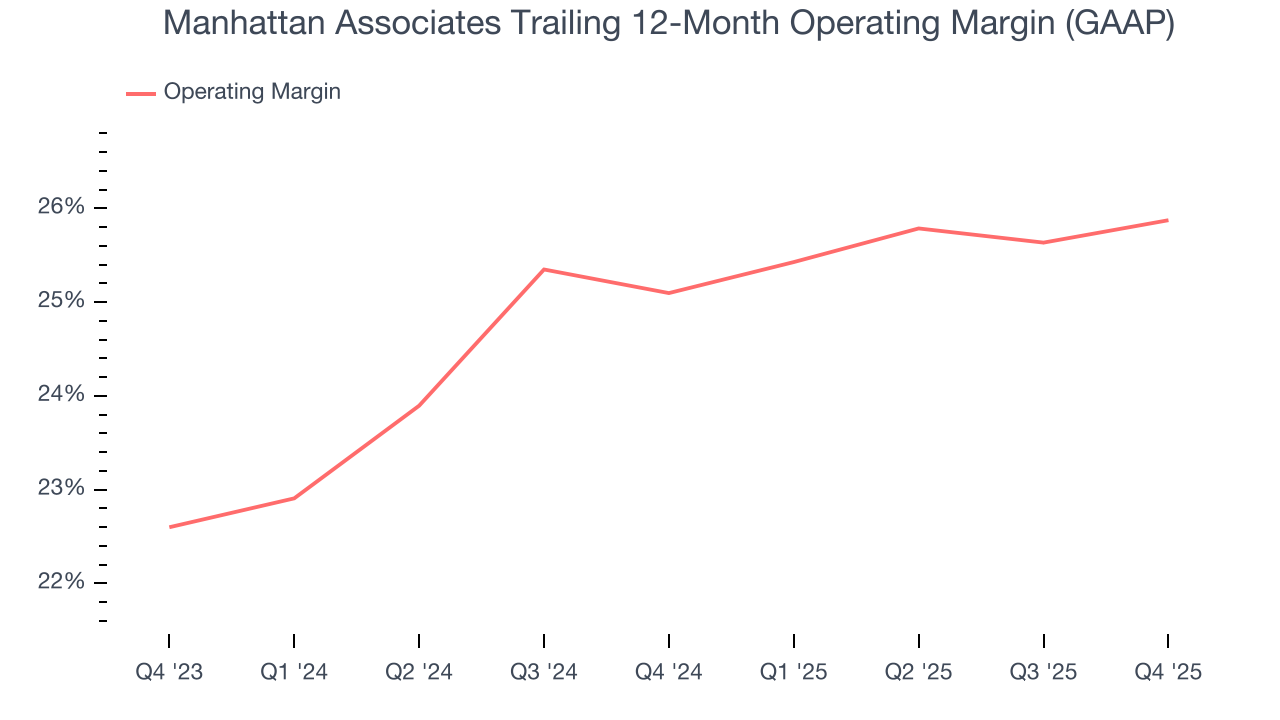
This quarter, Manhattan Associates generated an operating margin profit margin of 24.8%, up 1.1 percentage points year on year. The increase was encouraging, and because its operating margin rose more than its gross margin, we can infer it was more efficient with expenses such as marketing, R&D, and administrative overhead.
10. Cash Is King
If you’ve followed StockStory for a while, you know we emphasize free cash flow. Why, you ask? We believe that in the end, cash is king, and you can’t use accounting profits to pay the bills.
Manhattan Associates has shown impressive cash profitability, driven by its cost-effective customer acquisition strategy that gives it the option to invest in new products and services rather than sales and marketing. The company’s free cash flow margin averaged 21.8% over the last year, better than the broader software sector.
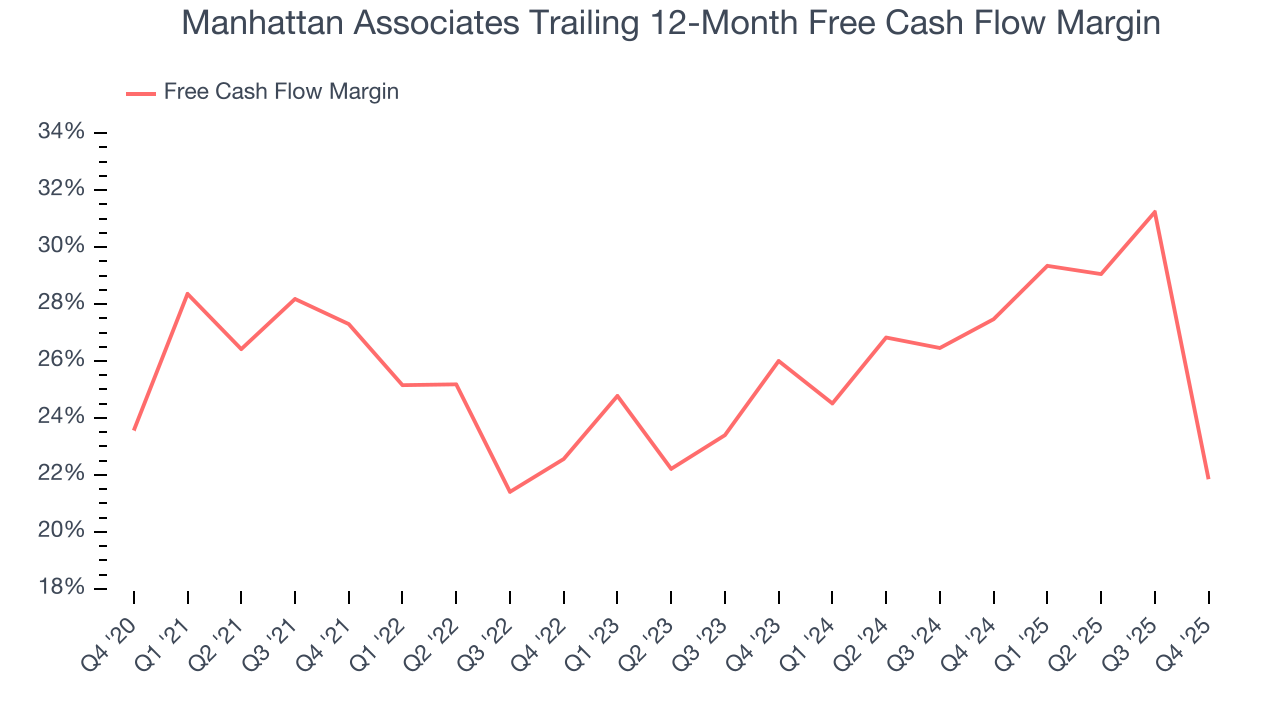
Manhattan Associates’s free cash flow clocked in at $4.66 million in Q4, equivalent to a 1.7% margin. The company’s cash profitability regressed as it was 38 percentage points lower than in the same quarter last year, prompting us to pay closer attention. Short-term fluctuations typically aren’t a big deal because investment needs can be seasonal, but we’ll be watching to see if the trend extrapolates into future quarters.
Over the next year, analysts predict Manhattan Associates’s cash conversion will improve. Their consensus estimates imply its free cash flow margin of 21.8% for the last 12 months will increase to 29.9%, giving it more flexibility for investments, share buybacks, and dividends.
11. Balance Sheet Assessment
Businesses that maintain a cash surplus face reduced bankruptcy risk.
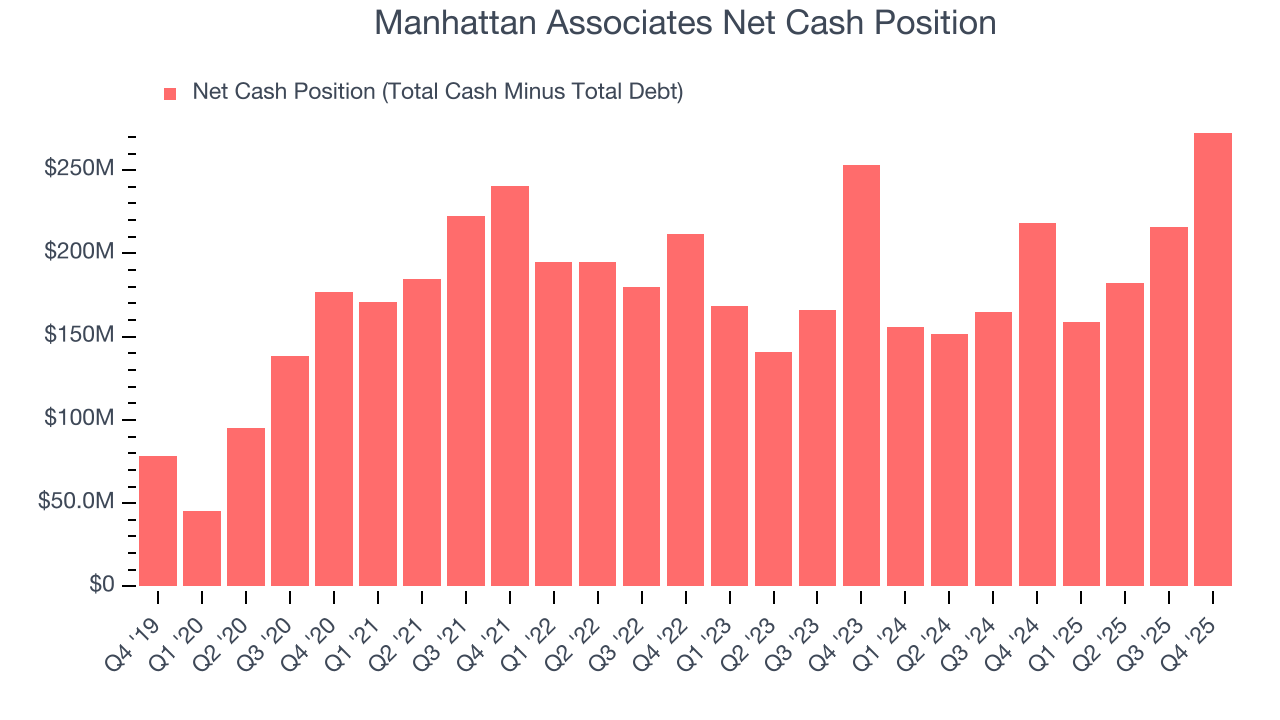
Manhattan Associates is a profitable, well-capitalized company with $328.7 million of cash and $56.18 million of debt on its balance sheet. This $272.6 million net cash position is 2.6% of its market cap and gives it the freedom to borrow money, return capital to shareholders, or invest in growth initiatives. Leverage is not an issue here.
12. Key Takeaways from Manhattan Associates’s Q4 Results
We were impressed by how significantly Manhattan Associates blew past analysts’ EBITDA expectations this quarter. We were also glad next year’s revenue guidance was robust. On the other hand, its full-year EPS guidance missed and its full-year revenue guidance was in line with Wall Street’s estimates. Zooming out, we think this was a mixed quarter. The stock traded up 5.7% to $179.50 immediately after reporting.
13. Is Now The Time To Buy Manhattan Associates?
Updated: March 17, 2026 at 10:38 PM EDT
We think that the latest earnings result is only one piece of the bigger puzzle. If you’re deciding whether to own Manhattan Associates, you should also grasp the company’s longer-term business quality and valuation.
Manhattan Associates’s business quality ultimately falls short of our standards. To begin with, its revenue growth was uninspiring over the last five years, and analysts expect its demand to deteriorate over the next 12 months. While its efficient sales strategy allows it to target and onboard new users at scale, the downside is its gross margins show its business model is much less lucrative than other companies. On top of that, its operating margin hasn't moved over the last year.
Manhattan Associates’s price-to-sales ratio based on the next 12 months is 7.5x. Investors with a higher risk tolerance might like the company, but we think the potential downside is too great. We're fairly confident there are better investments elsewhere.
Wall Street analysts have a consensus one-year price target of $208.55 on the company (compared to the current share price of $140.56).
Although the price target is bullish, readers should exercise caution because analysts tend to be overly optimistic. The firms they work for, often big banks, have relationships with companies that extend into fundraising, M&A advisory, and other rewarding business lines. As a result, they typically hesitate to say bad things for fear they will lose out. We at StockStory do not suffer from such conflicts of interest, so we’ll always tell it like it is.