
MillerKnoll (MLKN)
MillerKnoll faces an uphill battle. Its underwhelming returns on capital show it struggled to generate meaningful profits for shareholders.― StockStory Analyst Team
1. News


2. Summary
Why We Think MillerKnoll Will Underperform
Created through the 2021 merger of industry icons Herman Miller and Knoll, MillerKnoll (NASDAQ:MLKN) designs, manufactures, and distributes interior furnishings for offices, healthcare facilities, educational settings, and homes worldwide.
- Flat sales over the last two years suggest it must find different ways to grow during this cycle
- Earnings per share have dipped by 8.4% annually over the past five years, which is concerning because stock prices follow EPS over the long term
- Lacking free cash flow limits its freedom to invest in growth initiatives, execute share buybacks, or pay dividends


MillerKnoll doesn’t meet our quality standards. There are better opportunities in the market.
Why There Are Better Opportunities Than MillerKnoll


MillerKnoll’s stock price of $19.12 implies a valuation ratio of 8.9x forward P/E. MillerKnoll’s valuation may seem like a bargain, but we think there are valid reasons why it’s so cheap.
We’d rather pay up for companies with elite fundamentals than get a bargain on weak ones. Cheap stocks can be value traps, and as their performance deteriorates, they will stay cheap or get even cheaper.
3. MillerKnoll (MLKN) Research Report: Q1 CY2026 Update
Office furniture manufacturer MillerKnoll (NASDAQ:MLKN) fell short of the market’s revenue expectations in Q1 CY2026, but sales rose 5.8% year on year to $926.6 million. Next quarter’s revenue guidance of $975 million underwhelmed, coming in 1.8% below analysts’ estimates. Its non-GAAP profit of $0.43 per share was 4.4% below analysts’ consensus estimates.
MillerKnoll (MLKN) Q1 CY2026 Highlights:
- Revenue: $926.6 million vs analyst estimates of $942 million (5.8% year-on-year growth, 1.6% miss)
- Adjusted EPS: $0.43 vs analyst expectations of $0.45 (4.4% miss)
- Revenue Guidance for Q2 CY2026 is $975 million at the midpoint, below analyst estimates of $993.2 million
- Adjusted EPS guidance for Q2 CY2026 is $0.52 at the midpoint, below analyst estimates of $0.61
- Operating Margin: 4.8%, up from -8.9% in the same quarter last year
- Backlog: $711.6 million at quarter end
- Market Capitalization: $1.30 billion
Company Overview
Created through the 2021 merger of industry icons Herman Miller and Knoll, MillerKnoll (NASDAQ:MLKN) designs, manufactures, and distributes interior furnishings for offices, healthcare facilities, educational settings, and homes worldwide.
MillerKnoll operates through a portfolio of design brands that includes not only Herman Miller and Knoll, but also Design Within Reach, HAY, Muuto, Maharam, and several other specialized subsidiaries. The company's products range from office chairs and desk systems to textiles, lighting, and residential furniture pieces, many of which have become recognized as design classics.
The company serves its markets through three main segments. The Americas Contract segment focuses on workplace, healthcare, and educational environments across North and South America. The International Contract & Specialty segment handles similar markets in Europe, the Middle East, Africa, and Asia-Pacific, while also managing specialty brands focused on textiles and high-end furnishings. The Global Retail segment sells directly to consumers and third-party retailers.
A typical corporate client might work with MillerKnoll to outfit an entire office building with ergonomic workstations, collaborative spaces, and executive suites. Meanwhile, a residential customer might purchase an iconic Eames lounge chair through a Design Within Reach store or the company's e-commerce platform.
MillerKnoll generates revenue through multiple channels: independent furniture dealers (who account for over half of sales), direct sales to organizations, company-owned retail stores, e-commerce websites, and catalogs. The company maintains manufacturing facilities across the United States as well as in the United Kingdom, Italy, China, Brazil, Mexico, and India.
Beyond manufacturing, MillerKnoll invests significantly in research and design, spending over $60 million annually to develop new products and improve existing ones. The company holds numerous patents and trademarks, with many of its furniture designs considered iconic in the industry.
4. Office & Commercial Furniture
The sector faces a tepid outlook as workplace dynamics continue to evolve. Hybrid work means that enterprise demand for office furniture is lower. Consumer demand for the same products likely will not offset the loss from enterprises, as individual workers tend to have less space and need for the sector's wares. The Trump administration also possesses a high willingness to impose tariffs on key partners, which could result in retaliatory actions, all of which could pressure those selling furniture that may feature components or labor from overseas. Lastly, the COVID-19 pandemic showed that there is always a risk that something disrupts supply chains, and companies need contingency plans for this.
MillerKnoll's primary competitors in the contract furniture industry include Steelcase Inc. (NYSE:SCS), Haworth, and HNI Corporation (NYSE:HNI). In the retail home furnishings market, the company competes with Restoration Hardware (NYSE:RH), Wayfair (NYSE:W), Williams-Sonoma (NYSE:WSM), and Crate & Barrel.
5. Revenue Growth
A company’s long-term sales performance can indicate its overall quality. Any business can put up a good quarter or two, but the best consistently grow over the long haul.
With $3.80 billion in revenue over the past 12 months, MillerKnoll is one of the larger companies in the business services industry and benefits from a well-known brand that influences purchasing decisions.
As you can see below, MillerKnoll grew its sales at an impressive 10.4% compounded annual growth rate over the last five years. This shows it had high demand, a useful starting point for our analysis.
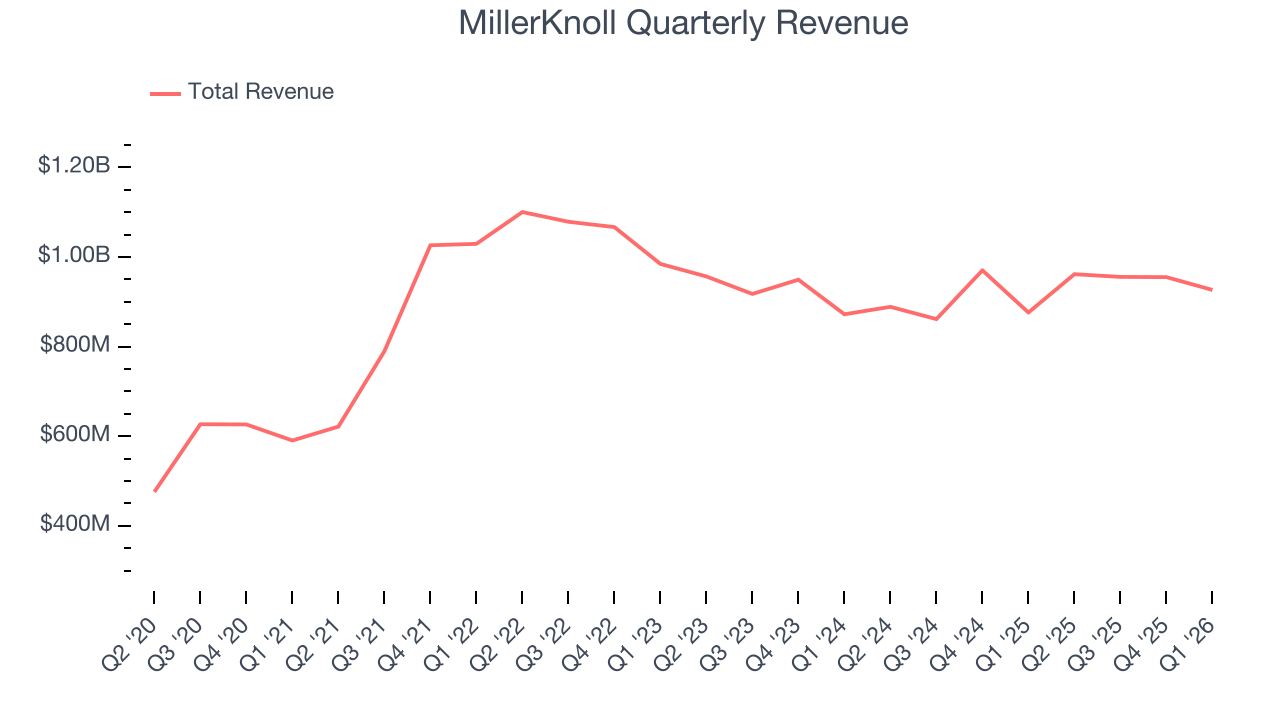
We at StockStory place the most emphasis on long-term growth, but within business services, a half-decade historical view may miss recent innovations or disruptive industry trends. MillerKnoll’s recent performance shows its demand has slowed significantly as its annualized revenue growth of 1.4% over the last two years was well below its five-year trend. 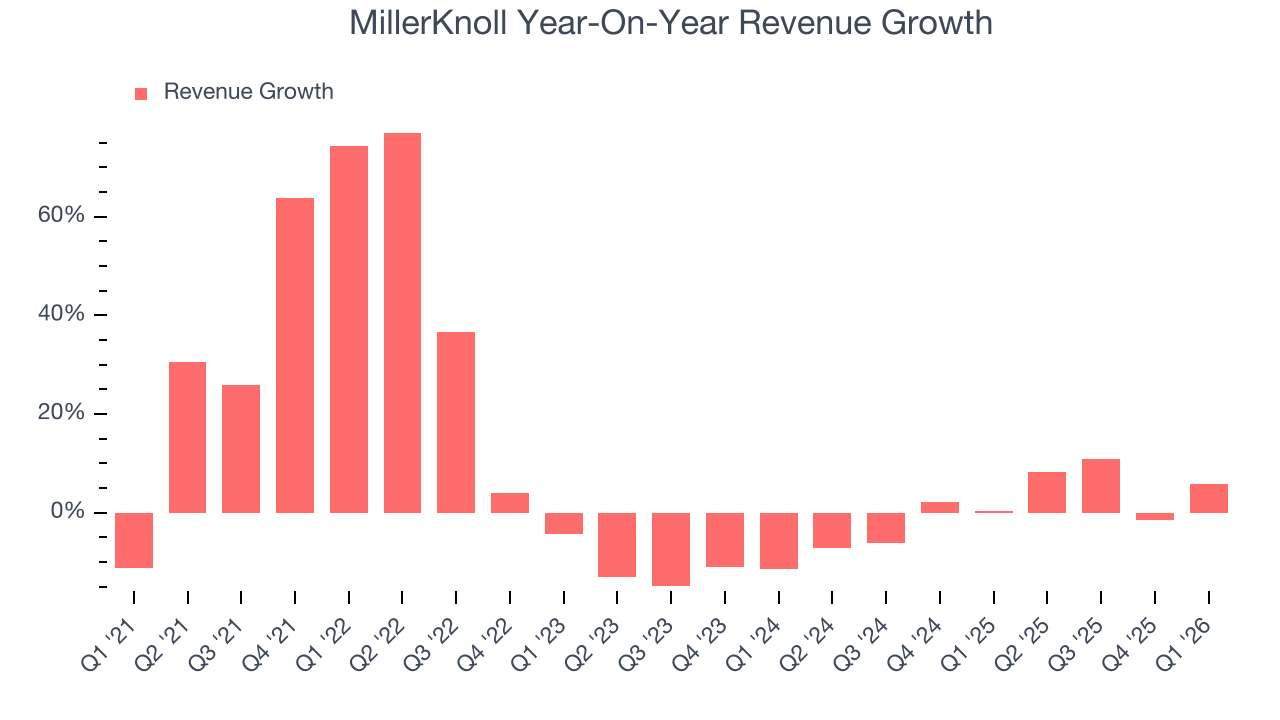
This quarter, MillerKnoll’s revenue grew by 5.8% year on year to $926.6 million, missing Wall Street’s estimates. Company management is currently guiding for a 1.4% year-on-year increase in sales next quarter.
Looking further ahead, sell-side analysts expect revenue to grow 5.4% over the next 12 months, an improvement versus the last two years. This projection is above average for the sector and implies its newer products and services will fuel better top-line performance.
6. Operating Margin
Operating margin is a key measure of profitability. Think of it as net income - the bottom line - excluding the impact of taxes and interest on debt, which are less connected to business fundamentals.
MillerKnoll was profitable over the last five years but held back by its large cost base. Its average operating margin of 5.4% was weak for a business services business.
On the plus side, MillerKnoll’s operating margin rose by 7.3 percentage points over the last five years, as its sales growth gave it immense operating leverage.
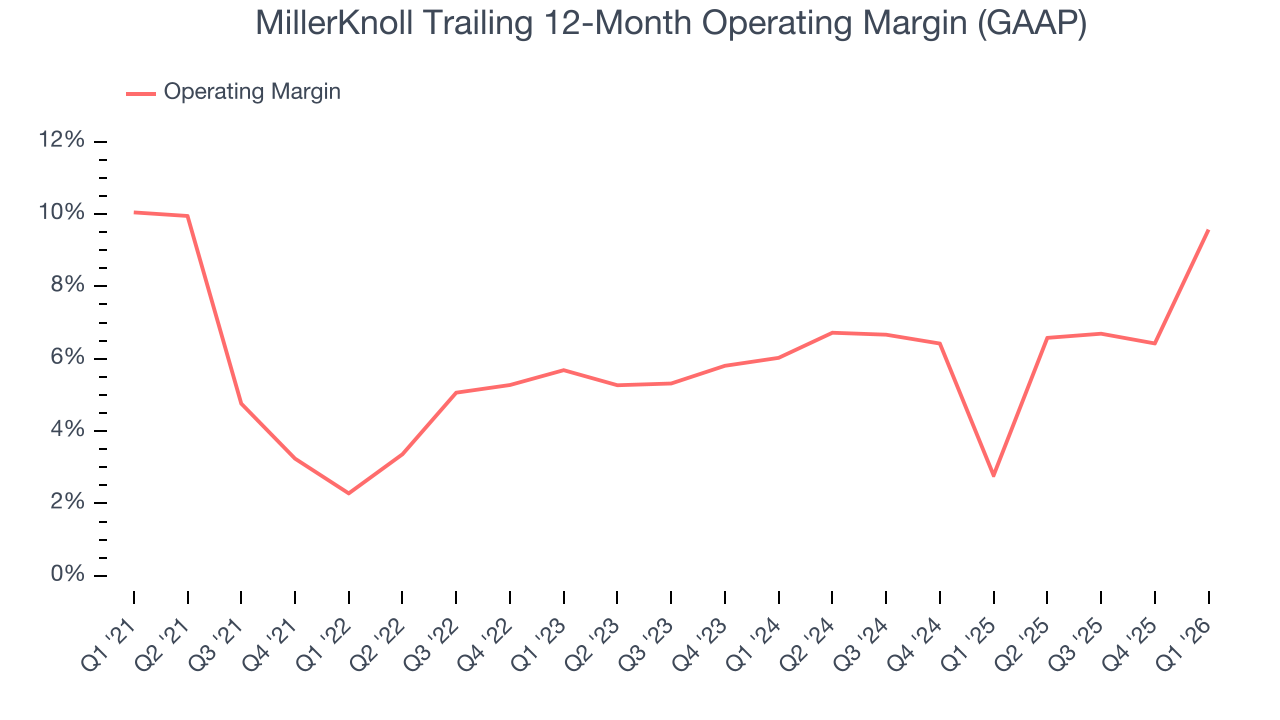
In Q1, MillerKnoll generated an operating margin profit margin of 4.8%, up 13.7 percentage points year on year. This increase was a welcome development and shows it was more efficient.
7. Earnings Per Share
We track the long-term change in earnings per share (EPS) for the same reason as long-term revenue growth. Compared to revenue, however, EPS highlights whether a company’s growth is profitable.
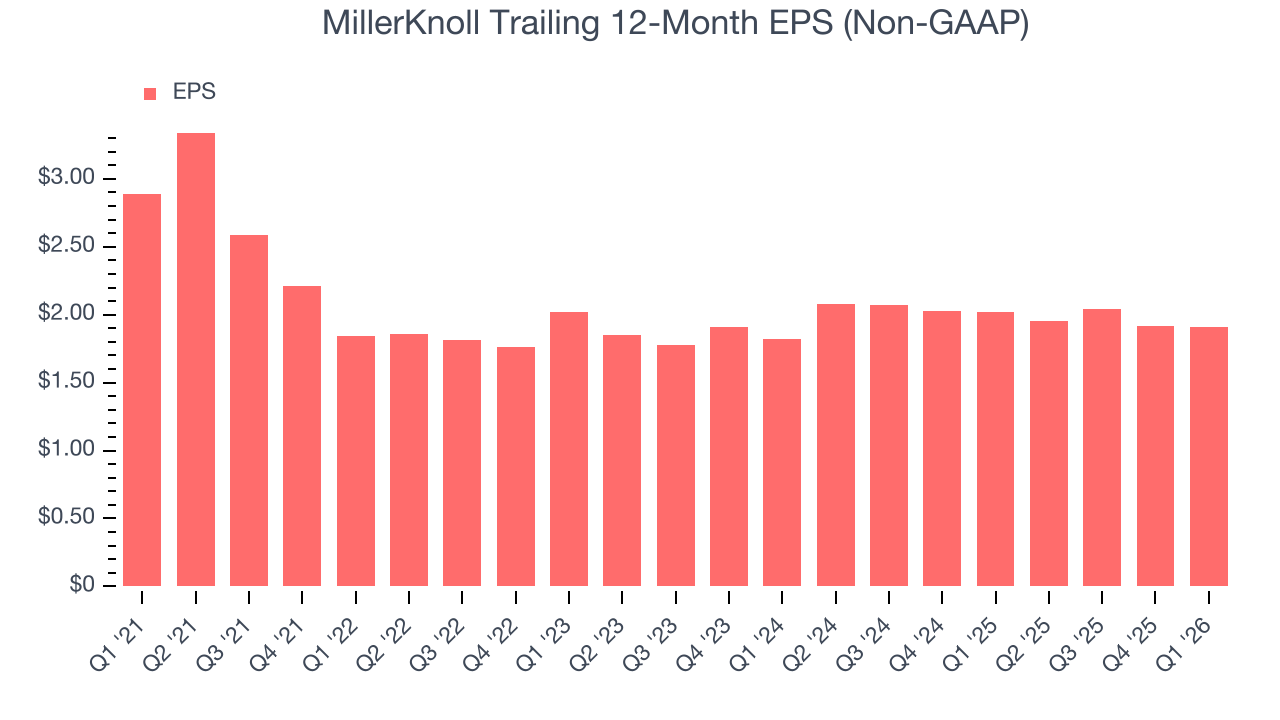
Sadly for MillerKnoll, its EPS declined by 7.9% annually over the last five years while its revenue grew by 10.4%. However, its operating margin actually improved during this time, telling us that non-fundamental factors such as interest expenses and taxes affected its ultimate earnings.
We can take a deeper look into MillerKnoll’s earnings to better understand the drivers of its performance. A five-year view shows MillerKnoll has diluted its shareholders, growing its share count by 16%. This dilution overshadowed its increased operational efficiency and has led to lower per share earnings. Taxes and interest expenses can also affect EPS but don’t tell us as much about a company’s fundamentals. 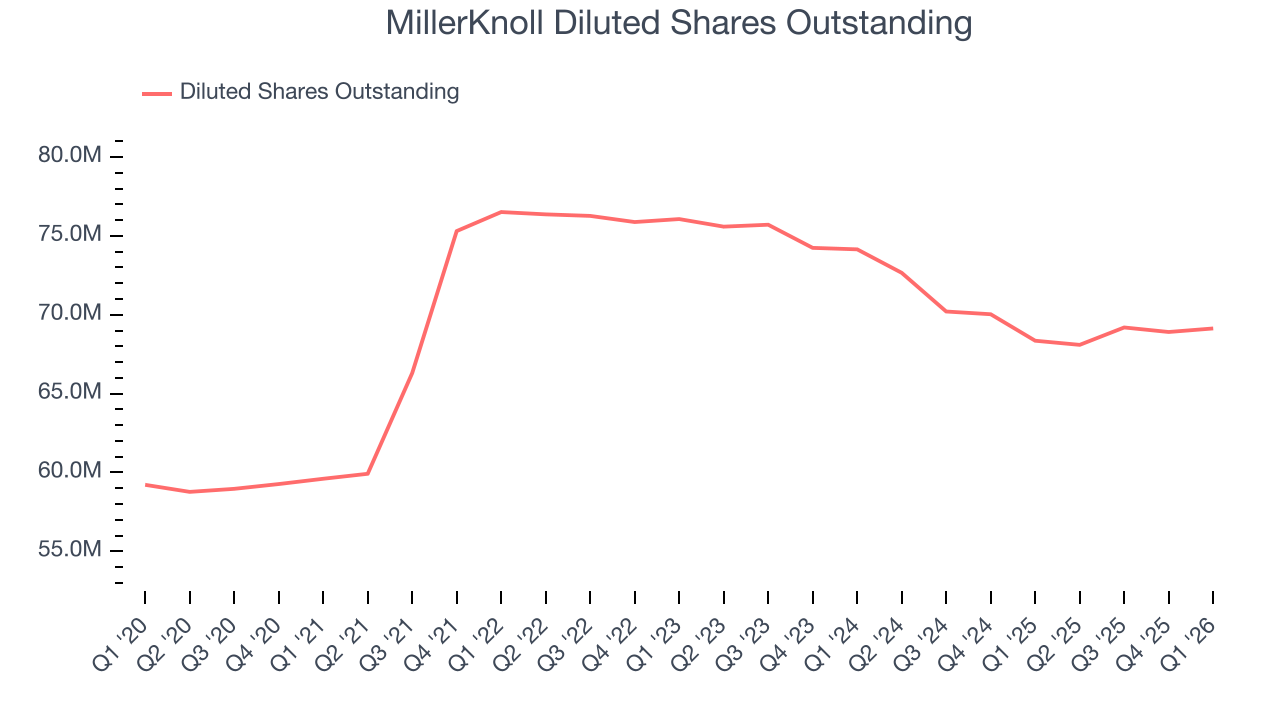
Like with revenue, we analyze EPS over a more recent period because it can provide insight into an emerging theme or development for the business.
For MillerKnoll, its two-year annual EPS growth of 2.4% was higher than its five-year trend. Accelerating earnings growth is almost always an encouraging data point.
In Q1, MillerKnoll reported adjusted EPS of $0.43, down from $0.44 in the same quarter last year. This print missed analysts’ estimates. Over the next 12 months, Wall Street expects MillerKnoll’s full-year EPS of $1.91 to grow 13.1%.
8. Cash Is King
Although earnings are undoubtedly valuable for assessing company performance, we believe cash is king because you can’t use accounting profits to pay the bills.
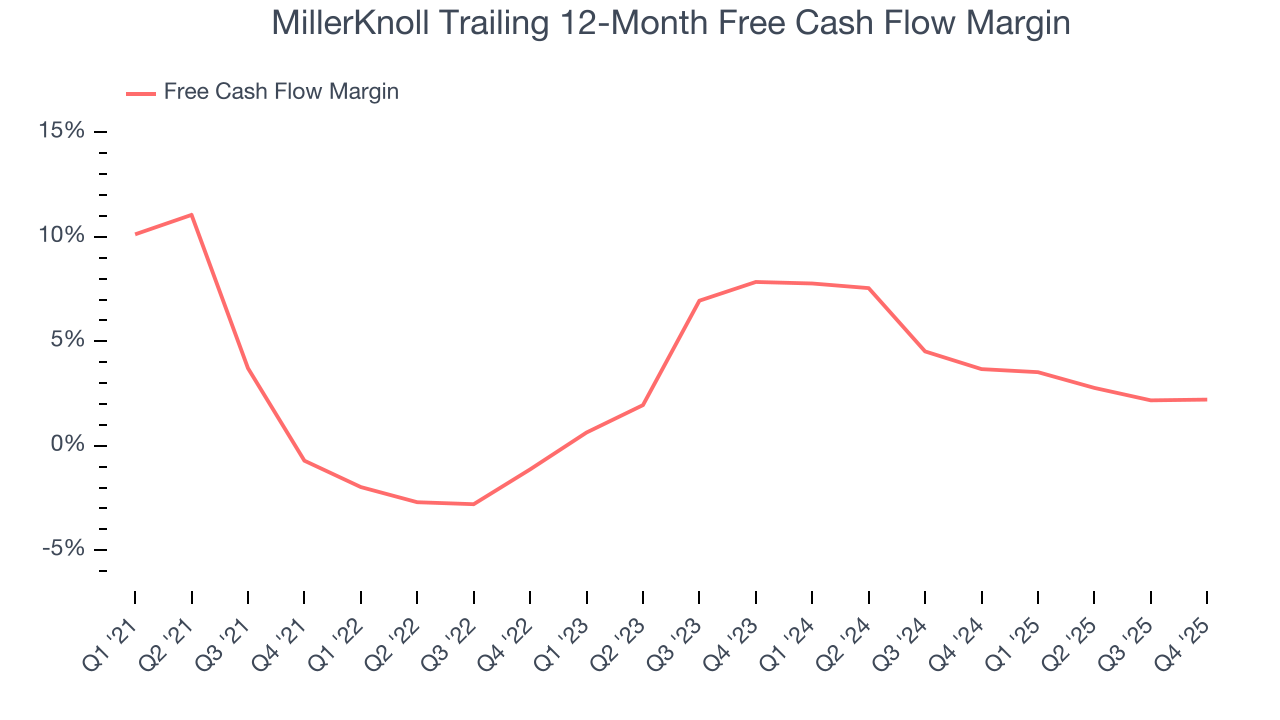
MillerKnoll has shown poor cash profitability relative to peers over the last five years, giving the company fewer opportunities to return capital to shareholders. Its free cash flow margin averaged 2.3%, below what we’d expect for a business services business.
Taking a step back, an encouraging sign is that MillerKnoll’s margin expanded by 3.5 percentage points during that time. We have no doubt shareholders would like to continue seeing its cash conversion rise as it gives the company more optionality.
9. Return on Invested Capital (ROIC)
EPS and free cash flow tell us whether a company was profitable while growing its revenue. But was it capital-efficient? A company’s ROIC explains this by showing how much operating profit it makes compared to the money it has raised (debt and equity).
MillerKnoll historically did a mediocre job investing in profitable growth initiatives. Its five-year average ROIC was 7.1%, somewhat low compared to the best business services companies that consistently pump out 25%+.
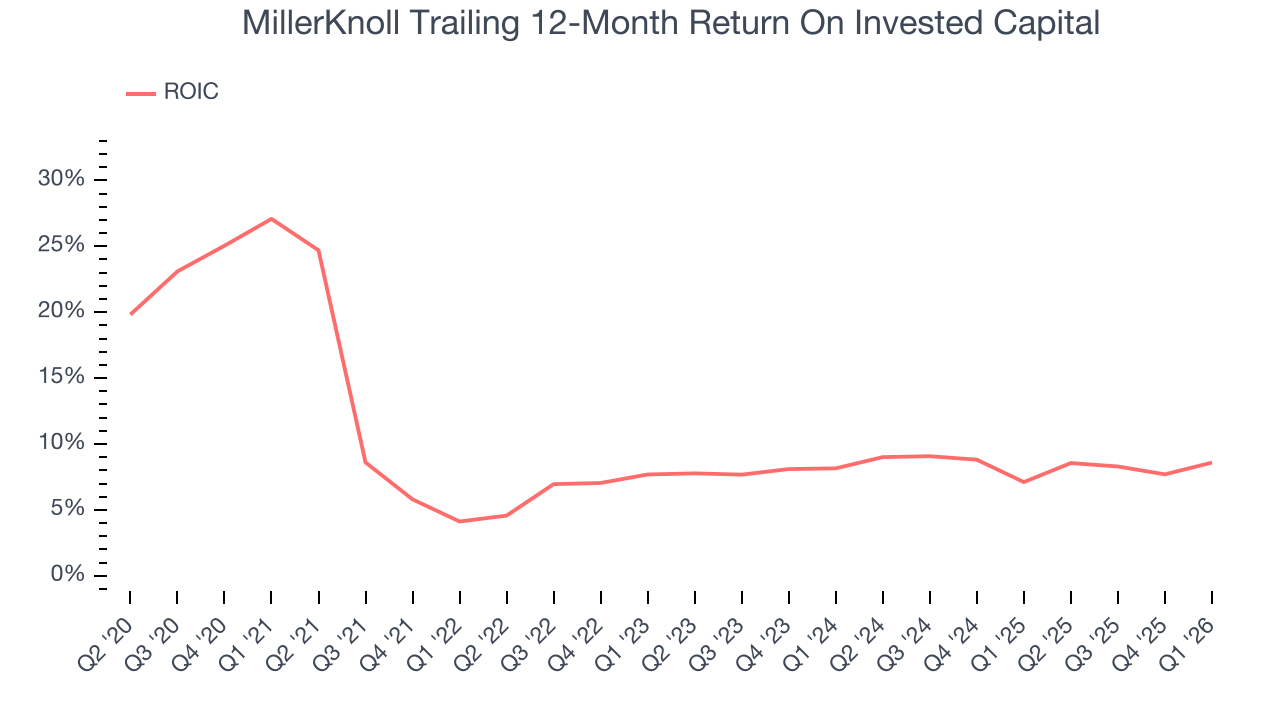
We like to invest in businesses with high returns, but the trend in a company’s ROIC is what often surprises the market and moves the stock price. Over the last few years, MillerKnoll’s ROIC averaged 1.9 percentage point increases each year. This is a good sign, and we hope the company can continue improving.
10. Key Takeaways from MillerKnoll’s Q1 Results
We struggled to find many positives in these results. Its EPS guidance for next quarter missed and its EPS fell short of Wall Street’s estimates. Overall, this was a softer quarter. The stock traded down 13.5% to $16.82 immediately following the results.
11. Is Now The Time To Buy MillerKnoll?
Updated: March 25, 2026 at 4:14 PM EDT
We think that the latest earnings result is only one piece of the bigger puzzle. If you’re deciding whether to own MillerKnoll, you should also grasp the company’s longer-term business quality and valuation.
MillerKnoll isn’t a terrible business, but it doesn’t pass our quality test. Although its revenue growth was impressive over the last five years, it’s expected to deteriorate over the next 12 months and its declining EPS over the last five years makes it a less attractive asset to the public markets. And while the company’s expanding operating margin shows the business has become more efficient, the downside is its low free cash flow margins give it little breathing room.
MillerKnoll’s P/E ratio based on the next 12 months is 9x. While this valuation is optically cheap, the potential downside is big given its shaky fundamentals. We're pretty confident there are superior stocks to buy right now.
Wall Street analysts have a consensus one-year price target of $32 on the company (compared to the current share price of $16.82).
Although the price target is bullish, readers should exercise caution because analysts tend to be overly optimistic. The firms they work for, often big banks, have relationships with companies that extend into fundraising, M&A advisory, and other rewarding business lines. As a result, they typically hesitate to say bad things for fear they will lose out. We at StockStory do not suffer from such conflicts of interest, so we’ll always tell it like it is.