PACCAR (PCAR)
We’re wary of PACCAR. Its low gross margin indicates weak unit economics and its declining sales suggest its offerings are unpopular.― StockStory Analyst Team
1. News


2. Summary
Why PACCAR Is Not Exciting
Founded more than a century ago, PACCAR (NASDAQ:PCAR) designs and manufactures commercial trucks of various weights and sizes for the commercial trucking industry.
- Competitive supply chain dynamics and steep production costs are reflected in its low gross margin of 16.5%
- Estimated sales growth of 4.4% for the next 12 months is soft and implies weaker demand
- On the bright side, its market-beating returns on capital illustrate that management has a knack for investing in profitable ventures, and its rising returns show it’s making even more lucrative bets


PACCAR doesn’t measure up to our expectations. More profitable opportunities exist elsewhere.
Why There Are Better Opportunities Than PACCAR


PACCAR is trading at $119.46 per share, or 22.2x forward P/E. This multiple is cheaper than most industrials peers, but we think this is justified.
Cheap stocks can look like a great deal at first glance, but they can be value traps. They often have less earnings power, meaning there is more reliance on a re-rating to generate good returns - an unlikely scenario for low-quality companies.
3. PACCAR (PCAR) Research Report: Q4 CY2025 Update
Trucking company PACCAR (NASDAQ:PCAR) missed Wall Street’s revenue expectations in Q4 CY2025, with sales falling 20.9% year on year to $6.25 billion. Its GAAP profit of $1.06 per share was in line with analysts’ consensus estimates.
PACCAR (PCAR) Q4 CY2025 Highlights:
- Revenue: $6.25 billion vs analyst estimates of $6.66 billion (20.9% year-on-year decline, 6.1% miss)
- EPS (GAAP): $1.06 vs analyst estimates of $1.05 (in line)
- Operating Margin: 7.8%, down from 11.4% in the same quarter last year
- Free Cash Flow Margin: 15.3%, up from 13.4% in the same quarter last year
- Market Capitalization: $64.13 billion
Company Overview
Founded more than a century ago, PACCAR (NASDAQ:PCAR) designs and manufactures commercial trucks of various weights and sizes for the commercial trucking industry.
Its trucks are used for long-haul transportation, regional distribution, heavy-duty hauling in the construction and mining industries, along with other more specialized tasks like waste collection and fire-firefighting. In addition to its namesake brand, PACCAR operates multiple other brands such Kenworth, Peterbilt, and DAF, each of which boast history and a strong reputation in the global trucking industry.
PACCAR sells its trucks through a network of independent dealers, which act as its main source of revenue generation, although the company leases and rents its trucks out to companies as well. Additionally, the company operates a parts and services segment as well as a financing segment that make up a smaller portion of its overall revenue.
The company’s largest customers are usually those in the logistics industries who need large trucking fleets to conduct their business. These companies often engage in high-volume purchases or leases of PACCAR’s products and maintenance services, which means that rather than fixed list prices, the company is willing to offer discounts and other deals for loyal customers who spend big.
4. Heavy Transportation Equipment
Heavy transportation equipment companies are investing in automated vehicles that increase efficiencies and connected machinery that collects actionable data. Some are also developing electric vehicles and mobility solutions to address customers’ concerns about carbon emissions, creating new sales opportunities. Additionally, they are increasingly offering automated equipment that increases efficiencies and connected machinery that collects actionable data. On the other hand, heavy transportation equipment companies are at the whim of economic cycles. Interest rates, for example, can greatly impact the construction and transport volumes that drive demand for these companies’ offerings.
Companies competing against PACCAR include Navistar International, (NYSE:NAV), Volvo (STO:VOLV-B), and Daimler Truck Holding (ETR:DAI).
5. Revenue Growth
A company’s long-term performance is an indicator of its overall quality. Any business can experience short-term success, but top-performing ones enjoy sustained growth for years. Luckily, PACCAR’s sales grew at a decent 8.3% compounded annual growth rate over the last five years. Its growth was slightly above the average industrials company and shows its offerings resonate with customers.
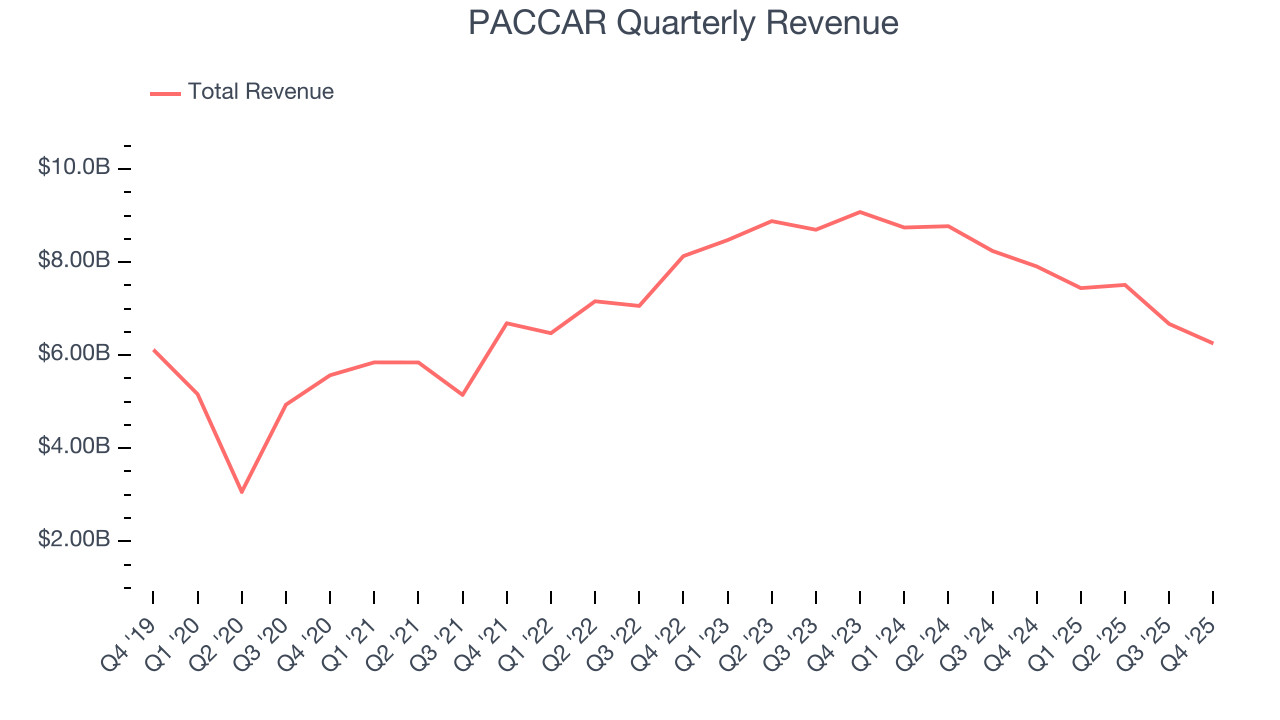
We at StockStory place the most emphasis on long-term growth, but within industrials, a half-decade historical view may miss cycles, industry trends, or a company capitalizing on catalysts such as a new contract win or a successful product line. PACCAR’s recent performance marks a sharp pivot from its five-year trend as its revenue has shown annualized declines of 10.9% over the last two years. PACCAR isn’t alone in its struggles as the Heavy Transportation Equipment industry experienced a cyclical downturn, with many similar businesses observing lower sales at this time. 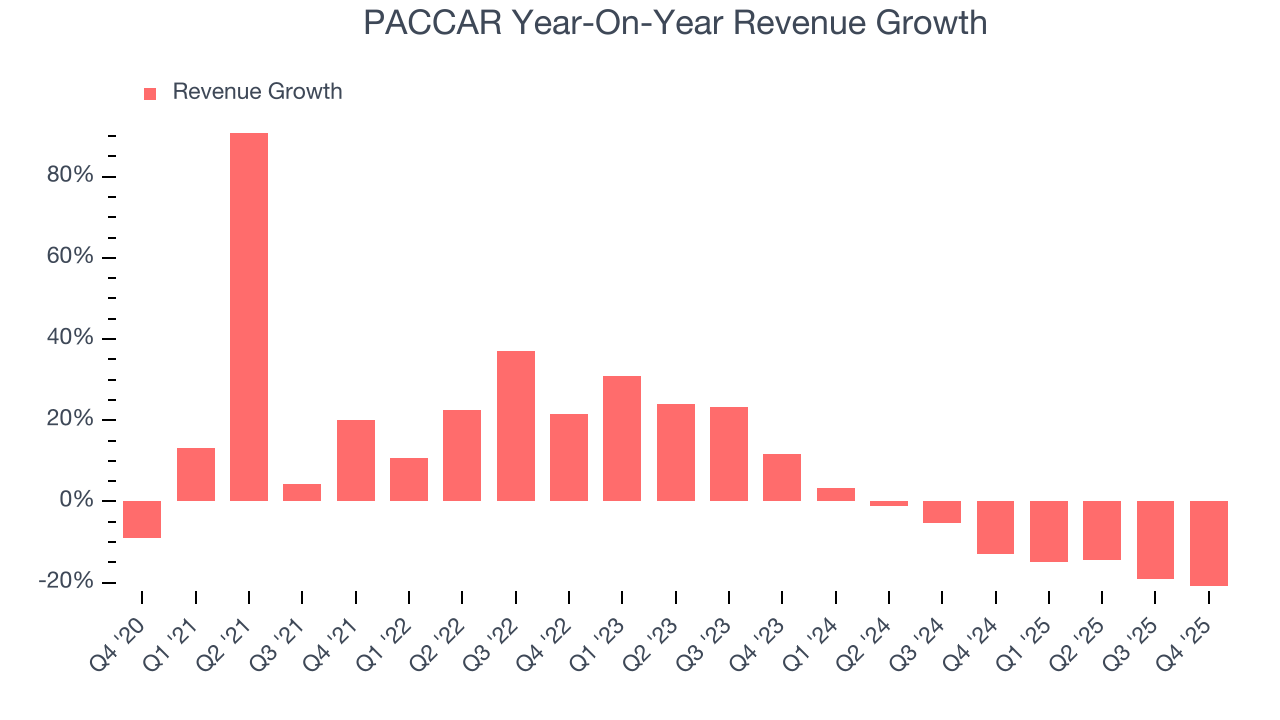
This quarter, PACCAR missed Wall Street’s estimates and reported a rather uninspiring 20.9% year-on-year revenue decline, generating $6.25 billion of revenue.
Looking ahead, sell-side analysts expect revenue to grow 3.3% over the next 12 months. Although this projection implies its newer products and services will catalyze better top-line performance, it is still below the sector average.
6. Gross Margin & Pricing Power
PACCAR has bad unit economics for an industrials business, signaling it operates in a competitive market. As you can see below, it averaged a 16.5% gross margin over the last five years. Said differently, PACCAR had to pay a chunky $83.52 to its suppliers for every $100 in revenue. 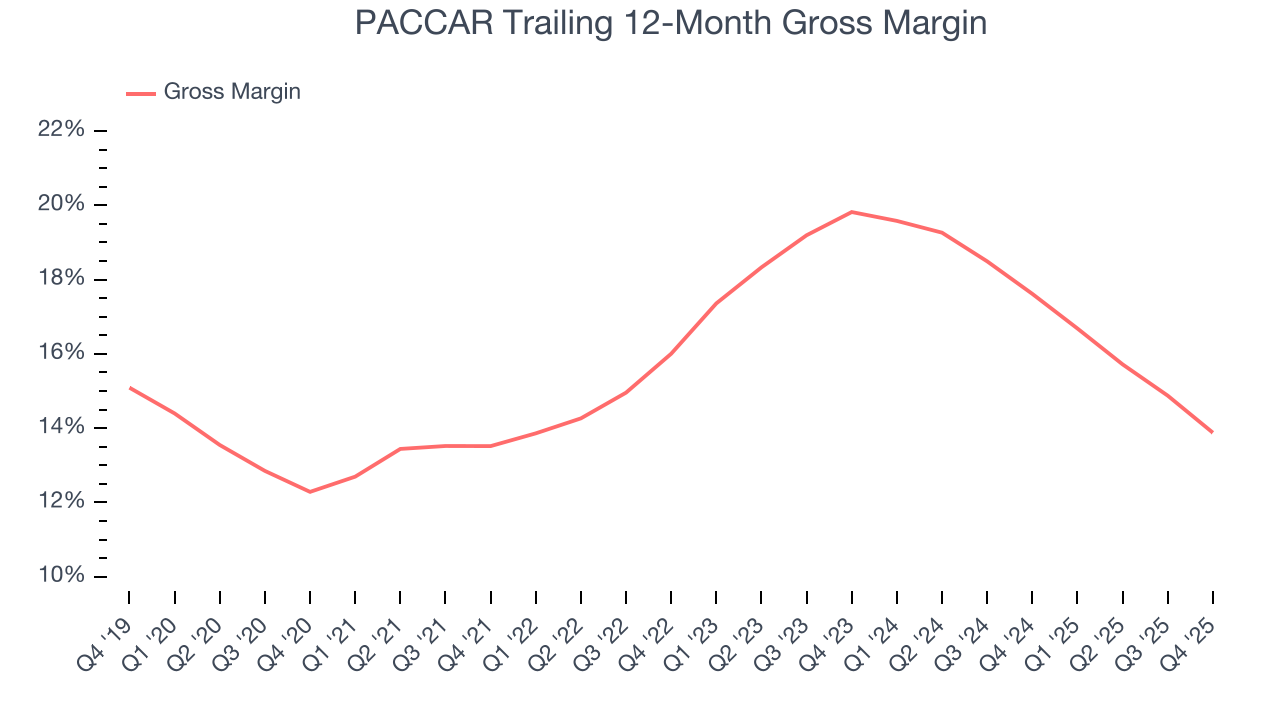
This quarter, PACCAR’s gross profit margin was 12%, down 4.1 percentage points year on year. PACCAR’s full-year margin has also been trending down over the past 12 months, decreasing by 3.7 percentage points. If this move continues, it could suggest a more competitive environment with some pressure to lower prices and higher input costs (such as raw materials and manufacturing expenses).
7. Operating Margin
Operating margin is an important measure of profitability as it shows the portion of revenue left after accounting for all core expenses – everything from the cost of goods sold to advertising and wages. It’s also useful for comparing profitability across companies with different levels of debt and tax rates because it excludes interest and taxes.
PACCAR’s operating margin might fluctuated slightly over the last 12 months but has remained more or less the same, averaging 11.6% over the last five years. This profitability was solid for an industrials business and shows it’s an efficient company that manages its expenses well. This result was particularly impressive because of its low gross margin, which is mostly a factor of what it sells and takes huge shifts to move meaningfully. Companies have more control over their operating margins, and it’s a show of well-managed operations if they’re high when gross margins are low.
Looking at the trend in its profitability, PACCAR’s operating margin might fluctuated slightly but has generally stayed the same over the last five years. This raises questions about the company’s expense base because its revenue growth should have given it leverage on its fixed costs, resulting in better economies of scale and profitability.
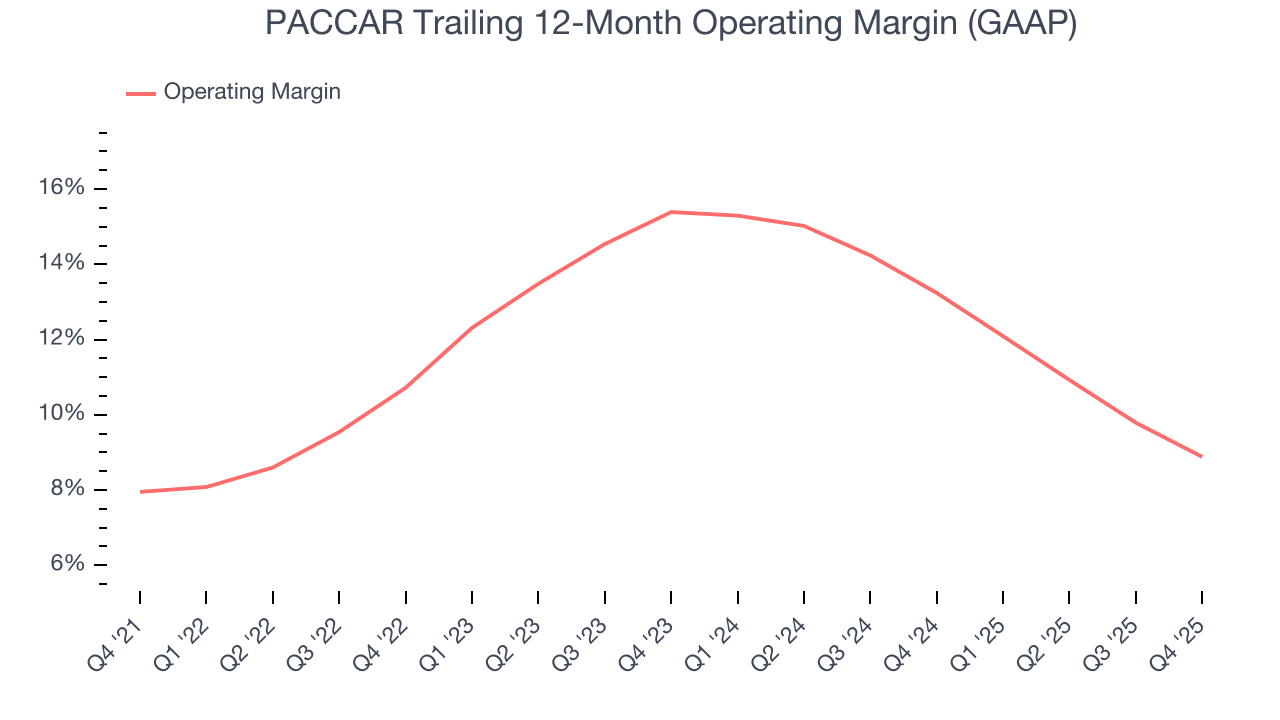
In Q4, PACCAR generated an operating margin profit margin of 7.8%, down 3.6 percentage points year on year. Since PACCAR’s gross margin decreased more than its operating margin, we can assume its recent inefficiencies were driven more by weaker leverage on its cost of sales rather than increased marketing, R&D, and administrative overhead expenses.
8. Earnings Per Share
We track the long-term change in earnings per share (EPS) for the same reason as long-term revenue growth. Compared to revenue, however, EPS highlights whether a company’s growth is profitable.
PACCAR’s EPS grew at a remarkable 12.7% compounded annual growth rate over the last five years, higher than its 8.3% annualized revenue growth. However, we take this with a grain of salt because its operating margin didn’t improve and it didn’t repurchase its shares, meaning the delta came from reduced interest expenses or taxes.
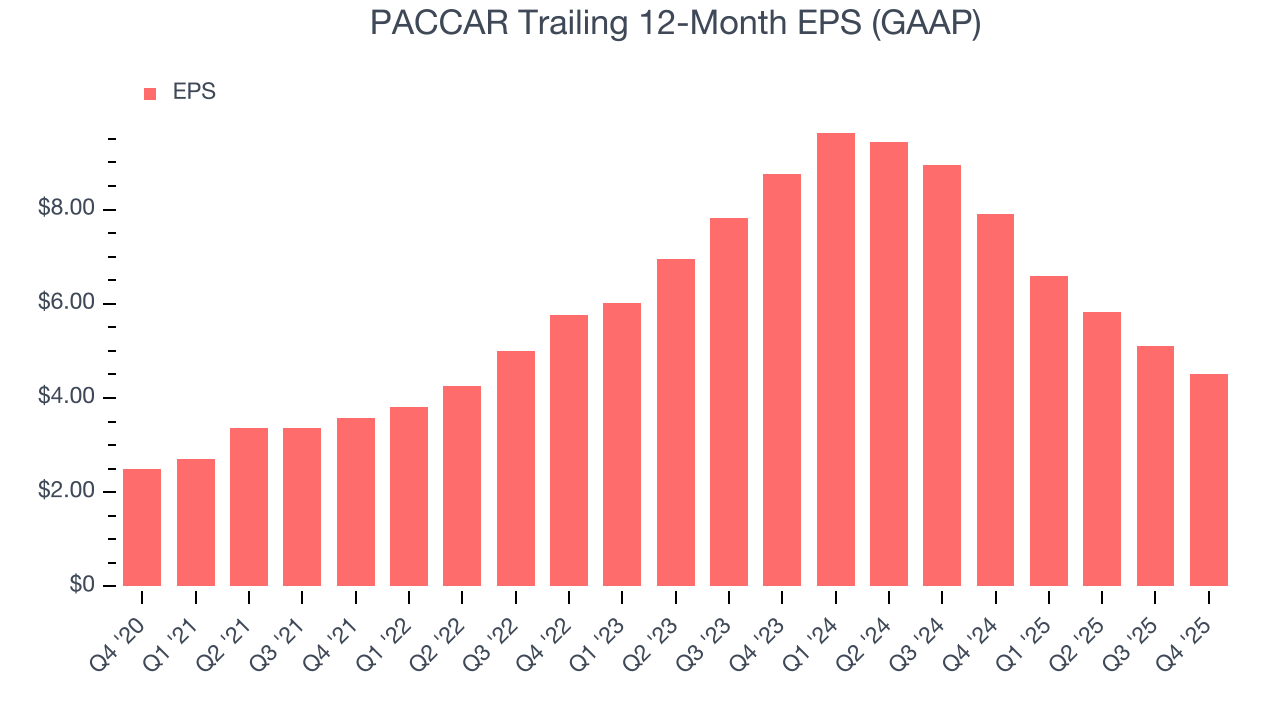
Like with revenue, we analyze EPS over a shorter period to see if we are missing a change in the business.
PACCAR’s two-year annual EPS declines of 28.2% were bad and lower than its two-year revenue losses.
Diving into the nuances of PACCAR’s earnings can give us a better understanding of its performance. PACCAR’s operating margin has declined over the last two years. This was the most relevant factor (aside from the revenue impact) behind its lower earnings; interest expenses and taxes can also affect EPS but don’t tell us as much about a company’s fundamentals.
In Q4, PACCAR reported EPS of $1.06, down from $1.66 in the same quarter last year. This print was close to analysts’ estimates. Over the next 12 months, Wall Street expects PACCAR’s full-year EPS of $4.51 to grow 17.7%.
9. Cash Is King
If you’ve followed StockStory for a while, you know we emphasize free cash flow. Why, you ask? We believe that in the end, cash is king, and you can’t use accounting profits to pay the bills.
PACCAR has shown robust cash profitability, enabling it to comfortably ride out cyclical downturns while investing in plenty of new offerings and returning capital to investors. The company’s free cash flow margin averaged 9.7% over the last five years, quite impressive for an industrials business.
Taking a step back, we can see that PACCAR’s margin expanded by 8.1 percentage points during that time. This is encouraging, and we can see it became a less capital-intensive business because its free cash flow profitability rose while its operating profitability was flat.
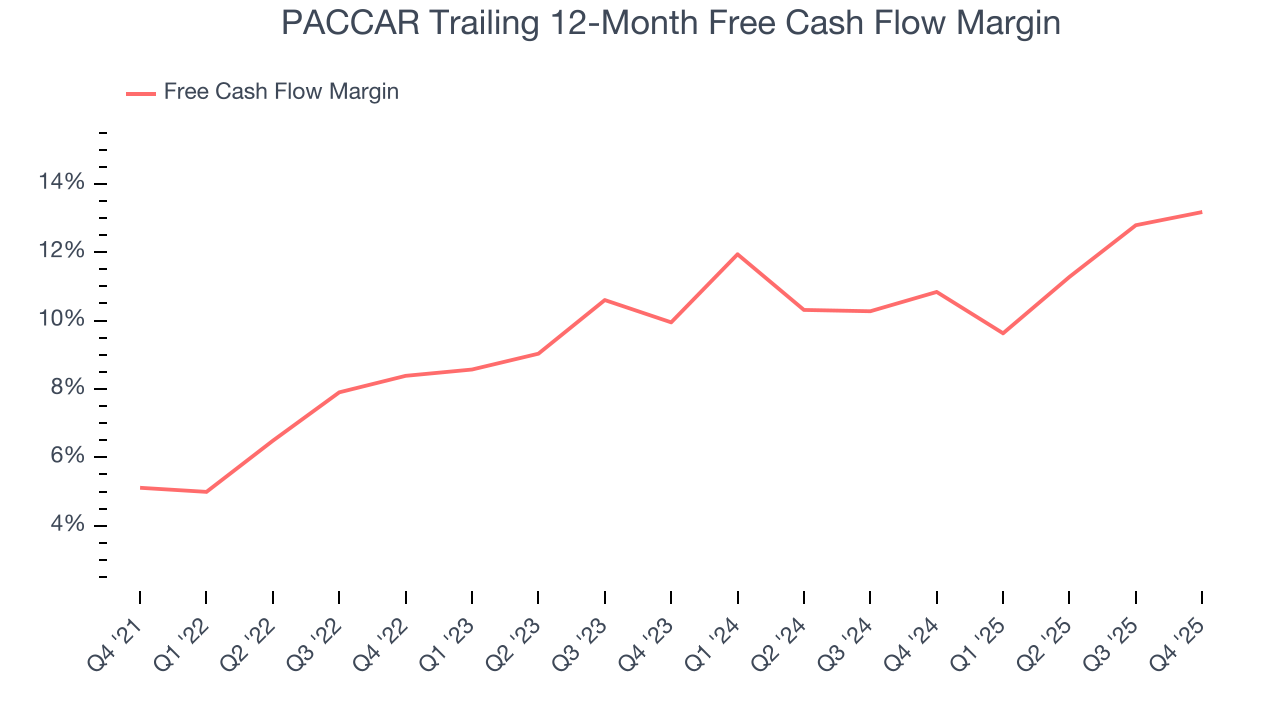
PACCAR’s free cash flow clocked in at $954.4 million in Q4, equivalent to a 15.3% margin. This result was good as its margin was 1.9 percentage points higher than in the same quarter last year, building on its favorable historical trend.
10. Return on Invested Capital (ROIC)
EPS and free cash flow tell us whether a company was profitable while growing its revenue. But was it capital-efficient? Enter ROIC, a metric showing how much operating profit a company generates relative to the money it has raised (debt and equity).
Although PACCAR hasn’t been the highest-quality company lately, it found a few growth initiatives in the past that worked out wonderfully. Its five-year average ROIC was 30.6%, splendid for an industrials business.
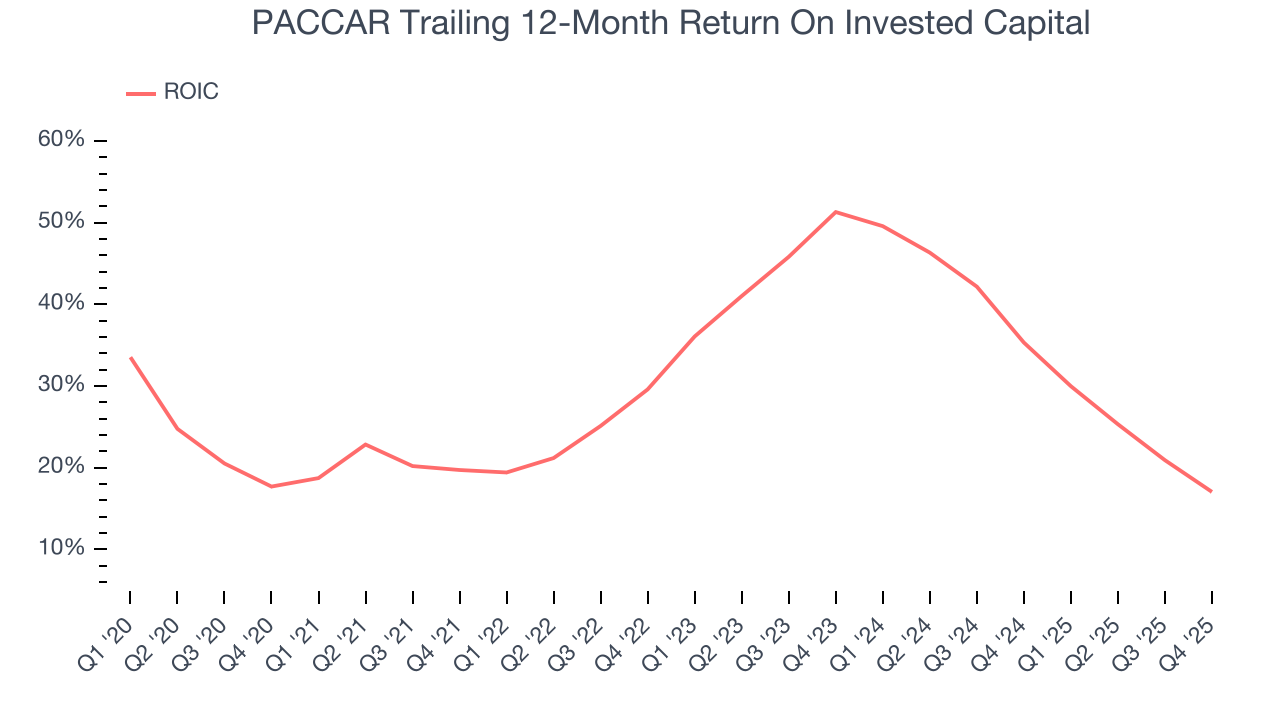
We like to invest in businesses with high returns, but the trend in a company’s ROIC is what often surprises the market and moves the stock price. On average, PACCAR’s ROIC increased by 1.5 percentage points annually over the last few years. This is a good sign, and we hope the company can keep improving.
11. Balance Sheet Assessment
One of the best ways to mitigate bankruptcy risk is to hold more cash than debt.
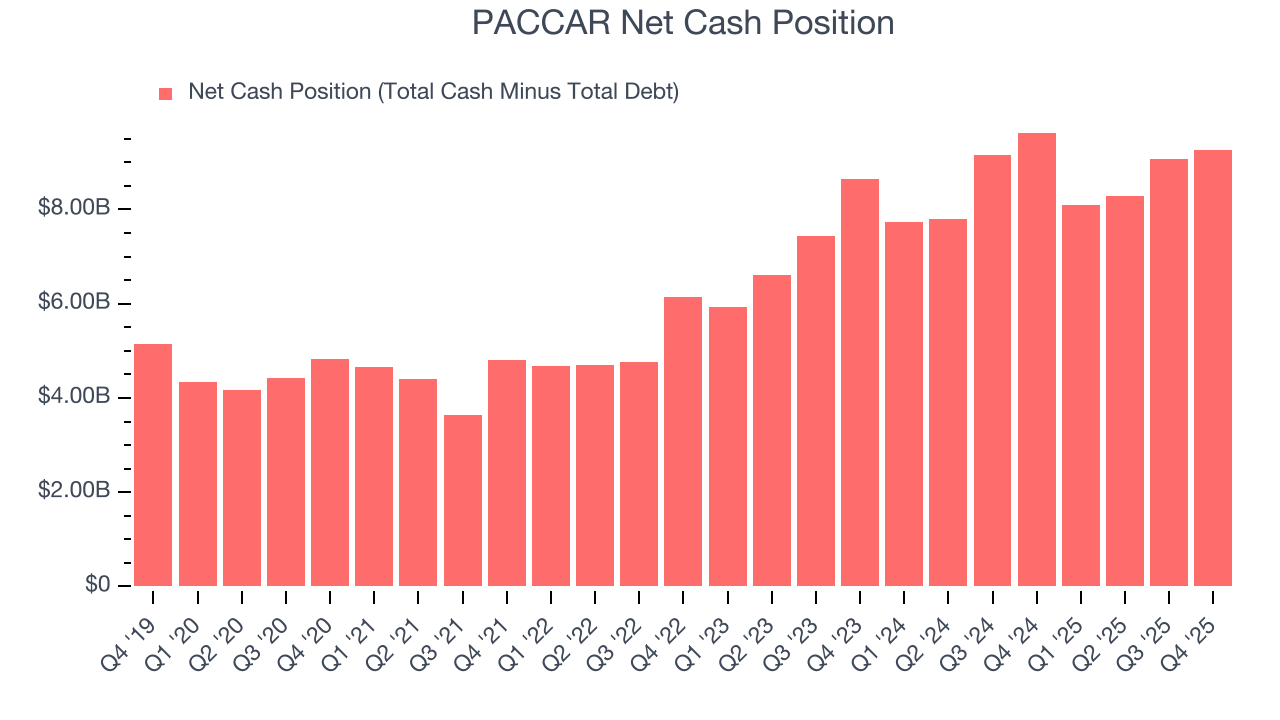
PACCAR is a profitable, well-capitalized company with $9.25 billion of cash and no debt. This position is 14.4% of its market cap and gives it the freedom to borrow money, return capital to shareholders, or invest in growth initiatives. Leverage is not an issue here.
12. Key Takeaways from PACCAR’s Q4 Results
We struggled to find many positives in these results. Its revenue missed and its operating margin fell year on year. Overall, this quarter could have been better. The stock traded down 3% to $118.50 immediately after reporting.
13. Is Now The Time To Buy PACCAR?
Updated: March 8, 2026 at 11:09 PM EDT
Are you wondering whether to buy PACCAR or pass? We urge investors to not only consider the latest earnings results but also longer-term business quality and valuation as well.
PACCAR isn’t a terrible business, but it doesn’t pass our bar. Although its revenue growth was good over the last five years, it’s expected to deteriorate over the next 12 months and its low gross margins indicate some combination of competitive pressures and high production costs.
PACCAR’s P/E ratio based on the next 12 months is 22.2x. Investors with a higher risk tolerance might like the company, but we don’t really see a big opportunity at the moment. We're pretty confident there are superior stocks to buy right now.
Wall Street analysts have a consensus one-year price target of $125.08 on the company (compared to the current share price of $119.46).