
PepsiCo (PEP)
We’re cautious of PepsiCo. Its weak sales growth and declining returns on capital show its demand and profits are shrinking.― StockStory Analyst Team
1. News
2. Summary
Why PepsiCo Is Not Exciting
With a history that goes back more than a century, PepsiCo (NASDAQ:PEP) is a household name in food and beverages today and best known for its flagship soda.
- Organic revenue growth fell short of our benchmarks over the past two years and implies it may need to improve its products, pricing, or go-to-market strategy
- Scale is a double-edged sword because it limits the company’s growth potential compared to its smaller competitors, as reflected in its below-average annual revenue increases of 2.8% for the last three years
- On the plus side, its enormous revenue base of $93.93 billion provides significant negotiating leverage in retail partnerships


PepsiCo doesn’t check our boxes. We see more lucrative opportunities elsewhere.
Why There Are Better Opportunities Than PepsiCo

At $151 per share, PepsiCo trades at 17.4x forward P/E. While valuation is appropriate for the quality you get, we’re still on the sidelines for now.
There are stocks out there featuring similar valuation multiples with better fundamentals. We prefer to invest in those.
3. PepsiCo (PEP) Research Report: Q4 CY2025 Update
Food and beverage company PepsiCo (NASDAQ:PEP) reported Q4 CY2025 results topping the market’s revenue expectations, with sales up 5.6% year on year to $29.34 billion. Its non-GAAP profit of $2.26 per share was 1% above analysts’ consensus estimates.
PepsiCo (PEP) Q4 CY2025 Highlights:
- Revenue: $29.34 billion vs analyst estimates of $28.88 billion (5.6% year-on-year growth, 1.6% beat)
- Adjusted EPS: $2.26 vs analyst estimates of $2.24 (1% beat)
- Adjusted EBITDA: $4.77 billion vs analyst estimates of $5.04 billion (16.3% margin, 5.3% miss)
- Operating Margin: 12.1%, up from 8.1% in the same quarter last year
- Free Cash Flow Margin: 16%, up from 14.3% in the same quarter last year
- Organic Revenue rose 2.1% year on year (beat)
- Sales Volumes fell 2% year on year (-1% in the same quarter last year)
- Market Capitalization: $214.7 billion
Company Overview
With a history that goes back more than a century, PepsiCo (NASDAQ:PEP) is a household name in food and beverages today and best known for its flagship soda.
The company traces its roots to 1893 when a pharmacist from North Carolina named Caleb Bradham concocted a carbonated beverage, initially calling it "Brad's Drink." The soda was later renamed "Pepsi-Cola" because it contained pepsin (a digestive enzyme) and kola nuts. The next major milestone occurred in 1965, when Pepsi-Cola merged with Frito-Lay to create a combined company boasting both drinks and snacks.
Today, PepsiCo offers a diverse range of snacks and beverages through brands such as Lay's, Doritos, Cheetos, Gatorade, Mountain Dew, Tropicana, and Quaker Oats, to name a few. The core customer is therefore extremely broad–everyone from families to athletes to kids and adults alike. The company's products are widely available in grocery stores, supermarkets, convenience stores, restaurants, vending machines, and movie theaters globally. PepsiCo's strong distribution network is a differentiator and ensures that products are both easily accessible and visible in terms of shelf placement.
Pepsi will always be compared to and mentioned in the same breath as competitor Coca-Cola, but the company is iconic and unique in its own right due to its history and powerhouse portfolio of brands.
4. Beverages, Alcohol, and Tobacco
These companies' performance is influenced by brand strength, marketing strategies, and shifts in consumer preferences. Changing consumption patterns are particularly relevant and can be seen in the rise of cannabis, craft beer, and vaping or the steady decline of soda and cigarettes. Companies that spend on innovation to meet consumers where they are with regards to trends can reap huge demand benefits while those who ignore trends can see stagnant volumes. Finally, with the advent of the social media, the cost of starting a brand from scratch is much lower, meaning that new entrants can chip away at the market shares of established players.
Competitors that offer beverages and snacks include Coca-Cola (NYSE:KO), Keurig Dr. Pepper (NASDAQ:KDP), Nestle (SWX:NESN), and Mondelez (NASDAQ:MDLZ).
5. Revenue Growth
Reviewing a company’s long-term sales performance reveals insights into its quality. Any business can experience short-term success, but top-performing ones enjoy sustained growth for years.
With $93.93 billion in revenue over the past 12 months, PepsiCo is one of the most widely recognized consumer staples companies. Its influence over consumers gives it negotiating leverage with distributors, enabling it to pick and choose where it sells its products (a luxury many don’t have). However, its scale is a double-edged sword because it’s harder to find incremental growth when your existing brands have penetrated most of the market. To expand meaningfully, PepsiCo likely needs to tweak its prices, innovate with new products, or enter new markets.
As you can see below, PepsiCo grew its sales at a sluggish 2.8% compounded annual growth rate over the last three years as consumers bought less of its products. We’ll explore what this means in the "Volume Growth" section.
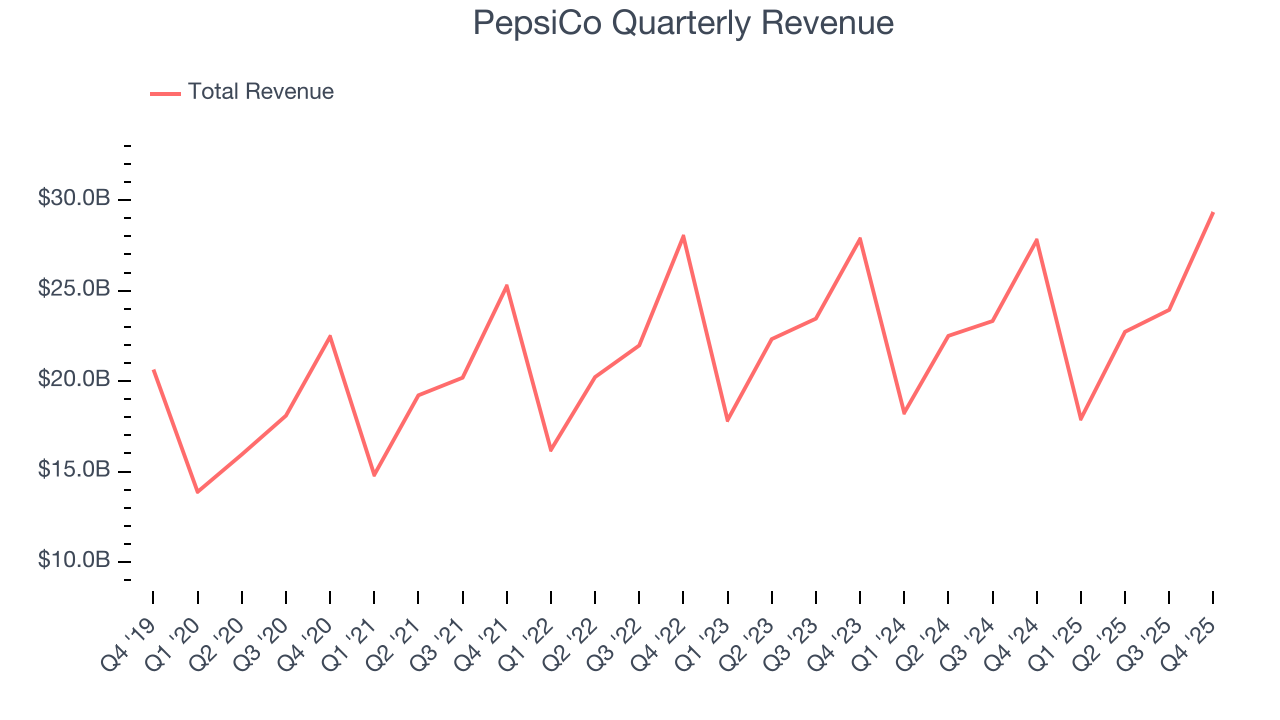
This quarter, PepsiCo reported year-on-year revenue growth of 5.6%, and its $29.34 billion of revenue exceeded Wall Street’s estimates by 1.6%.
Looking ahead, sell-side analysts expect revenue to grow 3.4% over the next 12 months, similar to its three-year rate. This projection is underwhelming and suggests its newer products will not lead to better top-line performance yet.
6. Volume Growth
Revenue growth can be broken down into changes in price and volume (the number of units sold). While both are important, volume is the lifeblood of a successful staples business as there’s a ceiling to what consumers will pay for everyday goods; they can always trade down to non-branded products if the branded versions are too expensive.
To analyze whether PepsiCo generated its growth from changes in price or volume, we can compare its volume growth to its organic revenue growth, which excludes non-fundamental impacts on company financials like mergers and currency fluctuations.
Over the last two years, PepsiCo’s average quarterly sales volumes have shrunk by 2.1%. This decrease isn’t ideal as the quantity demanded for consumer staples products is typically stable. Luckily, PepsiCo was able to offset fewer customers purchasing its products by charging higher prices, enabling it to generate 1.8% average organic revenue growth. We hope the company can grow its volumes soon, however, as consistent price increases (on top of inflation) aren’t sustainable over the long term unless the business is really really special.
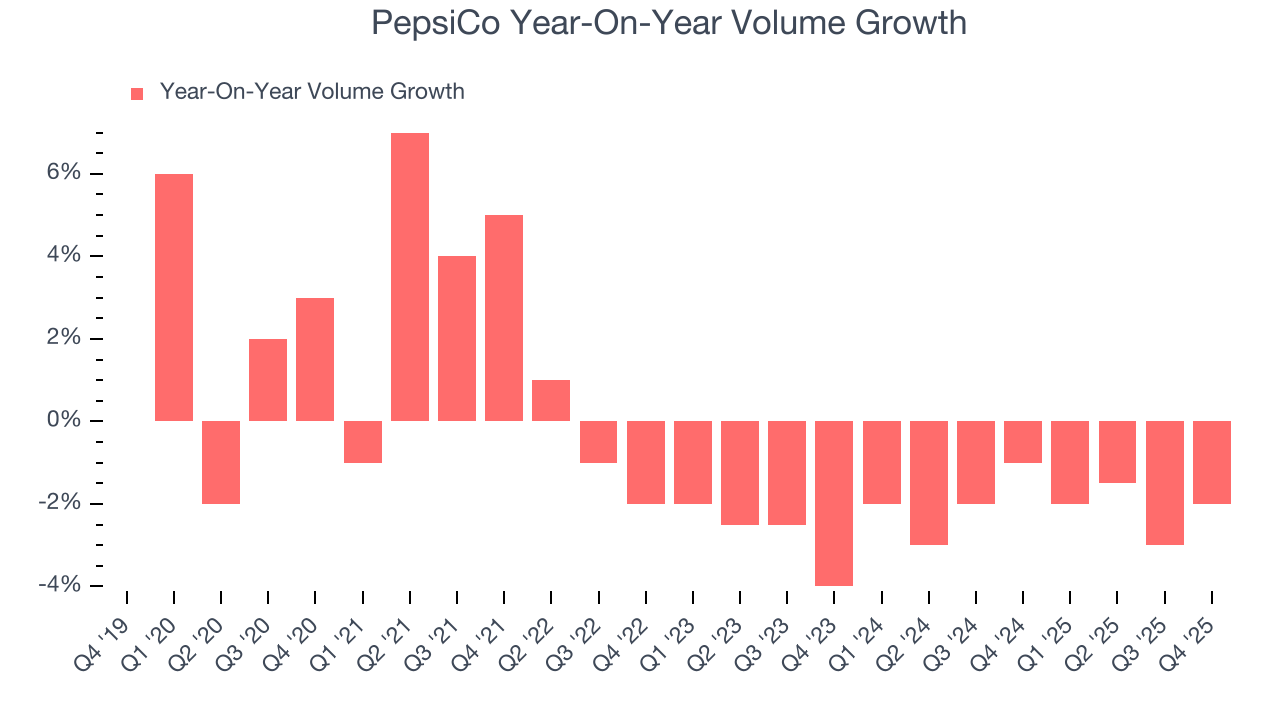
In PepsiCo’s Q4 2025, sales volumes dropped 2% year on year. This result represents a further deceleration from its historical levels, showing the business is struggling to move its products.
7. Gross Margin & Pricing Power
PepsiCo has best-in-class unit economics for a consumer staples company, enabling it to invest in areas such as marketing and talent to grow its brand. As you can see below, it averaged an elite 54.5% gross margin over the last two years. That means PepsiCo only paid its suppliers $45.48 for every $100 in revenue. 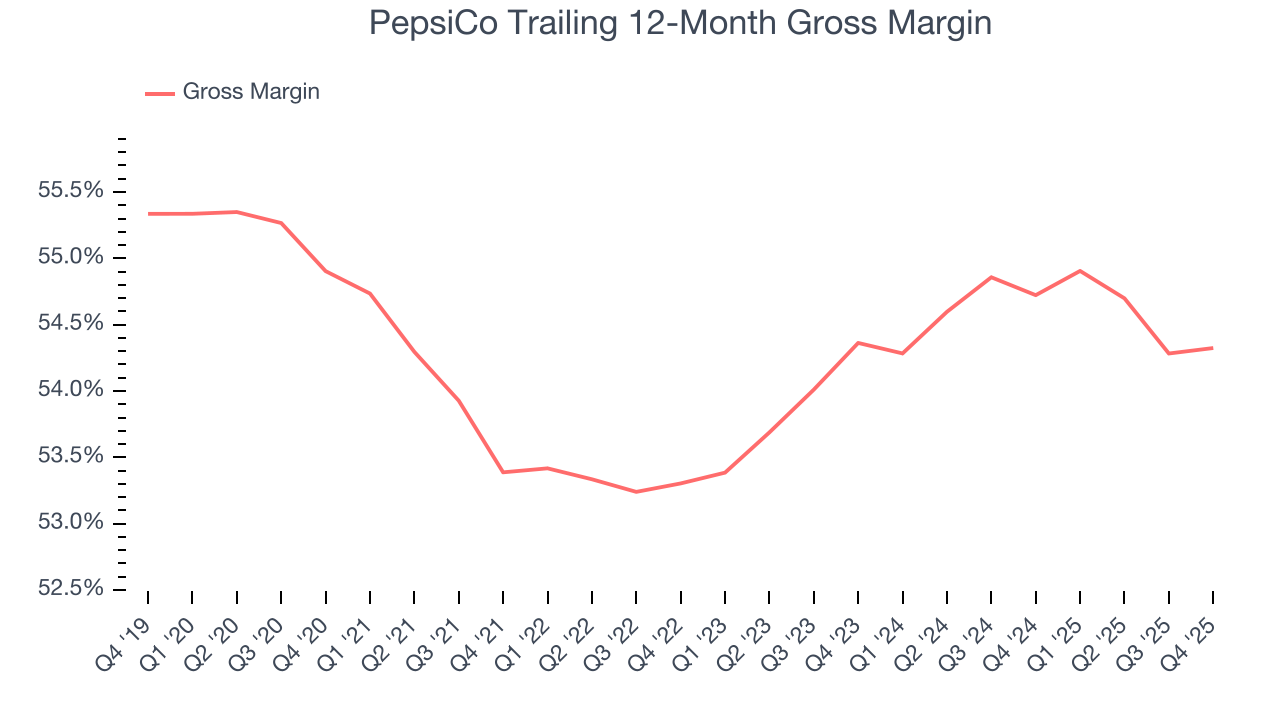
PepsiCo’s gross profit margin came in at 53.2% this quarter, in line with the same quarter last year. On a wider time horizon, the company’s full-year margin has remained steady over the past four quarters, suggesting its input costs (such as raw materials and manufacturing expenses) have been stable and it isn’t under pressure to lower prices.
8. Operating Margin
PepsiCo has managed its cost base well over the last two years. It demonstrated solid profitability for a consumer staples business, producing an average operating margin of 13.1%. This result isn’t surprising as its high gross margin gives it a favorable starting point.
Looking at the trend in its profitability, PepsiCo’s operating margin decreased by 1.8 percentage points over the last year. This raises questions about the company’s expense base because its revenue growth should have given it leverage on its fixed costs, resulting in better economies of scale and profitability.
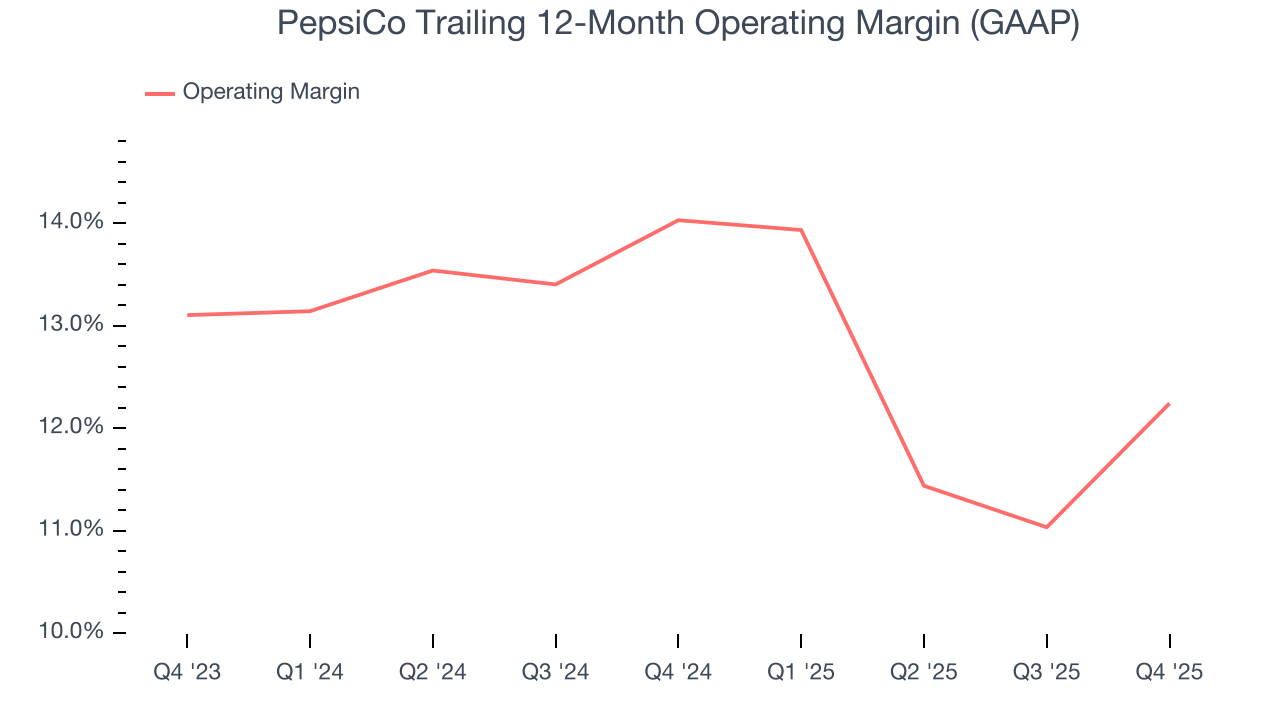
This quarter, PepsiCo generated an operating margin profit margin of 12.1%, up 4 percentage points year on year. The increase was encouraging, and because its operating margin rose more than its gross margin, we can infer it was more efficient with expenses such as marketing, and administrative overhead.
9. Earnings Per Share
Revenue trends explain a company’s historical growth, but the long-term change in earnings per share (EPS) points to the profitability of that growth – for example, a company could inflate its sales through excessive spending on advertising and promotions.
PepsiCo’s EPS grew at a decent 6.3% compounded annual growth rate over the last three years, higher than its 2.8% annualized revenue growth. This tells us the company became more profitable on a per-share basis as it expanded.
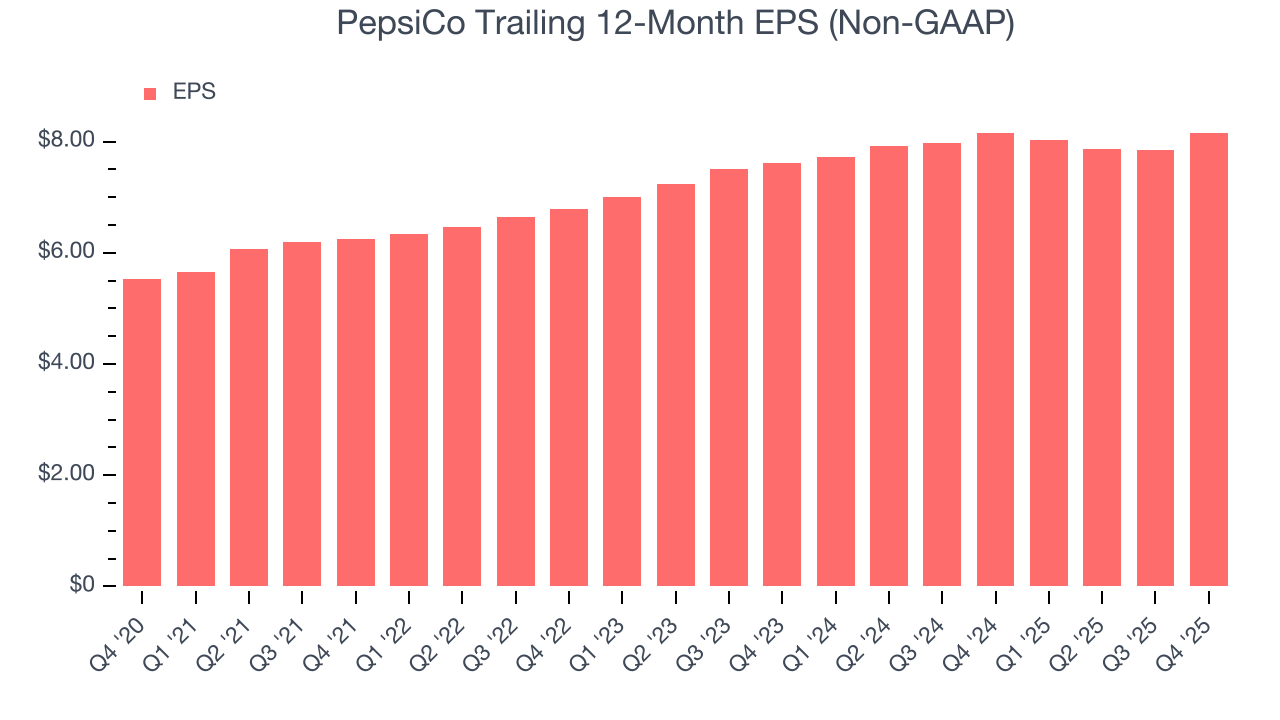
In Q4, PepsiCo reported adjusted EPS of $2.26, up from $1.96 in the same quarter last year. This print beat analysts’ estimates by 1%. Over the next 12 months, Wall Street expects PepsiCo’s full-year EPS of $8.15 to grow 5%.
10. Cash Is King
If you’ve followed StockStory for a while, you know we emphasize free cash flow. Why, you ask? We believe that in the end, cash is king, and you can’t use accounting profits to pay the bills.
PepsiCo has shown impressive cash profitability, driven by its attractive business model that gives it the option to reinvest or return capital to investors. The company’s free cash flow margin averaged 8.3% over the last two years, better than the broader consumer staples sector.
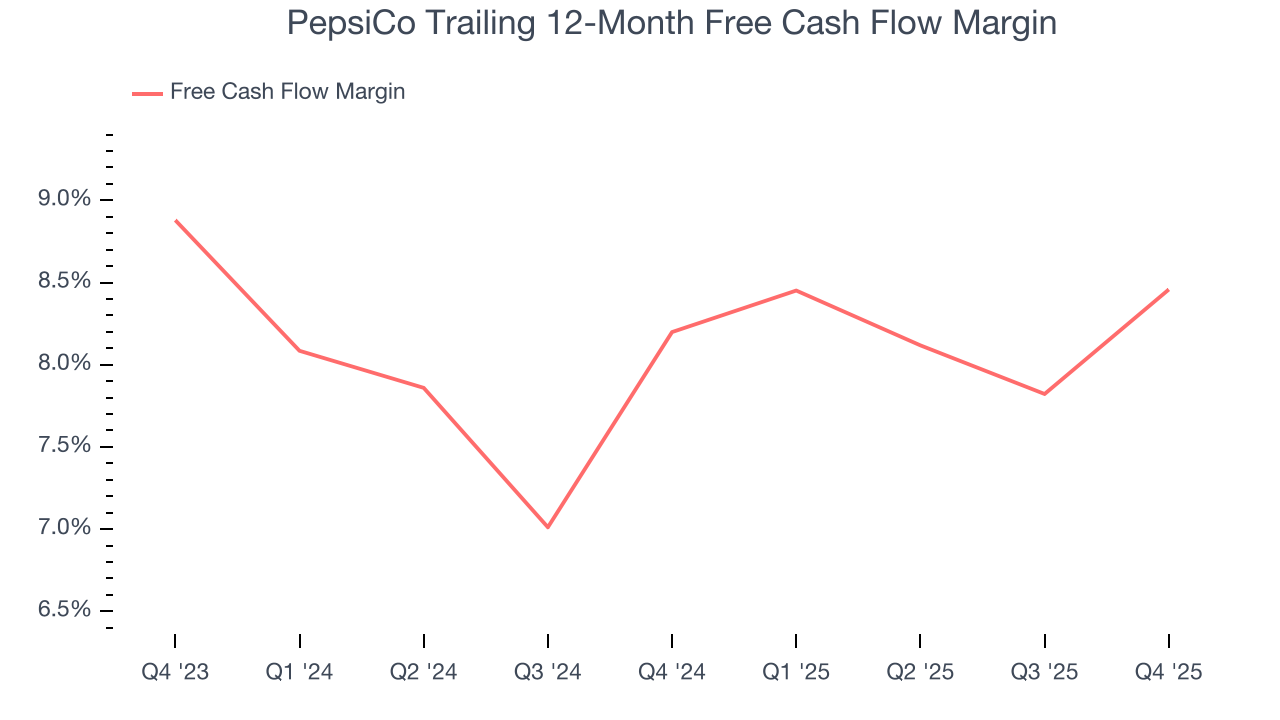
PepsiCo’s free cash flow clocked in at $4.70 billion in Q4, equivalent to a 16% margin. This result was good as its margin was 1.7 percentage points higher than in the same quarter last year, but we wouldn’t put too much weight on the short term because investment needs can be seasonal, causing temporary swings. Long-term trends carry greater meaning.
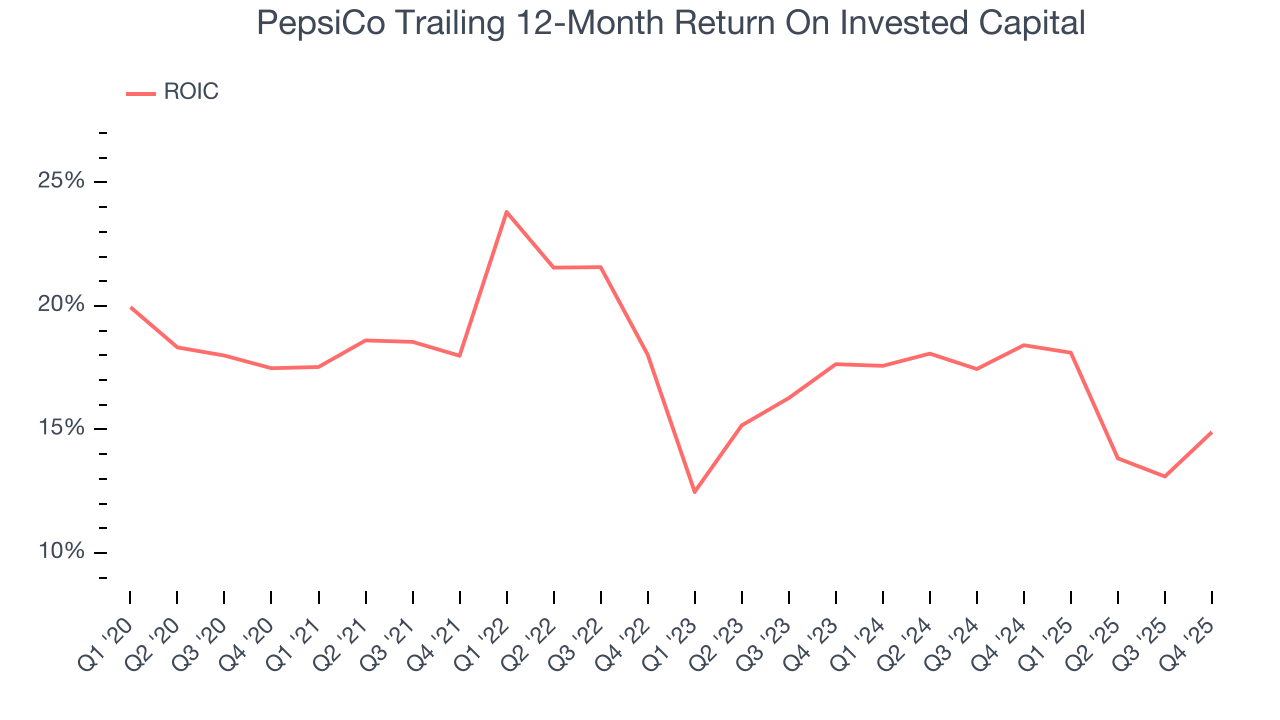
11. Return on Invested Capital (ROIC)
EPS and free cash flow tell us whether a company was profitable while growing its revenue. But was it capital-efficient? A company’s ROIC explains this by showing how much operating profit it makes compared to the money it has raised (debt and equity).
Although PepsiCo hasn’t been the highest-quality company lately because of its poor top-line performance, it historically found a few growth initiatives that worked. Its five-year average ROIC was 17.4%, higher than most consumer staples businesses.
12. Balance Sheet Assessment
PepsiCo reported $9.53 billion of cash and $49.18 billion of debt on its balance sheet in the most recent quarter. As investors in high-quality companies, we primarily focus on two things: 1) that a company’s debt level isn’t too high and 2) that its interest payments are not excessively burdening the business.
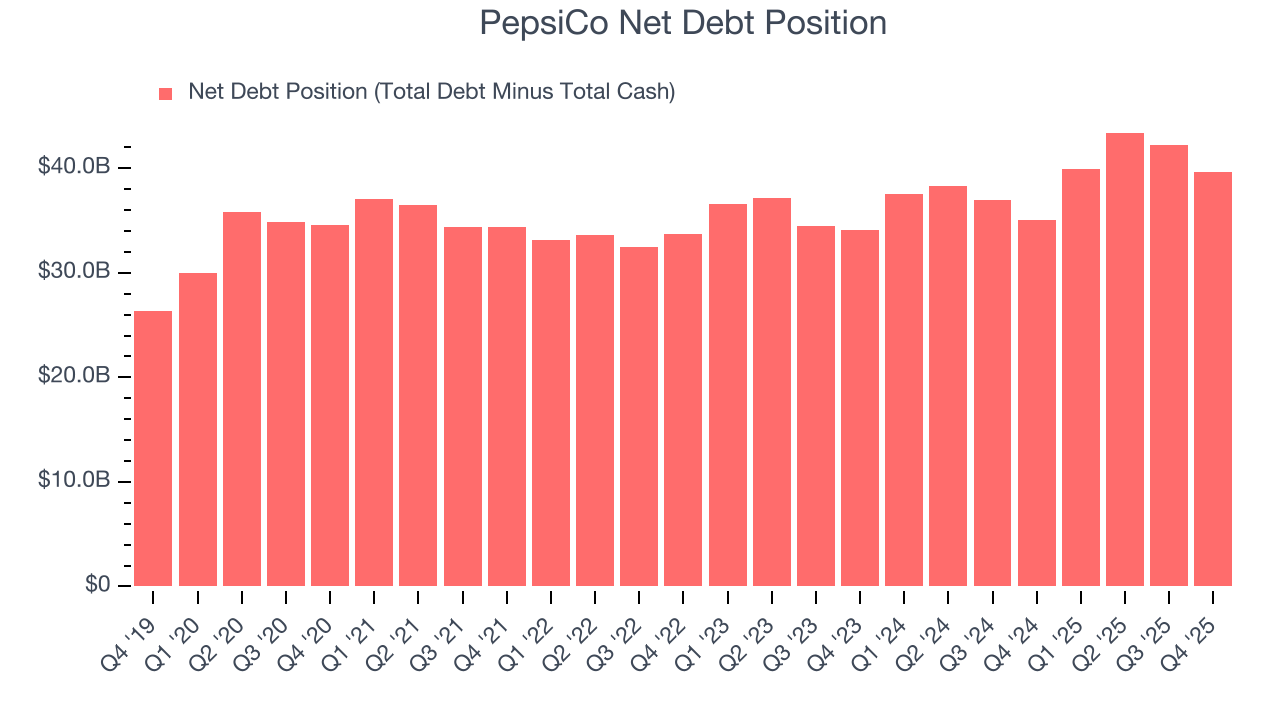
With $17.93 billion of EBITDA over the last 12 months, we view PepsiCo’s 2.2× net-debt-to-EBITDA ratio as safe. We also see its $732.7 million of annual interest expenses as appropriate. The company’s profits give it plenty of breathing room, allowing it to continue investing in growth initiatives.
13. Key Takeaways from PepsiCo’s Q4 Results
It was encouraging to see PepsiCo beat analysts’ revenue expectations this quarter. On the other hand, its EBITDA missed and its gross margin fell slightly short of Wall Street’s estimates. Overall, this was a weaker quarter. The stock remained flat at $153.91 immediately following the results.
14. Is Now The Time To Buy PepsiCo?
Updated: March 23, 2026 at 10:56 PM EDT
A common mistake we notice when investors are deciding whether to buy a stock or not is that they simply look at the latest earnings results. Business quality and valuation matter more, so we urge you to understand these dynamics as well.
PepsiCo isn’t a terrible business, but it doesn’t pass our quality test. First off, its revenue growth was uninspiring over the last three years. While its unparalleled brand awareness makes it a household name consumers consistently turn to, the downside is its shrinking sales volumes suggest it’ll need to change its strategy to succeed. On top of that, its projected EPS for the next year is lacking.
PepsiCo’s P/E ratio based on the next 12 months is 17.4x. While this valuation is reasonable, we don’t really see a big opportunity at the moment. We're pretty confident there are superior stocks to buy right now.
Wall Street analysts have a consensus one-year price target of $171.38 on the company (compared to the current share price of $151).