
Paramount (PSKY)
Paramount faces an uphill battle. Its sales have underperformed and its low returns on capital show it has few growth opportunities.― StockStory Analyst Team
1. News
2. Summary
Why We Think Paramount Will Underperform
Owner of Spongebob Squarepants and formerly known as ViacomCBS, Paramount Global (NASDAQ:PSKY) is a major media conglomerate offering television, film production, and digital content across various global platforms.
- Large revenue base makes it harder to increase sales quickly, and its annual revenue growth of 2.7% over the last five years was below our standards for the consumer discretionary sector
- Performance over the past five years shows its incremental sales were much less profitable, as its earnings per share fell by 34.8% annually
- Persistent operating margin losses suggest the business manages its expenses poorly


Paramount doesn’t fulfill our quality requirements. We see more lucrative opportunities elsewhere.
Why There Are Better Opportunities Than Paramount


Paramount’s stock price of $9.77 implies a valuation ratio of 12.5x forward P/E. Paramount’s multiple may seem like a great deal among consumer discretionary peers, but we think there are valid reasons why it’s this cheap.
Cheap stocks can look like a great deal at first glance, but they can be value traps. They often have less earnings power, meaning there is more reliance on a re-rating to generate good returns - an unlikely scenario for low-quality companies.
3. Paramount (PSKY) Research Report: Q4 CY2025 Update
Multinational media and entertainment corporation Paramount (NASDAQ:PSKY) met Wall Street’s revenue expectations in Q4 CY2025, but sales fell by 5.1% year on year to $8.15 billion. On the other hand, next quarter’s revenue guidance of $7.25 billion was less impressive, coming in 2.3% below analysts’ estimates. Its non-GAAP loss of $0.12 per share was significantly below analysts’ consensus estimates.
Paramount (PSKY) Q4 CY2025 Highlights:
- Revenue: $8.15 billion vs analyst estimates of $8.14 billion (5.1% year-on-year decline, in line)
- Adjusted EPS: -$0.12 vs analyst estimates of -$0.01 (significant miss)
- Adjusted EBITDA: $612 million vs analyst estimates of $564 million (7.5% margin, 8.5% beat)
- Revenue Guidance for Q1 CY2026 is $7.25 billion at the midpoint, below analyst estimates of $7.42 billion
- EBITDA guidance for the upcoming financial year 2026 is $3.8 billion at the midpoint, above analyst estimates of $3.51 billion
- Operating Margin: -4.2%, down from 1.5% in the same quarter last year
- Free Cash Flow Margin: 1.2%, similar to the same quarter last year
- Market Capitalization: $13.24 billion
Company Overview
Owner of Spongebob Squarepants and formerly known as ViacomCBS, Paramount Global (NASDAQ:PSKY) is a major media conglomerate offering television, film production, and digital content across various global platforms.
Paramount was born through the 2019 merger of Viacom and CBS, which brought together two industry giants to create a diversified media conglomerate. This strategic move was aimed at enhancing their capabilities in cable networks, film studios, and broadcast television, positioning them to compete effectively in the evolving entertainment market.
Paramount delivers a broad spectrum of services, including television and film production, cable network operations, and digital streaming services. Its multi-platform approach ensures versatility and widespread reach in the media landscape.
The company generates revenue from advertising, subscription fees, content licensing, and theatrical releases. Paramount's extensive content portfolio, including popular networks such as CBS and film franchises like Star Trek, appeals to a broad audience, making it a relevant player in the media and entertainment industry.
4. Consumer Discretionary - Broadcasting
The Consumer Discretionary sector, by definition, is made up of companies selling non-essential goods and services. When economic conditions deteriorate or tastes shift, consumers can easily cut back or eliminate these purchases. For long-term investors with five-year holding periods, this creates a structural challenge: the sector is inherently hit-driven, with low switching costs and fickle customers. As a result, only a handful of companies can reliably grow demand and compound earnings over long periods, which is why our bar is high and High Quality ratings are rare.
Broadcasting companies produce and distribute television and radio content, generating revenue primarily through advertising and, in some cases, retransmission fees (payments cable and satellite operators make to carry local channels). Tailwinds include resilient demand for live sports and event programming, which commands premium ad rates, and political advertising during election cycles. Headwinds, however, are substantial: secular cord-cutting (consumers canceling traditional pay-TV subscriptions) is shrinking linear audiences, digital platforms are capturing an increasing share of advertising budgets, and content production costs continue to rise. Regulatory scrutiny over media consolidation and spectrum ownership further constrains strategic flexibility.
Competitors in the media and entertainment production industry include Disney (NYSE:DIS), Warner Bros. Discovery (NASDAQ:WBD), and Comcast (NASDAQ:CMCSA).
5. Revenue Growth
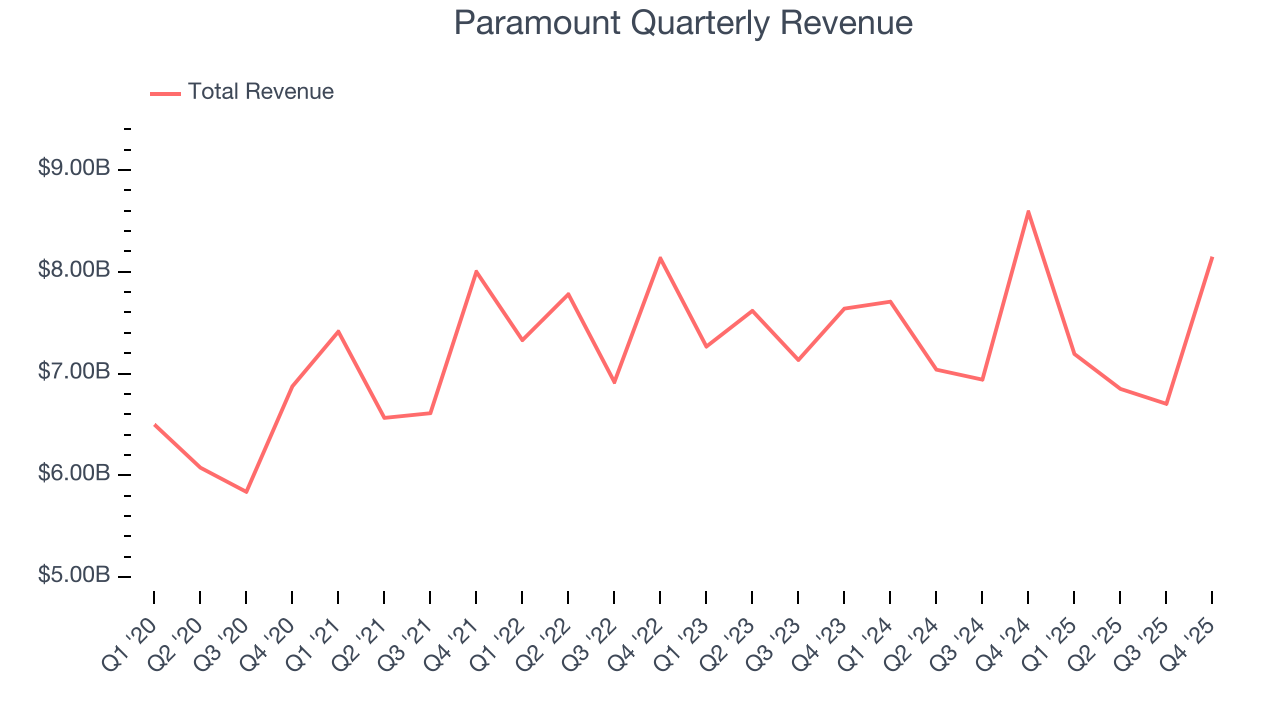
A company’s long-term performance is an indicator of its overall quality. Any business can put up a good quarter or two, but many enduring ones grow for years. Regrettably, Paramount’s sales grew at a weak 2.7% compounded annual growth rate over the last five years. This fell short of our benchmarks and is a poor baseline for our analysis.
We at StockStory place the most emphasis on long-term growth, but within consumer discretionary, a stretched historical view may miss a company riding a successful new product or trend. Paramount’s performance shows it grew in the past but relinquished its gains over the last two years, as its revenue fell by 1.3% annually. 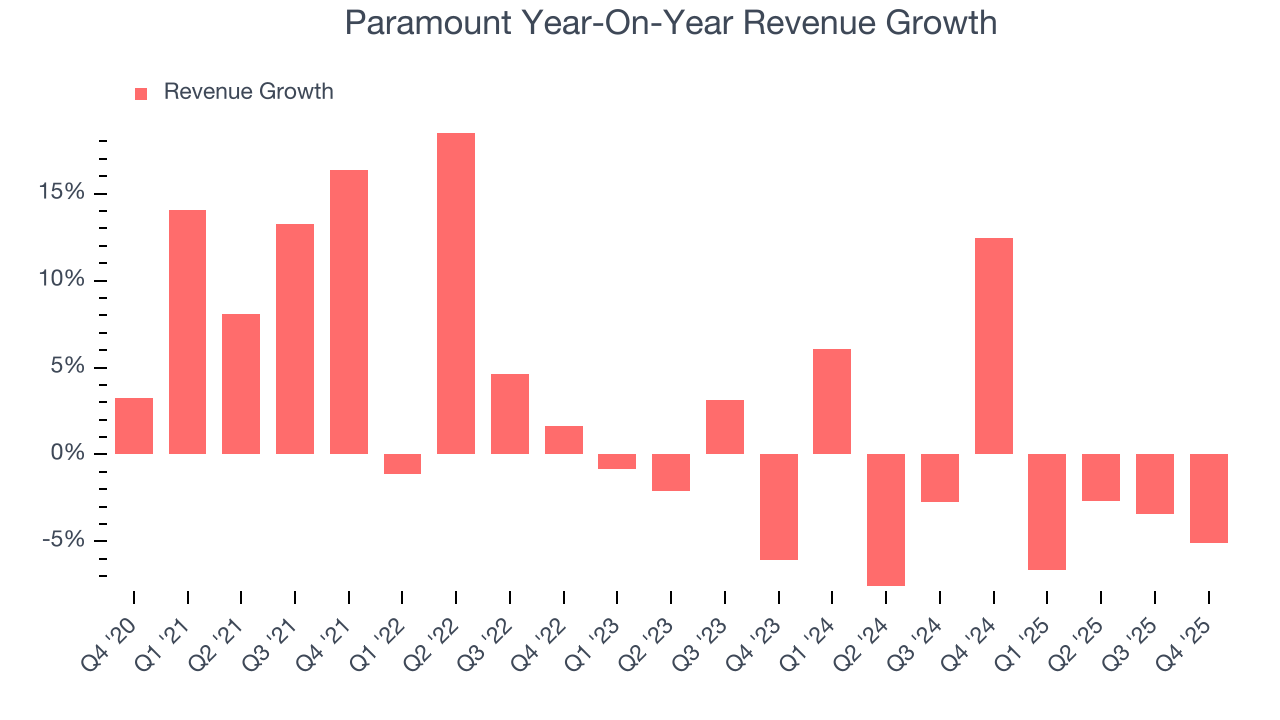
Paramount also breaks out the revenue for its three most important segments: TV Media, Direct-to-Consumer, and Filmed Entertainment, which are 57.9%, 27.2%, and 15.4% of revenue. Over the last two years, Paramount’s TV Media revenue (broadcasting) averaged 7.1% year-on-year declines, but its Direct-to-Consumer (streaming) and Filmed Entertainment (movies) revenues averaged 10.3% and 22.1% growth. 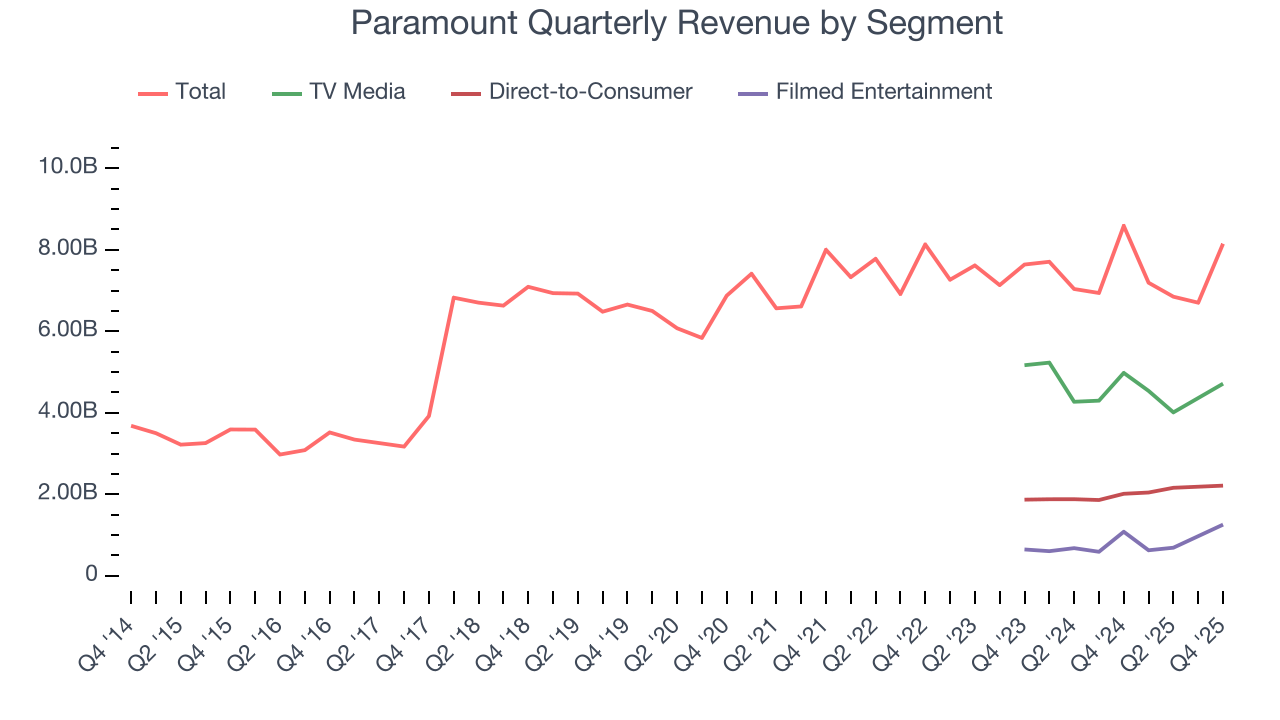
This quarter, Paramount reported a rather uninspiring 5.1% year-on-year revenue decline to $8.15 billion of revenue, in line with Wall Street’s estimates. Company management is currently guiding for flat sales next quarter.
Looking further ahead, sell-side analysts expect revenue to grow 3.7% over the next 12 months. Although this projection suggests its newer products and services will catalyze better top-line performance, it is still below the sector average.
6. Operating Margin
Operating margin is an important measure of profitability as it shows the portion of revenue left after accounting for all core expenses – everything from the cost of goods sold to advertising and wages. It’s also useful for comparing profitability across companies with different levels of debt and tax rates because it excludes interest and taxes.
Paramount’s operating margin has been trending up over the last 12 months, but it still averaged negative 7.3% over the last two years. This is due to its large expense base and inefficient cost structure.
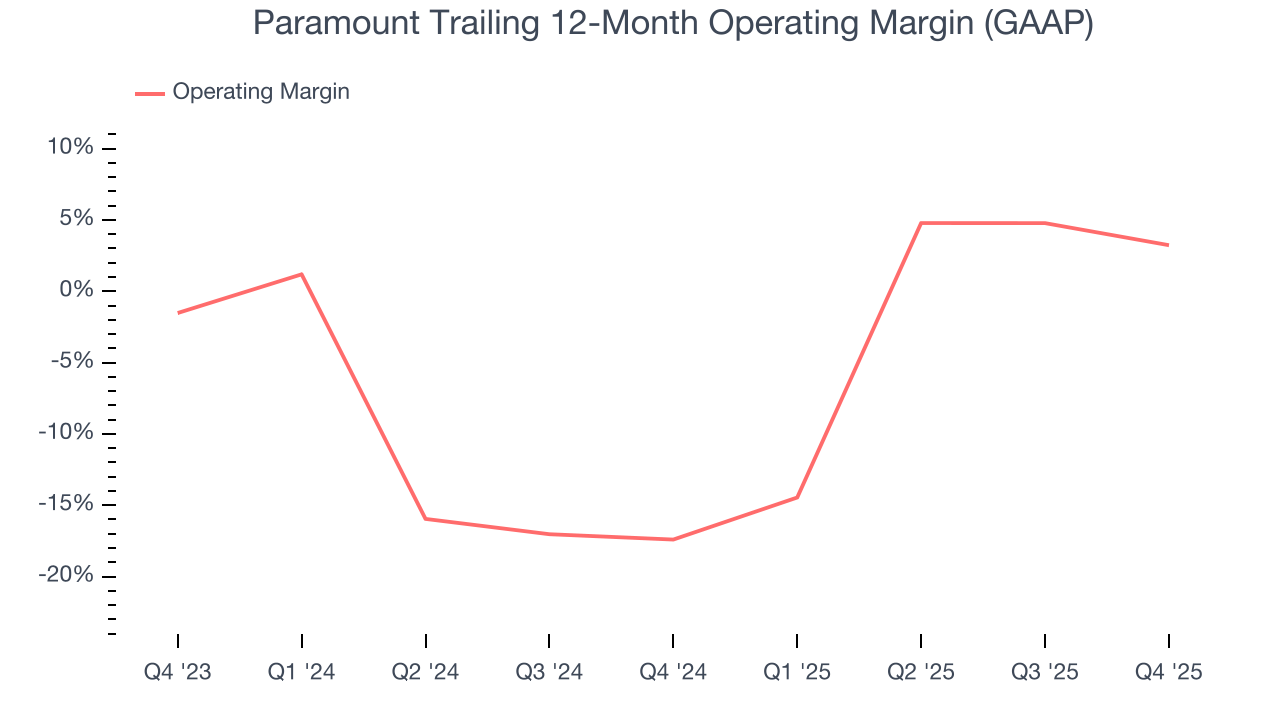
Paramount’s operating margin was negative 4.2% this quarter. The company's consistent lack of profits raise a flag.
7. Earnings Per Share
We track the long-term change in earnings per share (EPS) for the same reason as long-term revenue growth. Compared to revenue, however, EPS highlights whether a company’s growth is profitable.
Sadly for Paramount, its EPS declined by 34.8% annually over the last five years while its revenue grew by 2.7%. This tells us the company became less profitable on a per-share basis as it expanded.
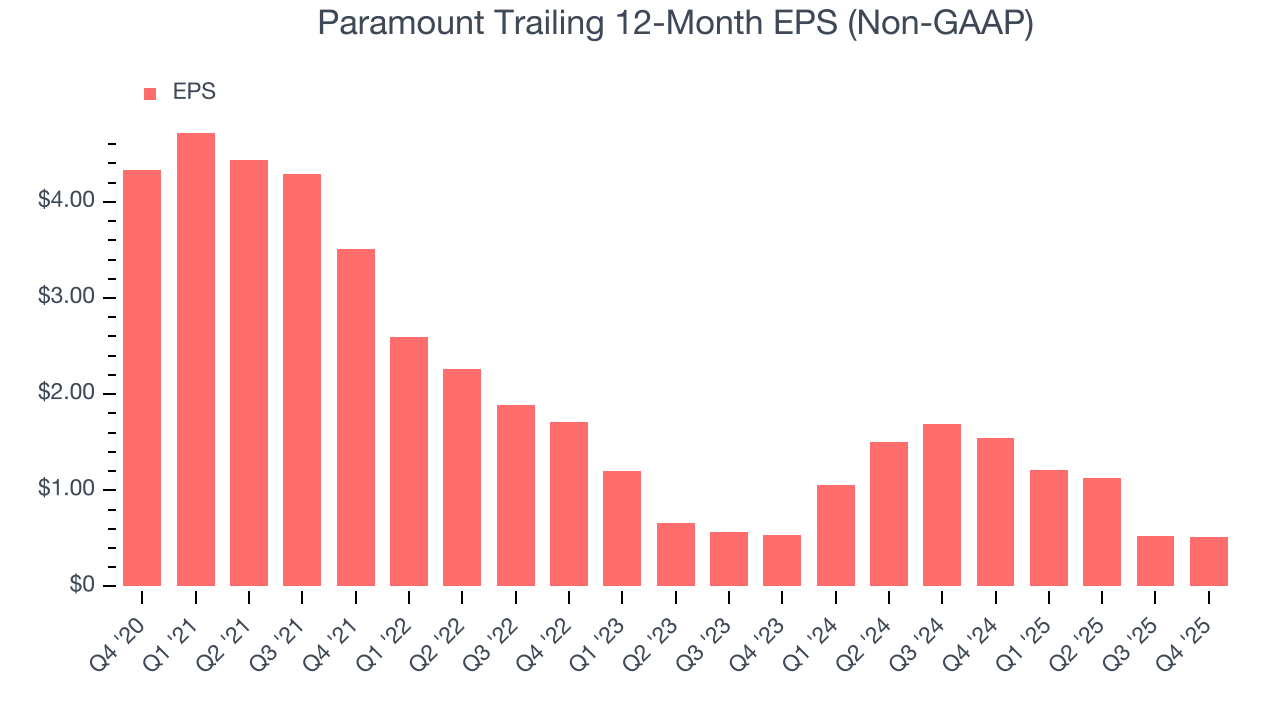
In Q4, Paramount reported adjusted EPS of negative $0.12, down from negative $0.11 in the same quarter last year. This print missed analysts’ estimates. Over the next 12 months, Wall Street expects Paramount’s full-year EPS of $0.51 to grow 55.3%.
8. Cash Is King
If you’ve followed StockStory for a while, you know we emphasize free cash flow. Why, you ask? We believe that in the end, cash is king, and you can’t use accounting profits to pay the bills.
Paramount has shown poor cash profitability relative to peers over the last two years, giving the company fewer opportunities to return capital to shareholders. Its free cash flow margin averaged 1.4%, below what we’d expect for a consumer discretionary business.
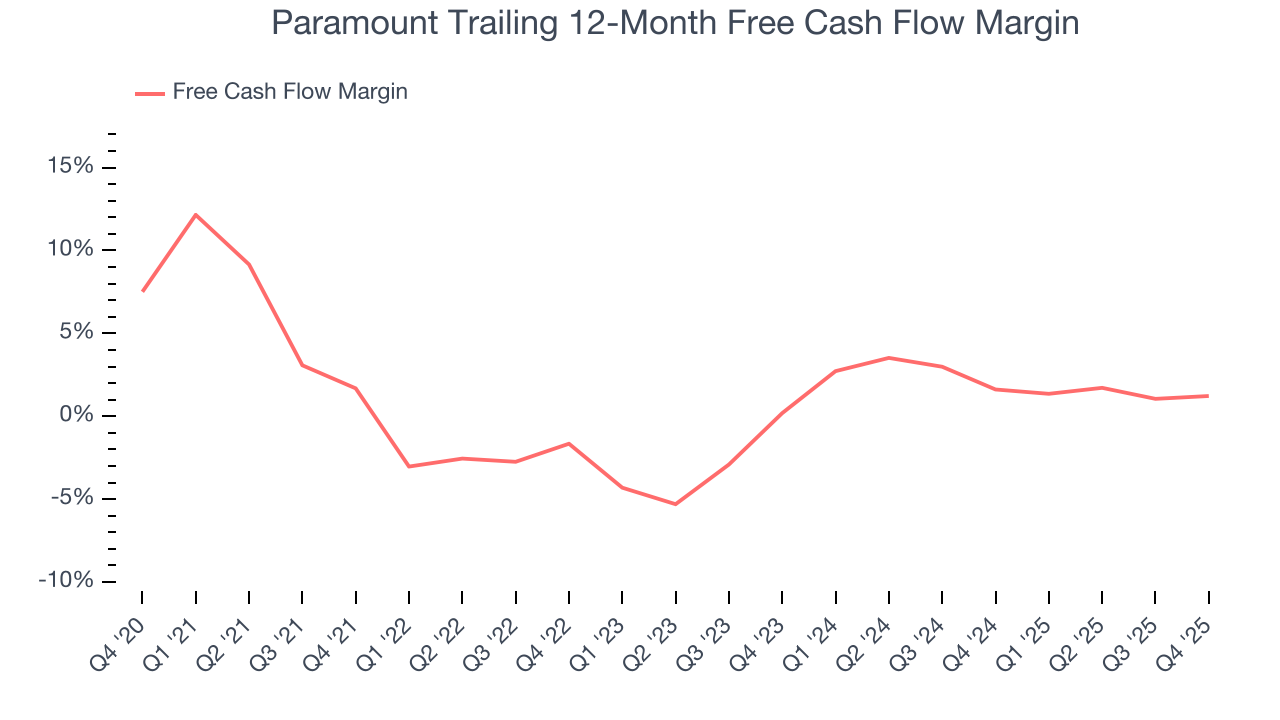
Paramount’s free cash flow clocked in at $101 million in Q4, equivalent to a 1.2% margin. This cash profitability was in line with the comparable period last year and its two-year average.
Over the next year, analysts predict Paramount’s cash conversion will fall to break even. Their consensus estimates imply its free cash flow margin of 1.2% for the last 12 months will decrease by 2.7 percentage points.
9. Return on Invested Capital (ROIC)
EPS and free cash flow tell us whether a company was profitable while growing its revenue. But was it capital-efficient? A company’s ROIC explains this by showing how much operating profit it makes compared to the money it has raised (debt and equity).
Paramount historically did a mediocre job investing in profitable growth initiatives. Its five-year average ROIC was 1%, lower than the typical cost of capital (how much it costs to raise money) for consumer discretionary companies.
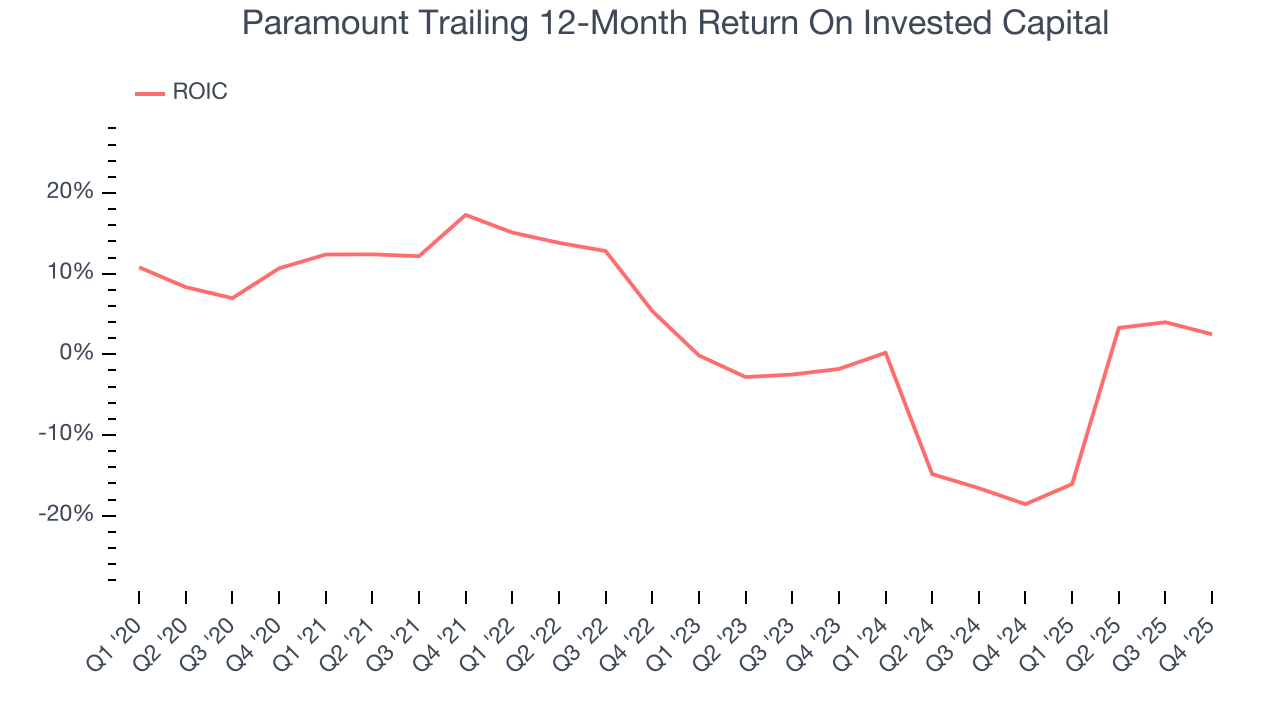
We like to invest in businesses with high returns, but the trend in a company’s ROIC is what often surprises the market and moves the stock price. Over the last few years, Paramount’s ROIC has unfortunately decreased significantly. Paired with its already low returns, these declines suggest its profitable growth opportunities are few and far between.
10. Balance Sheet Assessment
Paramount reported $3.27 billion of cash and $14.81 billion of debt on its balance sheet in the most recent quarter. As investors in high-quality companies, we primarily focus on two things: 1) that a company’s debt level isn’t too high and 2) that its interest payments are not excessively burdening the business.
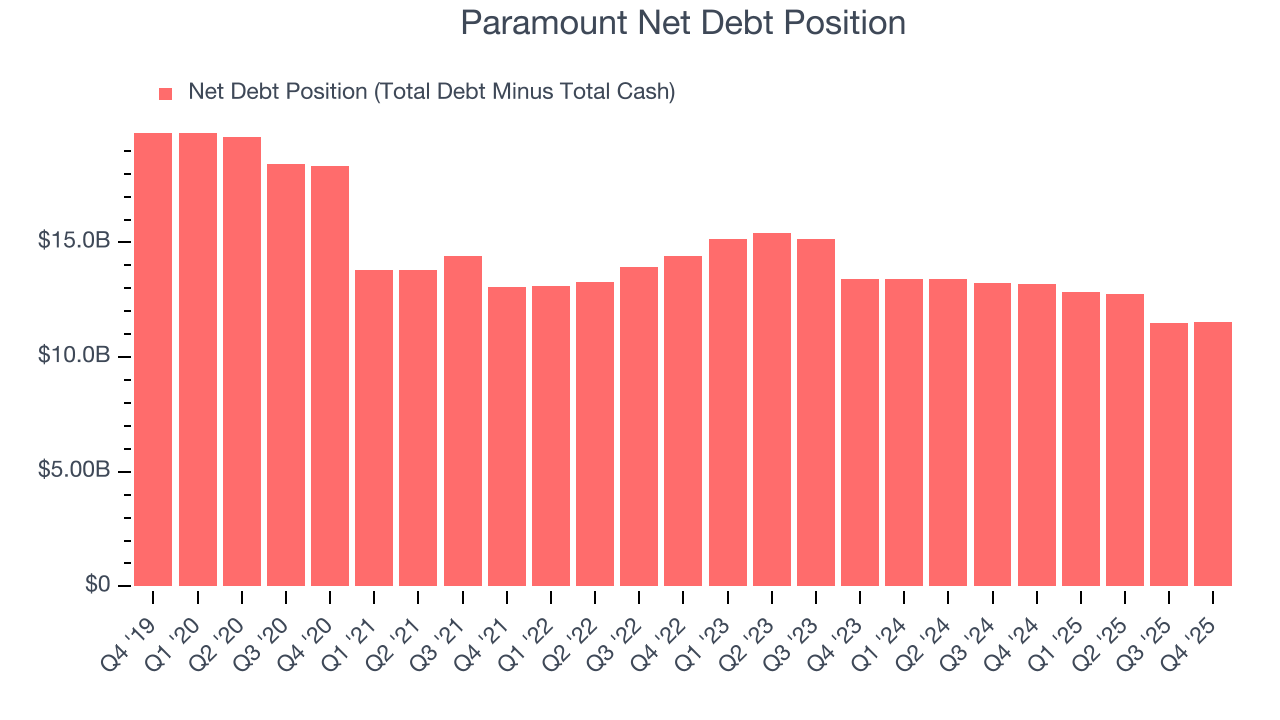
With $3.08 billion of EBITDA over the last 12 months, we view Paramount’s 3.7× net-debt-to-EBITDA ratio as safe. We also see its $735 million of annual interest expenses as appropriate. The company’s profits give it plenty of breathing room, allowing it to continue investing in growth initiatives.
11. Key Takeaways from Paramount’s Q4 Results
We were impressed by how significantly Paramount blew past analysts’ adjusted operating income expectations this quarter. We were also glad its full-year EBITDA guidance exceeded Wall Street’s estimates. On the other hand, its EPS missed and its revenue guidance for next quarter fell short of Wall Street’s estimates. Overall, this print was mixed but still had some key positives. The stock remained flat at $11.74 immediately after reporting.
12. Is Now The Time To Buy Paramount?
Updated: March 14, 2026 at 10:56 PM EDT
Before investing in or passing on Paramount, we urge you to understand the company’s business quality (or lack thereof), valuation, and the latest quarterly results - in that order.
Paramount falls short of our quality standards. While its projected EPS for the next year implies the company’s fundamentals will improve, the downside is its Forecasted free cash flow margin suggests the company will ramp up its investments next year. On top of that, its declining EPS over the last five years makes it a less attractive asset to the public markets.
Paramount’s P/E ratio based on the next 12 months is 12.5x. This valuation multiple is fair, but we don’t have much confidence in the company. There are better investments elsewhere.
Wall Street analysts have a consensus one-year price target of $13.07 on the company (compared to the current share price of $9.77).
Although the price target is bullish, readers should exercise caution because analysts tend to be overly optimistic. The firms they work for, often big banks, have relationships with companies that extend into fundraising, M&A advisory, and other rewarding business lines. As a result, they typically hesitate to say bad things for fear they will lose out. We at StockStory do not suffer from such conflicts of interest, so we’ll always tell it like it is.