
E.W. Scripps (SSP)
E.W. Scripps keeps us up at night. Its sales have underperformed and its low returns on capital show it has few growth opportunities.― StockStory Analyst Team
1. News
2. Summary
Why We Think E.W. Scripps Will Underperform
Founded as a chain of daily newspapers, E.W. Scripps (NASDAQ:SSP) is a diversified media enterprise operating a range of local television stations, national networks, and digital media platforms.
- Muted 3% annual revenue growth over the last five years shows its demand lagged behind its consumer discretionary peers
- Performance over the past five years shows its incremental sales were much less profitable, as its earnings per share fell by 20.8% annually
- High net-debt-to-EBITDA ratio of 8× could force the company to raise capital at unfavorable terms if market conditions deteriorate


E.W. Scripps’s quality isn’t up to par. Our attention is focused on better businesses.
Why There Are Better Opportunities Than E.W. Scripps


E.W. Scripps is trading at $4.00 per share, or 6x forward EV-to-EBITDA. While valuation is appropriate for the quality you get, we’re still on the sidelines for now.
We’d rather pay up for companies with elite fundamentals than get a decent price on a poor one. High-quality businesses often have more durable earnings power, helping us sleep well at night.
3. E.W. Scripps (SSP) Research Report: Q4 CY2025 Update
Media, broadcasting, and digital services company E.W. Scripps (NASDAQ:SSP) reported revenue ahead of Wall Street’s expectations in Q4 CY2025, but sales fell by 23.1% year on year to $560.3 million. Its GAAP loss of $0.51 per share was significantly below analysts’ consensus estimates.
E.W. Scripps (SSP) Q4 CY2025 Highlights:
- Revenue: $560.3 million vs analyst estimates of $552.4 million (23.1% year-on-year decline, 1.4% beat)
- EPS (GAAP): -$0.51 vs analyst estimates of -$0.19 (significant miss)
- Adjusted EBITDA: $86.37 million vs analyst estimates of $79.81 million (15.4% margin, 8.2% beat)
- Operating Margin: 7.5%, down from 26.3% in the same quarter last year
- Free Cash Flow was -$13.75 million, down from $146.9 million in the same quarter last year
- Market Capitalization: $308.1 million
Company Overview
Founded as a chain of daily newspapers, E.W. Scripps (NASDAQ:SSP) is a diversified media enterprise operating a range of local television stations, national networks, and digital media platforms.
Edward Willis Scripps established the company in 1878 to provide accessible news to the public. Over the years, Scripps expanded from its newspaper roots into broadcasting and digital media, reflecting the evolving preferences of consumers.
E.W. Scripps manages numerous local TV stations and national networks, offering news, information, and entertainment. It has also ventured into the digital domain with various online platforms, catering to the contemporary demand for multi-platform media access. This expansion into digital media complements Scripps’ traditional broadcasting operations, addressing the diverse preferences of modern audiences.
The company's revenue sources include advertising, retransmission fees, and subscriptions.
4. Consumer Discretionary - Broadcasting
The Consumer Discretionary sector, by definition, is made up of companies selling non-essential goods and services. When economic conditions deteriorate or tastes shift, consumers can easily cut back or eliminate these purchases. For long-term investors with five-year holding periods, this creates a structural challenge: the sector is inherently hit-driven, with low switching costs and fickle customers. As a result, only a handful of companies can reliably grow demand and compound earnings over long periods, which is why our bar is high and High Quality ratings are rare.
Broadcasting companies produce and distribute television and radio content, generating revenue primarily through advertising and, in some cases, retransmission fees (payments cable and satellite operators make to carry local channels). Tailwinds include resilient demand for live sports and event programming, which commands premium ad rates, and political advertising during election cycles. Headwinds, however, are substantial: secular cord-cutting (consumers canceling traditional pay-TV subscriptions) is shrinking linear audiences, digital platforms are capturing an increasing share of advertising budgets, and content production costs continue to rise. Regulatory scrutiny over media consolidation and spectrum ownership further constrains strategic flexibility.
Competitors in the local television broadcasting and digital media sector include Nexstar Media (NASDAQ:NXST), Sinclair (NASDAQ:SBGI), and TEGNA (NYSE:TGNA).
5. Revenue Growth
Reviewing a company’s long-term sales performance reveals insights into its quality. Any business can have short-term success, but a top-tier one grows for years. Over the last five years, E.W. Scripps grew its sales at a weak 3% compounded annual growth rate. This was below our standards and is a tough starting point for our analysis.
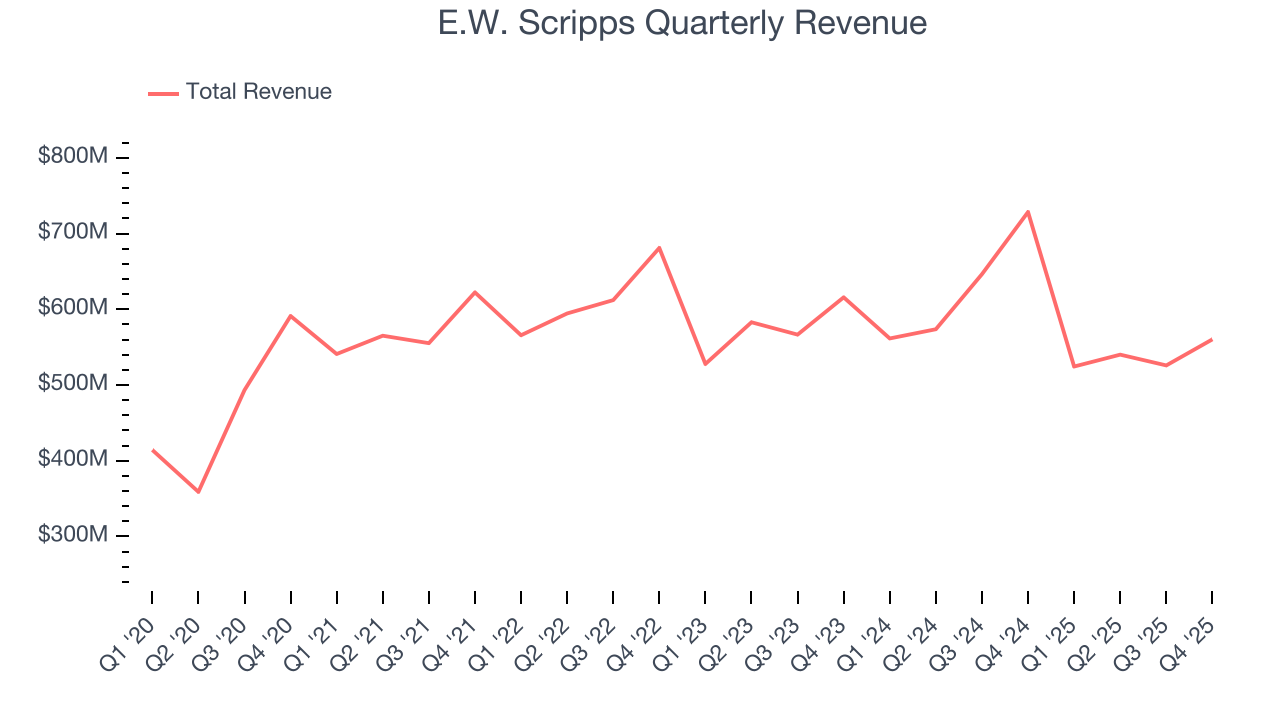
Long-term growth is the most important, but within consumer discretionary, product cycles are short and revenue can be hit-driven due to rapidly changing trends and consumer preferences. E.W. Scripps’s performance shows it grew in the past but relinquished its gains over the last two years, as its revenue fell by 3.2% annually. 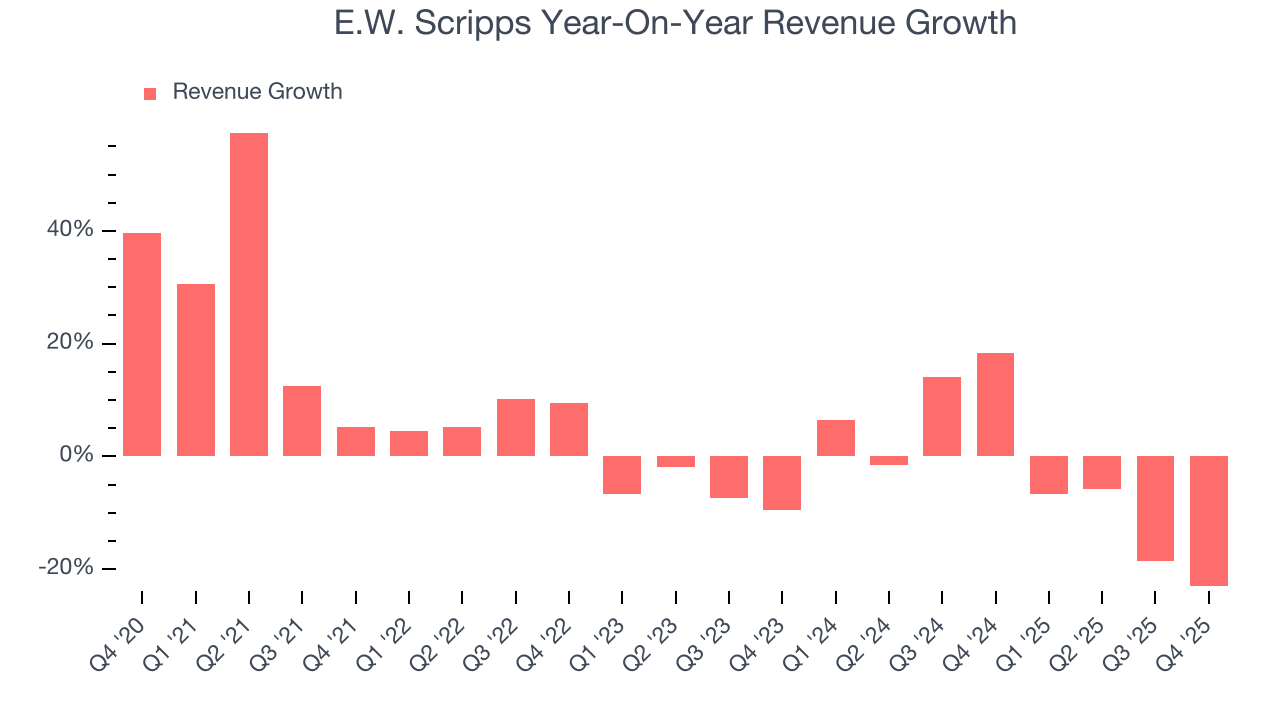
This quarter, E.W. Scripps’s revenue fell by 23.1% year on year to $560.3 million but beat Wall Street’s estimates by 1.4%.
Looking ahead, sell-side analysts expect revenue to grow 8.4% over the next 12 months. Although this projection indicates its newer products and services will catalyze better top-line performance, it is still below the sector average.
6. Operating Margin
Operating margin is an important measure of profitability as it shows the portion of revenue left after accounting for all core expenses – everything from the cost of goods sold to advertising and wages. It’s also useful for comparing profitability across companies with different levels of debt and tax rates because it excludes interest and taxes.
E.W. Scripps’s operating margin has shrunk over the last 12 months and averaged 12.8% over the last two years. The company’s profitability was mediocre for a consumer discretionary business and shows it couldn’t pass its higher operating expenses onto its customers.
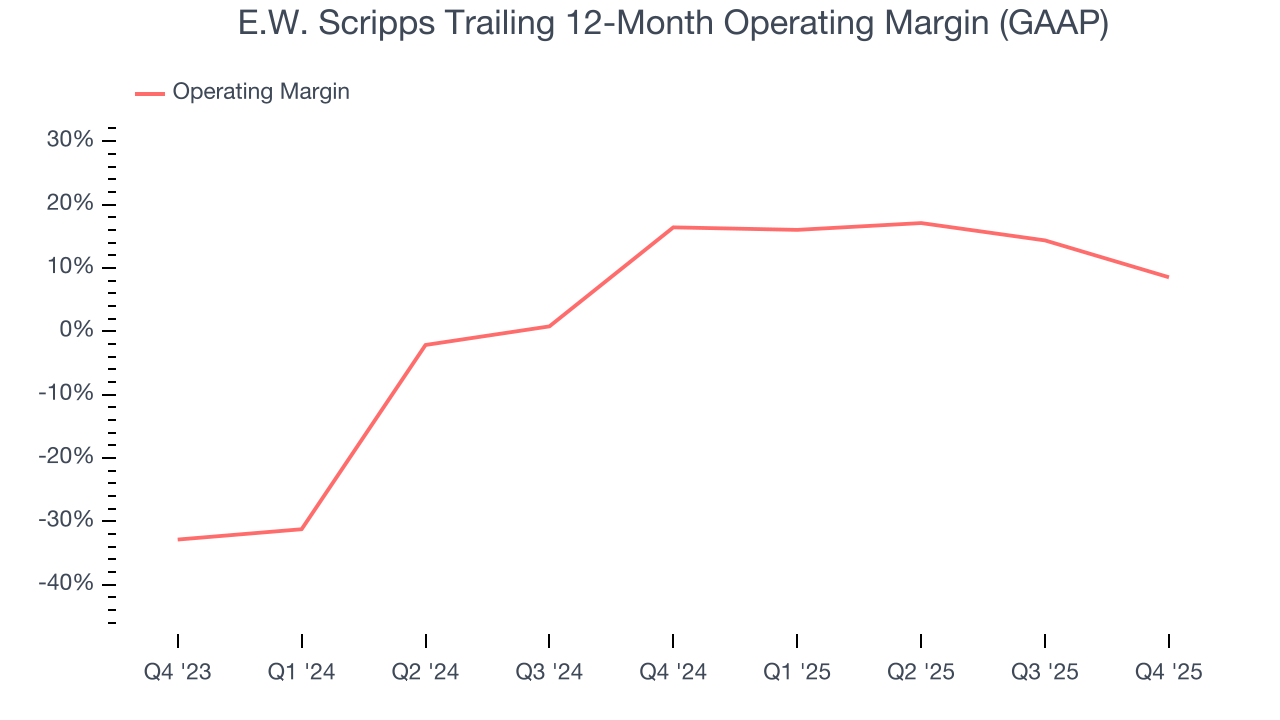
In Q4, E.W. Scripps generated an operating margin profit margin of 7.5%, down 18.8 percentage points year on year. This contraction shows it was less efficient because its expenses increased relative to its revenue.
7. Earnings Per Share
We track the long-term change in earnings per share (EPS) for the same reason as long-term revenue growth. Compared to revenue, however, EPS highlights whether a company’s growth is profitable.
Sadly for E.W. Scripps, its EPS declined by 20.8% annually over the last five years while its revenue grew by 3%. This tells us the company became less profitable on a per-share basis as it expanded.
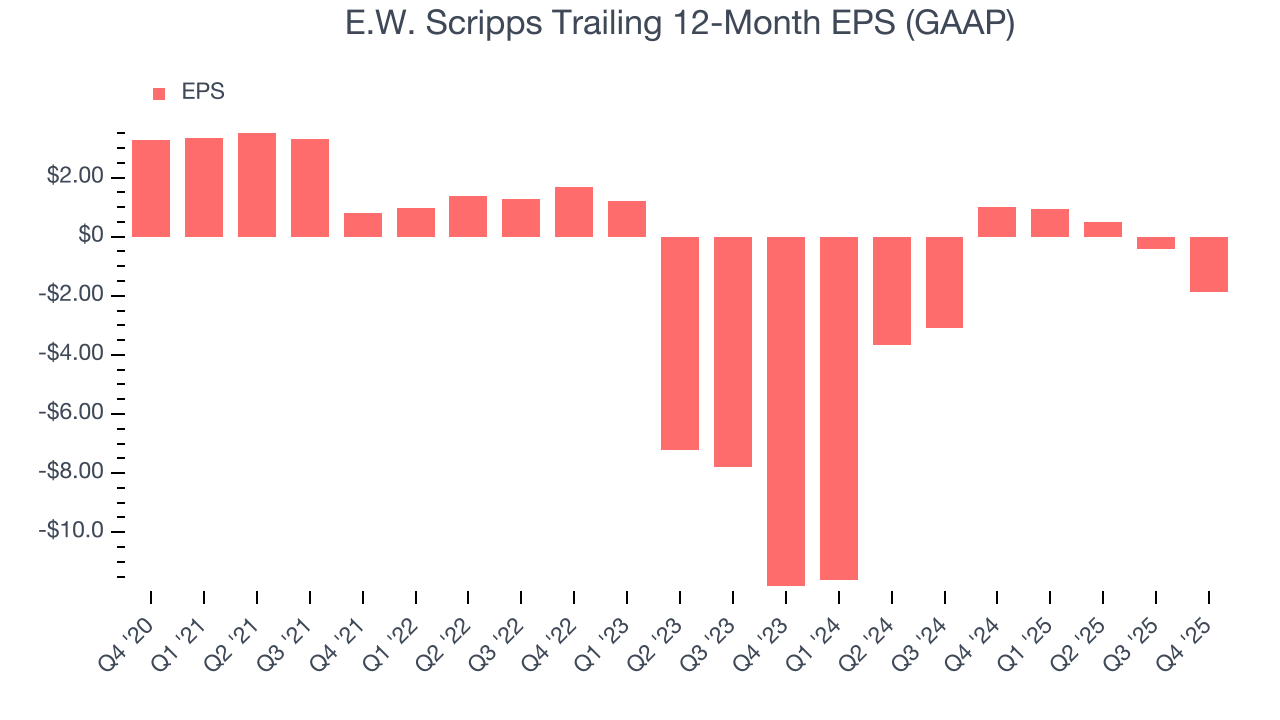
In Q4, E.W. Scripps reported EPS of negative $0.51, down from $0.93 in the same quarter last year. This print missed analysts’ estimates. Over the next 12 months, Wall Street expects E.W. Scripps to improve its earnings losses. Analysts forecast its full-year EPS of negative $1.87 will advance to negative $0.10.
8. Cash Is King
Although earnings are undoubtedly valuable for assessing company performance, we believe cash is king because you can’t use accounting profits to pay the bills.
E.W. Scripps has shown poor cash profitability over the last two years, giving the company limited opportunities to return capital to shareholders. Its free cash flow margin averaged 5.6%, lousy for a consumer discretionary business.
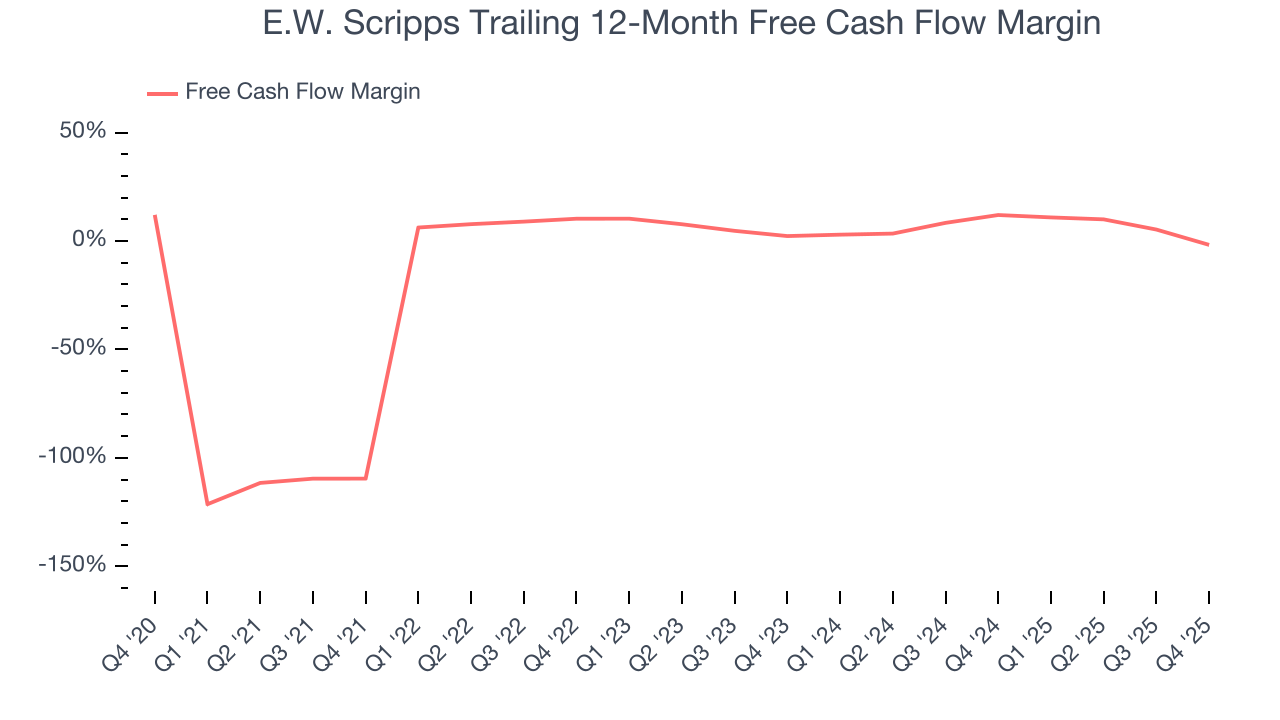
E.W. Scripps burned through $13.75 million of cash in Q4, equivalent to a negative 2.5% margin. The company’s cash flow turned negative after being positive in the same quarter last year, prompting us to pay closer attention. Short-term fluctuations typically aren’t a big deal because investment needs can be seasonal, but we’ll be watching to see if the trend extrapolates into future quarters.
Looking forward, analysts predict E.W. Scripps will generate cash on a full-year basis. Their consensus estimates imply its free cash flow margin of negative 1.8% for the last 12 months will increase to positive 8.5%, giving it more money to invest.
9. Return on Invested Capital (ROIC)
EPS and free cash flow tell us whether a company was profitable while growing its revenue. But was it capital-efficient? Enter ROIC, a metric showing how much operating profit a company generates relative to the money it has raised (debt and equity).
E.W. Scripps historically did a mediocre job investing in profitable growth initiatives. Its five-year average ROIC was 2.3%, lower than the typical cost of capital (how much it costs to raise money) for consumer discretionary companies.
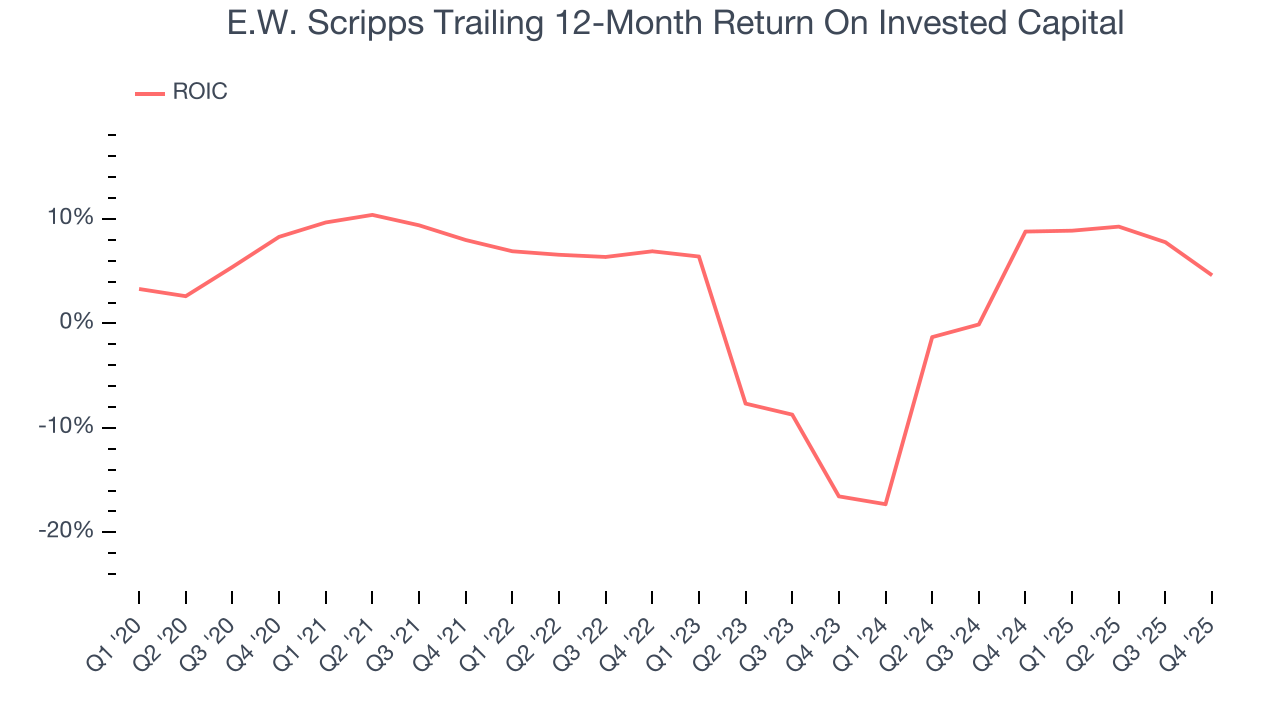
We like to invest in businesses with high returns, but the trend in a company’s ROIC is what often surprises the market and moves the stock price. Unfortunately, E.W. Scripps’s ROIC has stayed the same over the last few years. If the company wants to become an investable business, it must improve its returns by generating more profitable growth.
10. Balance Sheet Risk
As long-term investors, the risk we care about most is the permanent loss of capital, which can happen when a company goes bankrupt or raises money from a disadvantaged position. This is separate from short-term stock price volatility, something we are much less bothered by.
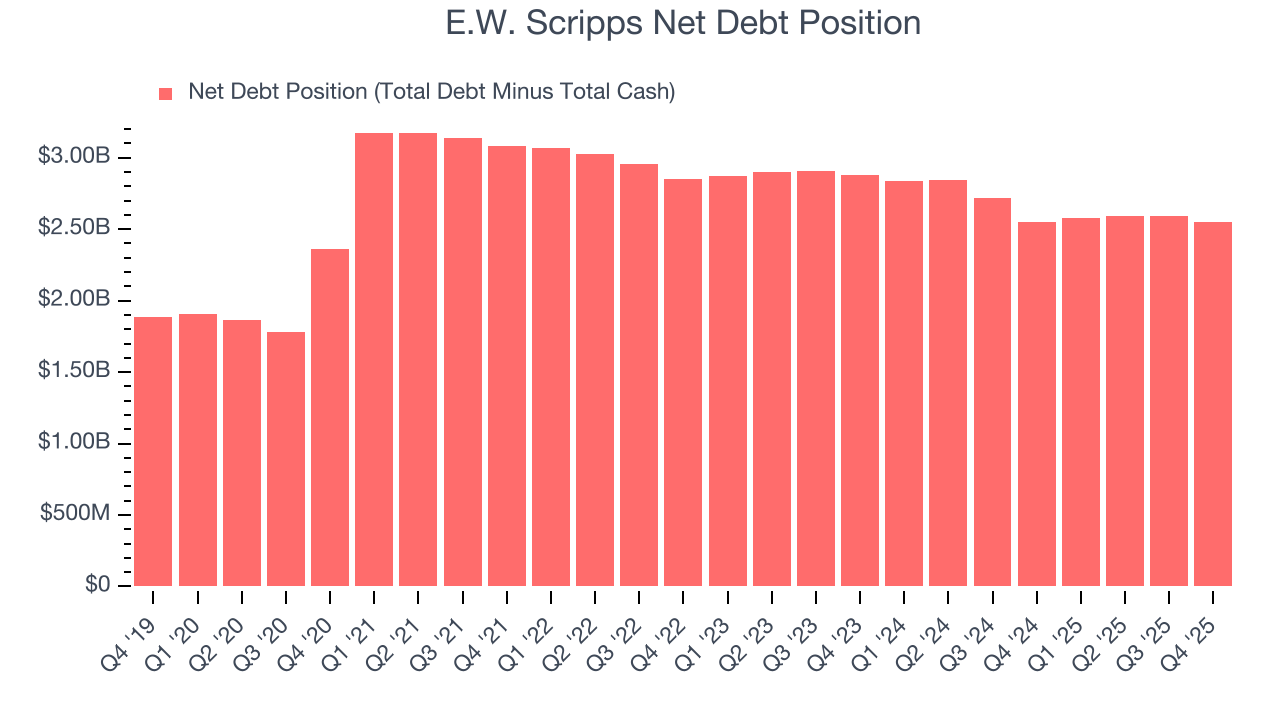
E.W. Scripps burned through $38.47 million of cash over the last year, and its $2.59 billion of debt exceeds the $42.29 million of cash on its balance sheet. This is a deal breaker for us because indebted loss-making companies spell trouble.
Unless the E.W. Scripps’s fundamentals change quickly, it might find itself in a position where it must raise capital from investors to continue operating. Whether that would be favorable is unclear because dilution is a headwind for shareholder returns.
We remain cautious of E.W. Scripps until it generates consistent free cash flow or any of its announced financing plans materialize on its balance sheet.
11. Key Takeaways from E.W. Scripps’s Q4 Results
It was encouraging to see E.W. Scripps beat analysts’ EBITDA expectations this quarter. We were also happy its revenue narrowly outperformed Wall Street’s estimates. Overall, this was a solid quarter. The stock remained flat at $3.63 immediately following the results.
12. Is Now The Time To Buy E.W. Scripps?
Updated: March 14, 2026 at 10:50 PM EDT
When considering an investment in E.W. Scripps, investors should account for its valuation and business qualities as well as what’s happened in the latest quarter.
We cheer for all companies serving everyday consumers, but in the case of E.W. Scripps, we’ll be cheering from the sidelines. While its projected EPS for the next year implies the company’s fundamentals will improve, the downside is its declining EPS over the last five years makes it a less attractive asset to the public markets. On top of that, its relatively low ROIC suggests management has struggled to find compelling investment opportunities.
E.W. Scripps’s EV-to-EBITDA ratio based on the next 12 months is 6x. While this valuation is fair, the upside isn’t great compared to the potential downside. There are superior stocks to buy right now.
Wall Street analysts have a consensus one-year price target of $6.93 on the company (compared to the current share price of $4.00).
Although the price target is bullish, readers should exercise caution because analysts tend to be overly optimistic. The firms they work for, often big banks, have relationships with companies that extend into fundraising, M&A advisory, and other rewarding business lines. As a result, they typically hesitate to say bad things for fear they will lose out. We at StockStory do not suffer from such conflicts of interest, so we’ll always tell it like it is.