
PubMatic (PUBM)
PubMatic is in for a bumpy ride. Its underwhelming sales growth and operating losses make us question the sustainability of its business model.― StockStory Analyst Team
1. News


2. Summary
Why We Think PubMatic Will Underperform
Powering billions of daily ad impressions across the open internet, PubMatic (NASDAQ:PUBM) operates a technology platform that helps publishers maximize revenue from their digital advertising inventory while giving advertisers more control and transparency.
- 2.9% annual revenue growth over the last two years was slower than its software peers
- Estimated sales growth of 1.7% for the next 12 months is soft and implies weaker demand
- Expenses have increased as a percentage of revenue over the last year as its operating margin fell by 7.4 percentage points


PubMatic doesn’t live up to our standards. We’re hunting for superior stocks elsewhere.
Why There Are Better Opportunities Than PubMatic


PubMatic is trading at $7.97 per share, or 1.4x forward price-to-sales. PubMatic’s valuation may seem like a great deal, but we think there are valid reasons why it’s so cheap.
We’d rather pay up for companies with elite fundamentals than get a bargain on weak ones. Cheap stocks can be value traps, and as their performance deteriorates, they will stay cheap or get even cheaper.
3. PubMatic (PUBM) Research Report: Q4 CY2025 Update
Digital advertising technology company PubMatic (NASDAQ:PUBM) reported revenue ahead of Wall Street’s expectations in Q4 CY2025, but sales fell by 6.4% year on year to $80.05 million. Guidance for next quarter’s revenue was optimistic at $59 million at the midpoint, 2.2% above analysts’ estimates. Its non-GAAP profit of $0.29 per share was 89.1% above analysts’ consensus estimates.
PubMatic (PUBM) Q4 CY2025 Highlights:
- Revenue: $80.05 million vs analyst estimates of $75.39 million (6.4% year-on-year decline, 6.2% beat)
- Adjusted EPS: $0.29 vs analyst estimates of $0.15 (89.1% beat)
- Adjusted EBITDA: $27.82 million vs analyst estimates of $20 million (34.8% margin, 39.1% beat)
- Revenue Guidance for Q1 CY2026 is $59 million at the midpoint, above analyst estimates of $57.71 million
- EBITDA guidance for Q1 CY2026 is $250,000 at the midpoint, above analyst estimates of $185,440
- Operating Margin: 10.6%, down from 17.3% in the same quarter last year
- Free Cash Flow Margin: 8.6%, down from 33.5% in the previous quarter
- Net Revenue Retention Rate: 96%
- Market Capitalization: $305.4 million
Company Overview
Powering billions of daily ad impressions across the open internet, PubMatic (NASDAQ:PUBM) operates a technology platform that helps publishers maximize revenue from their digital advertising inventory while giving advertisers more control and transparency.
PubMatic serves as a critical intermediary in the complex digital advertising ecosystem through its supply-side platform (SSP). The company works directly with publishers—websites, apps, and other digital content creators—giving them tools to sell their advertising space programmatically through real-time auctions. When someone visits a website or app that uses PubMatic's technology, the platform instantly analyzes the available ad space and matches it with appropriate advertisers willing to bid for that impression.
The company's platform processes enormous volumes of data in milliseconds to optimize these transactions. For publishers, this means higher revenue by ensuring their ad inventory reaches the most relevant and highest-paying advertisers. For advertisers and their agencies, PubMatic provides access to quality publisher inventory with transparency into where their ads appear and the ability to target specific audiences effectively.
PubMatic offers specialized solutions including OpenWrap (a header bidding tool that increases competition for ad space), Activate (for direct deals between publishers and advertisers), and Convert (focused on commerce media). The company generates revenue primarily by charging publishers a percentage of the value of advertising impressions sold through its platform.
PubMatic differentiates itself by owning and operating its technology infrastructure rather than relying on public cloud services, which it claims provides cost efficiencies and performance advantages. The company serves both premium individual publishers and channel partners who aggregate inventory from smaller publishers across the Americas, Europe, and Asia-Pacific regions.
4. Advertising Software
The digital advertising market is large, growing, and becoming more diverse, both in terms of audiences and media. As a result, there is a growing need for software that enables advertisers to use data to automate and optimize ad placements.
PubMatic competes with other supply-side platforms including Magnite (NASDAQ:MGNI), Google's Ad Manager (NASDAQ:GOOGL), and various smaller private SSPs operating in different global markets. The company also faces indirect competition from divisions of larger tech companies that offer advertising solutions across the digital ad ecosystem.
5. Revenue Growth
Examining a company’s long-term performance can provide clues about its quality. Even a bad business can shine for one or two quarters, but a top-tier one grows for years. Over the last five years, PubMatic grew its sales at a 13.7% annual rate. Though this growth is acceptable on an absolute basis, we need to see more than just topline growth for the software sector, which can display significant earnings volatility. This means our bar for the sector is particularly high, reflecting the non-essential and hit-driven nature of the products and services offered. Additionally, five-year CAGR starts around Covid, when revenue was depressed then rebounded.
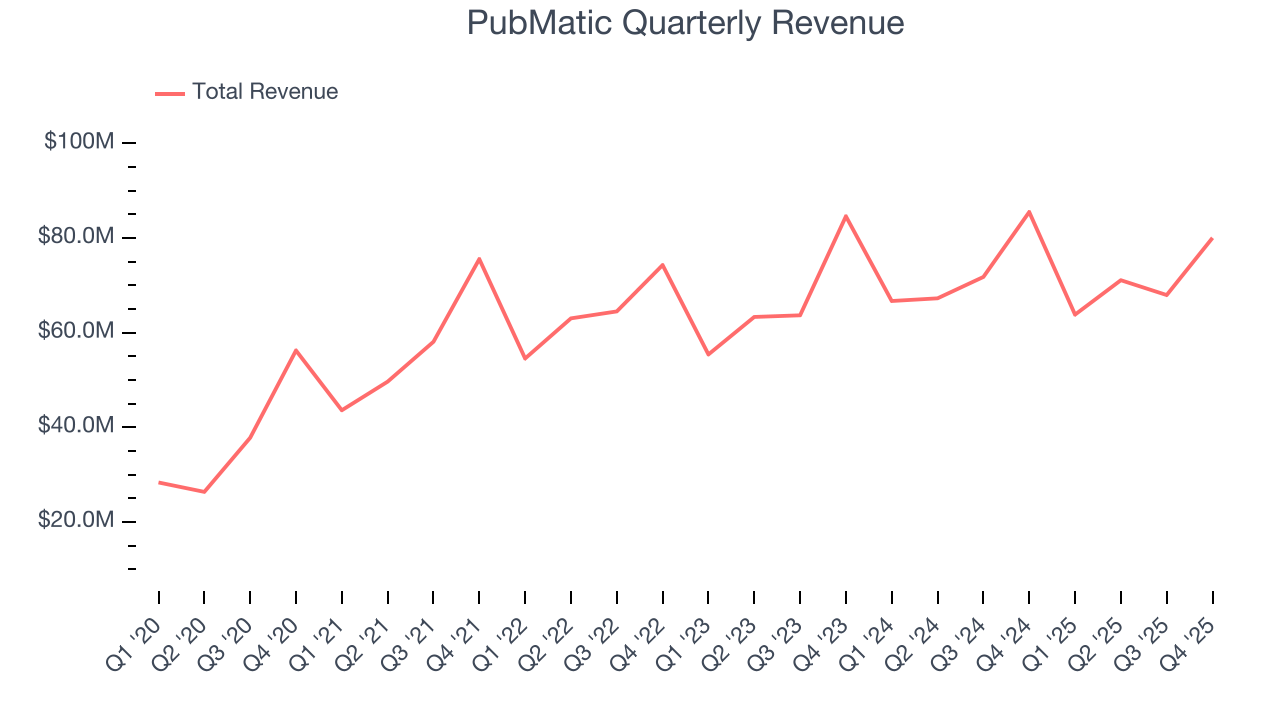
Long-term growth is the most important, but within software, a half-decade historical view may miss new innovations or demand cycles. PubMatic’s recent performance shows its demand has slowed as its annualized revenue growth of 2.9% over the last two years was below its five-year trend. We’re wary when companies in the sector see decelerations in revenue growth, as it could signal changing consumer tastes aided by low switching costs. 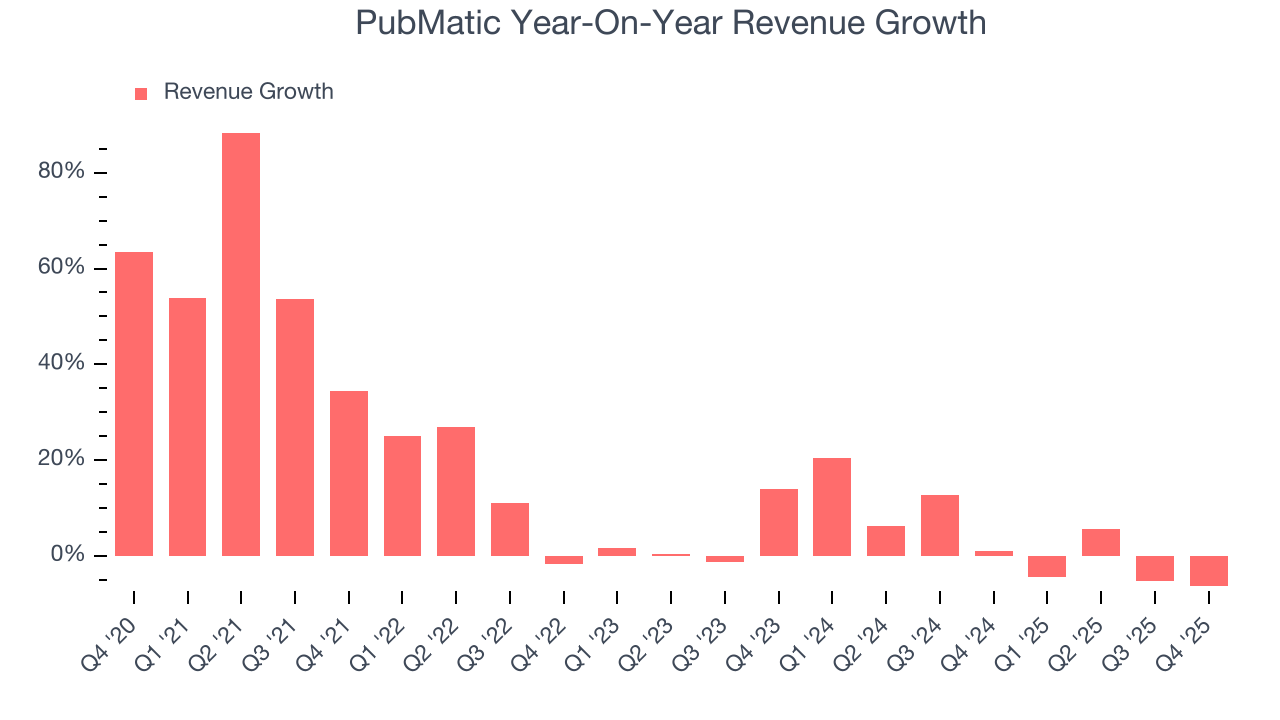
This quarter, PubMatic’s revenue fell by 6.4% year on year to $80.05 million but beat Wall Street’s estimates by 6.2%. Company management is currently guiding for a 7.6% year-on-year decline in sales next quarter.
Looking further ahead, sell-side analysts expect revenue to decline by 1.2% over the next 12 months, a deceleration versus the last two years. This projection is underwhelming and suggests its products and services will face some demand challenges.
6. Customer Acquisition Efficiency
The customer acquisition cost (CAC) payback period represents the months required to recover the cost of acquiring a new customer. Essentially, it’s the break-even point for sales and marketing investments. A shorter CAC payback period is ideal, as it implies better returns on investment and business scalability.
PubMatic’s recent customer acquisition efforts haven’t yielded returns as its CAC payback period was negative this quarter, meaning its incremental sales and marketing investments outpaced its revenue. The company’s inefficiency indicates it operates in a highly competitive environment where there is little differentiation between PubMatic’s products and its peers.
7. Gross Margin & Pricing Power
For software companies like PubMatic, gross profit tells us how much money remains after paying for the base cost of products and services (typically servers, licenses, and certain personnel). These costs are usually low as a percentage of revenue, explaining why software is more lucrative than other sectors.
PubMatic’s gross margin is substantially worse than most software businesses, signaling it has relatively high infrastructure costs compared to asset-lite businesses like ServiceNow. As you can see below, it averaged a 63.6% gross margin over the last year. That means PubMatic paid its providers a lot of money ($36.44 for every $100 in revenue) to run its business.
The market not only cares about gross margin levels but also how they change over time because expansion creates firepower for profitability and free cash generation. PubMatic has seen gross margins improve by 0.7 percentage points over the last 2 year, which is slightly better than average for software.
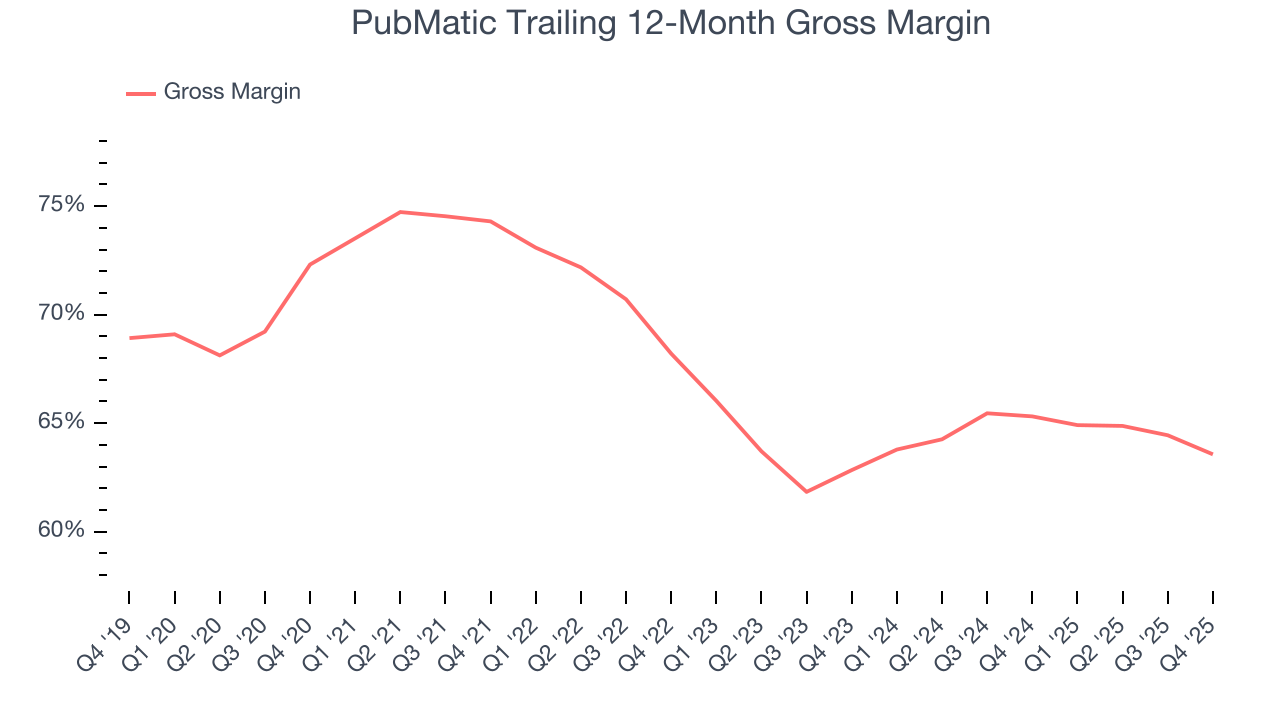
This quarter, PubMatic’s gross profit margin was 68.2%, down 2.7 percentage points year on year. PubMatic’s full-year margin has also been trending down over the past 12 months, decreasing by 1.7 percentage points. If this move continues, it could suggest a more competitive environment with some pressure to lower prices and higher input costs.
8. Operating Margin
Many software businesses adjust their profits for stock-based compensation (SBC), but we prioritize GAAP operating margin because SBC is a real expense used to attract and retain engineering and sales talent. This is one of the best measures of profitability because it shows how much money a company takes home after developing, marketing, and selling its products.
Although PubMatic was profitable this quarter from an operational perspective, it’s generally struggled over a longer time period. Its expensive cost structure has contributed to an average operating margin of negative 6.1% over the last year. Unprofitable software companies require extra attention because they spend heaps of money to capture market share. As seen in its historically underwhelming revenue performance, this strategy hasn’t worked so far, and it’s unclear what would happen if PubMatic reeled back its investments. Wall Street seems to think it will face some obstacles, and we tend to agree.
Analyzing the trend in its profitability, PubMatic’s operating margin decreased by 7.4 percentage points over the last two years. This raises questions about the company’s expense base because its revenue growth should have given it leverage on its fixed costs, resulting in better economies of scale and profitability. PubMatic’s performance was poor no matter how you look at it - it shows that costs were rising and it couldn’t pass them onto its customers.
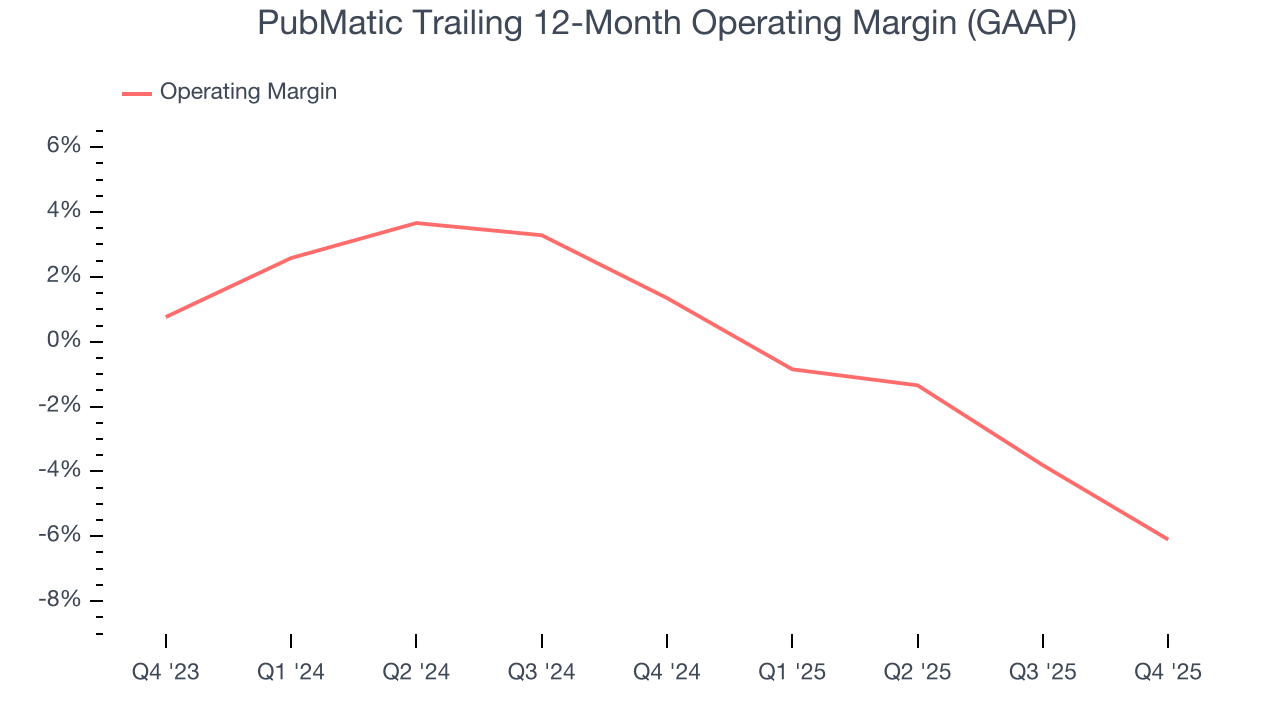
This quarter, PubMatic generated an operating margin profit margin of 10.6%, down 6.7 percentage points year on year. Since PubMatic’s operating margin decreased more than its gross margin, we can assume it was less efficient because expenses such as marketing, R&D, and administrative overhead increased.
9. Cash Is King
Free cash flow isn't a prominently featured metric in company financials and earnings releases, but we think it's telling because it accounts for all operating and capital expenses, making it tough to manipulate. Cash is king.
PubMatic has shown decent cash profitability, giving it some flexibility to reinvest or return capital to investors. The company’s free cash flow margin averaged 16.3% over the last year, slightly better than the broader software sector.
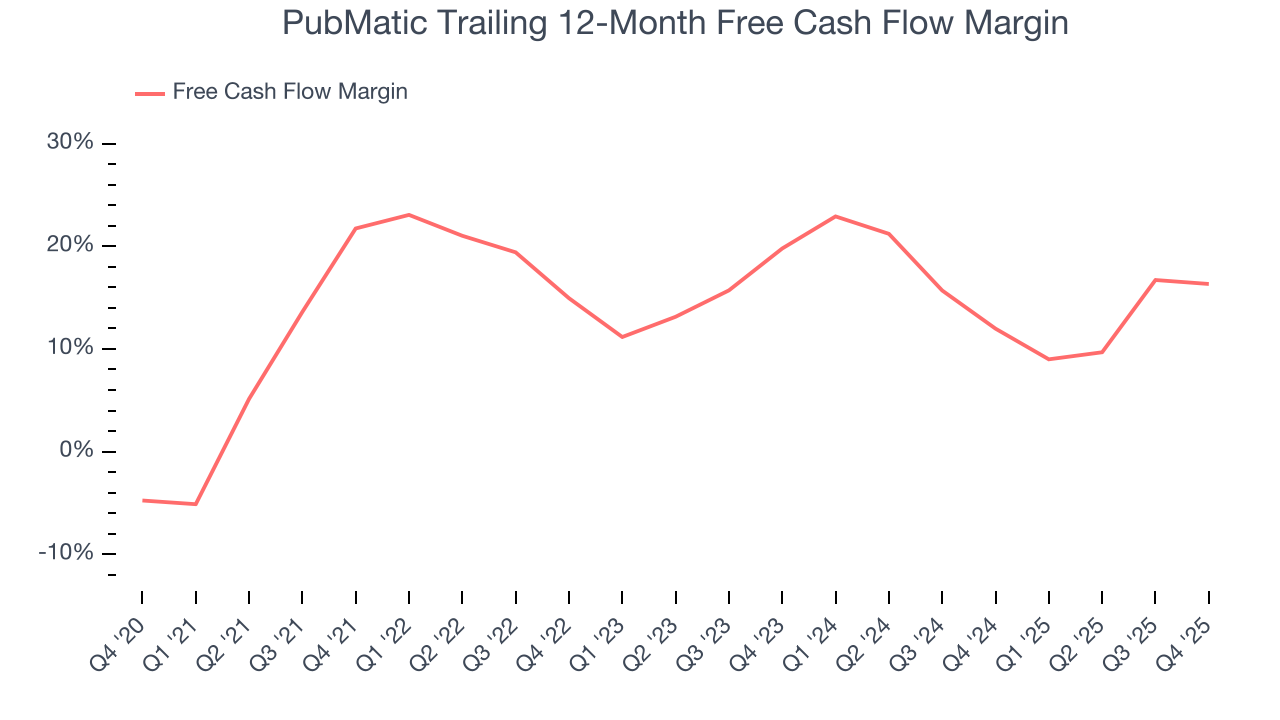
PubMatic’s free cash flow clocked in at $6.85 million in Q4, equivalent to a 8.6% margin. The company’s cash profitability regressed as it was 1.8 percentage points lower than in the same quarter last year, prompting us to pay closer attention. Short-term fluctuations typically aren’t a big deal because investment needs can be seasonal, but we’ll be watching to see if the trend extrapolates into future quarters.
Over the next year, analysts predict PubMatic’s cash conversion will improve. Their consensus estimates imply its free cash flow margin of 16.3% for the last 12 months will increase to 28.5%, it options for capital deployment (investments, share buybacks, etc.).
10. Balance Sheet Assessment
Businesses that maintain a cash surplus face reduced bankruptcy risk.
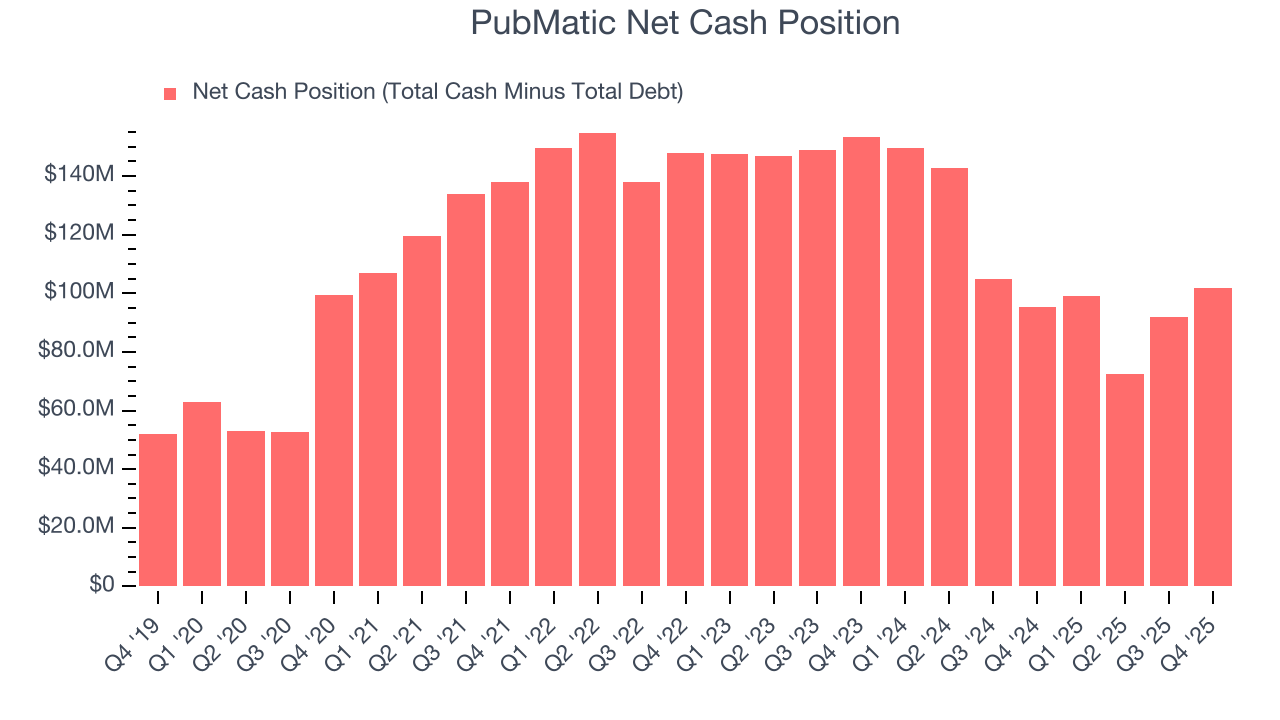
PubMatic is a well-capitalized company with $145.5 million of cash and $43.86 million of debt on its balance sheet. This $101.7 million net cash position is 33.3% of its market cap and gives it the freedom to borrow money, return capital to shareholders, or invest in growth initiatives. Leverage is not an issue here.
11. Key Takeaways from PubMatic’s Q4 Results
We were impressed by how significantly PubMatic blew past analysts’ EBITDA expectations this quarter. We were also glad its EBITDA guidance for next quarter trumped Wall Street’s estimates. Zooming out, we think this was a good print with some key areas of upside. The stock traded up 6.7% to $7.55 immediately following the results.
12. Is Now The Time To Buy PubMatic?
Updated: March 15, 2026 at 10:21 PM EDT
When considering an investment in PubMatic, investors should account for its valuation and business qualities as well as what’s happened in the latest quarter.
We see the value of companies addressing major business pain points, but in the case of PubMatic, we’re out. To kick things off, its revenue growth was uninspiring over the last five years, and analysts expect its demand to deteriorate over the next 12 months. On top of that, PubMatic’s declining operating margin shows it’s becoming less efficient at building and selling its software, and its software has low switching costs and high turnover.
PubMatic’s price-to-sales ratio based on the next 12 months is 1.4x. This multiple tells us a lot of good news is priced in - we think there are better opportunities elsewhere.
Wall Street analysts have a consensus one-year price target of $11.61 on the company (compared to the current share price of $7.97).
Although the price target is bullish, readers should exercise caution because analysts tend to be overly optimistic. The firms they work for, often big banks, have relationships with companies that extend into fundraising, M&A advisory, and other rewarding business lines. As a result, they typically hesitate to say bad things for fear they will lose out. We at StockStory do not suffer from such conflicts of interest, so we’ll always tell it like it is.