Papa John's (PZZA)
Papa John's is in for a bumpy ride. Its weak sales growth and declining returns on capital show its demand and profits are shrinking.― StockStory Analyst Team
1. News


2. Summary
Why We Think Papa John's Will Underperform
Founded by the eclectic John “Papa John” Schnatter, Papa John’s (NASDAQ:PZZA) is a globally recognized pizza delivery and carryout chain known for “better ingredients” and “better pizza”.
- Sales are projected to tank by 6.1% over the next 12 months as demand evaporates
- Weak same-store sales trends over the past two years suggest there may be few opportunities in its core markets to open new restaurants
- 4% annual revenue growth over the last six years was slower than its restaurant peers


Papa John's fails to meet our quality criteria. We’d rather invest in businesses with stronger moats.
Why There Are Better Opportunities Than Papa John's


At $36.73 per share, Papa John's trades at 23.6x forward P/E. The current valuation may be appropriate, but we’re still not buyers of the stock.
There are stocks out there featuring similar valuation multiples with better fundamentals. We prefer to invest in those.
3. Papa John's (PZZA) Research Report: Q4 CY2025 Update
Fast-food pizza chain Papa John’s (NASDAQ:PZZA) missed Wall Street’s revenue expectations in Q4 CY2025, with sales falling 6.1% year on year to $498.2 million. Its non-GAAP profit of $0.34 per share was 3.8% above analysts’ consensus estimates.
Papa John's (PZZA) Q4 CY2025 Highlights:
- Revenue: $498.2 million vs analyst estimates of $517.9 million (6.1% year-on-year decline, 3.8% miss)
- Adjusted EPS: $0.34 vs analyst estimates of $0.33 (3.8% beat)
- Adjusted EBITDA: $51.11 million vs analyst estimates of $48.19 million (10.3% margin, 6.1% beat)
- EBITDA guidance for the upcoming financial year 2026 is $205 million at the midpoint, below analyst estimates of $215.3 million
- Operating Margin: 4.9%, in line with the same quarter last year
- Free Cash Flow Margin: 0.4%, down from 4.7% in the same quarter last year
- Locations: 6,083 at quarter end, up from 6,030 in the same quarter last year
- Same-Store Sales fell 2.5% year on year, in line with the same quarter last year
- Market Capitalization: $1.11 billion
Company Overview
Founded by the eclectic John “Papa John” Schnatter, Papa John’s (NASDAQ:PZZA) is a globally recognized pizza delivery and carryout chain known for “better ingredients” and “better pizza”.
John started the company in 1984 when he converted a broom closet in his father's struggling Indiana tavern into a pizza-making station. To pay for the necessary equipment, he sold his 1971 Camaro for $1,600.
John eventually got his Camaro back for $250,000 in 2009, but that wasn’t the only asset that grew in value. From its humble beginnings, Papa John’s now boasts over 5,700 stores around the world and is one of the most popular pizza brands in the United States.
At the heart of Papa John's success lies its dedication to using fresh, high-quality ingredients in its wide range of menu items, which include creative specials like its Doritos Cool Ranch Papadias and Cinnamon Pull Aparts to traditional classics such as pepperoni pizza, cheesy breadsticks, and healthy salads.
Convenience is a key focus at the company, and like other national pizza chains, Papa John’s uses smaller carry-out-centric storefronts to fulfill its orders. Most customers order online or via its mobile app to better customize pizzas and avoid wait times while others opt for delivery either through Papa John’s directly or popular third-party platforms such as DoorDash, Seamless, or Uber Eats.
4. Traditional Fast Food
Traditional fast-food restaurants are renowned for their speed and convenience, boasting menus filled with familiar and budget-friendly items. Their reputations for on-the-go consumption make them favored destinations for individuals and families needing a quick meal. This class of restaurants, however, is fighting the perception that their meals are unhealthy and made with inferior ingredients, a battle that's especially relevant today given the consumers increasing focus on health and wellness.
Fast-food pizza competitors include public companies Domino’s (NYSE:DPZ) and Pizza Hut (owned by Yum! Brands, NYSE:YUM) as well as private company Little Caesars.
5. Revenue Growth
Examining a company’s long-term performance can provide clues about its quality. Any business can put up a good quarter or two, but many enduring ones grow for years.
With $2.05 billion in revenue over the past 12 months, Papa John's is a mid-sized restaurant chain, which sometimes brings disadvantages compared to larger competitors benefiting from better brand awareness and economies of scale.
As you can see below, Papa John's grew its sales at a sluggish 4% compounded annual growth rate over the last six years.
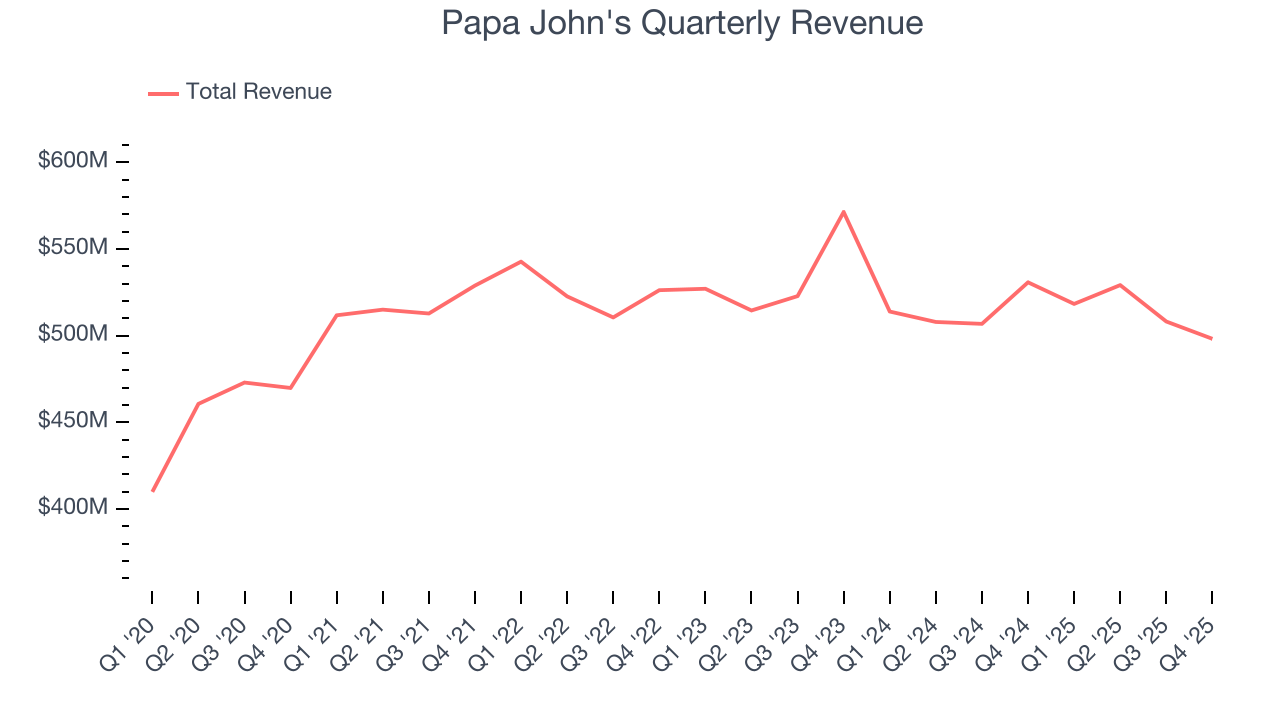
This quarter, Papa John's missed Wall Street’s estimates and reported a rather uninspiring 6.1% year-on-year revenue decline, generating $498.2 million of revenue.
Looking ahead, sell-side analysts expect revenue to decline by 1.1% over the next 12 months, a deceleration versus the last six years. This projection is underwhelming and implies its menu offerings will face some demand challenges.
6. Restaurant Performance
Number of Restaurants
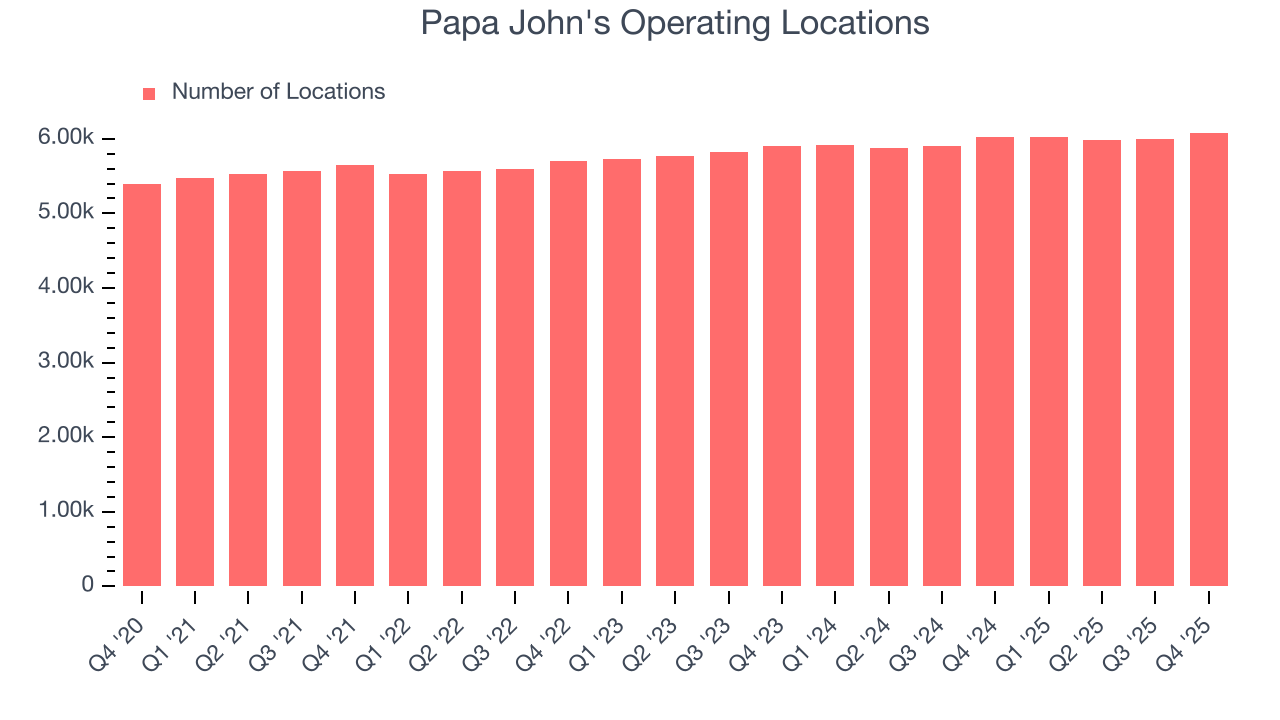
The number of dining locations a restaurant chain operates is a critical driver of how quickly company-level sales can grow.
Papa John's operated 6,083 locations in the latest quarter. It has opened new restaurants quickly over the last two years, averaging 1.9% annual growth, faster than the broader restaurant sector. Furthermore, one dynamic making expansion more seamless is the company’s franchise model, where franchisees are primarily responsible for opening new restaurants while Papa John's provides support.
When a chain opens new restaurants, it usually means it’s investing for growth because there’s healthy demand for its meals and there are markets where its concepts have few or no locations.
Same-Store Sales
The change in a company's restaurant base only tells one side of the story. The other is the performance of its existing locations, which informs management teams whether they should expand or downsize their physical footprints. Same-store sales is an industry measure of whether revenue is growing at those existing restaurants and is driven by customer visits (often called traffic) and the average spending per customer (ticket).
Papa John’s demand has been shrinking over the last two years as its same-store sales have averaged 1.9% annual declines. This performance is concerning - it shows Papa John's artificially boosts its revenue by building new restaurants. We’d like to see a company’s same-store sales rise before it takes on the costly, capital-intensive endeavor of expanding its restaurant base.
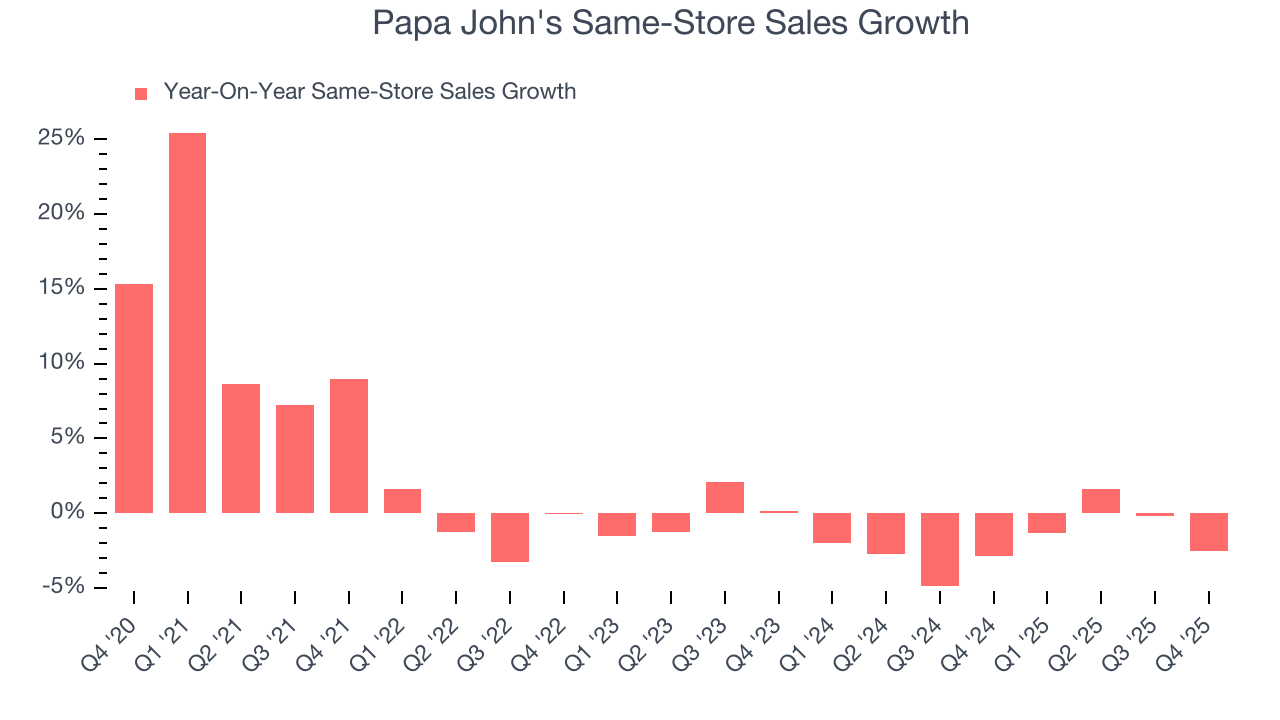
In the latest quarter, Papa John’s same-store sales fell by 2.5% year on year. This performance was more or less in line with its historical levels.
7. Gross Margin & Pricing Power
Papa John's has bad unit economics for a restaurant company, signaling it operates in a competitive market and has little room for error if demand unexpectedly falls. As you can see below, it averaged a 17.4% gross margin over the last two years. That means Papa John's paid its suppliers a lot of money ($82.64 for every $100 in revenue) to run its business. 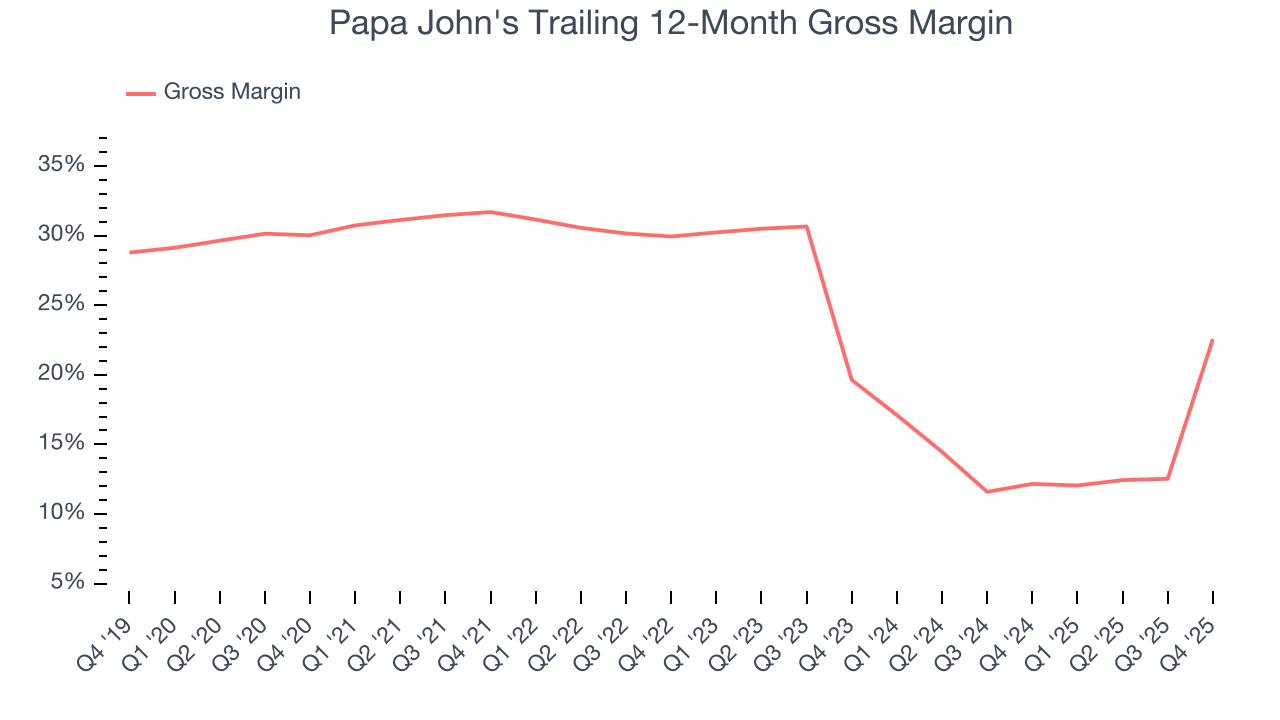
This quarter, Papa John’s gross profit margin was 29.1%, marking a 39.9 percentage point increase from -10.8% in the same quarter last year. Papa John’s full-year margin has also been trending up over the past 12 months, increasing by 10.4 percentage points. If this move continues, it could suggest an environment where the company has better pricing power and stable or shrinking input costs (such as ingredients and transportation expenses).
8. Operating Margin
Papa John's was profitable over the last two years but held back by its large cost base. Its average operating margin of 6% was weak for a restaurant business. This result isn’t too surprising given its low gross margin as a starting point.
Analyzing the trend in its profitability, Papa John’s operating margin decreased by 3.3 percentage points over the last year. This raises questions about the company’s expense base because its revenue growth should have given it leverage on its fixed costs, resulting in better economies of scale and profitability. Papa John’s performance was poor no matter how you look at it - it shows that costs were rising and it couldn’t pass them onto its customers.
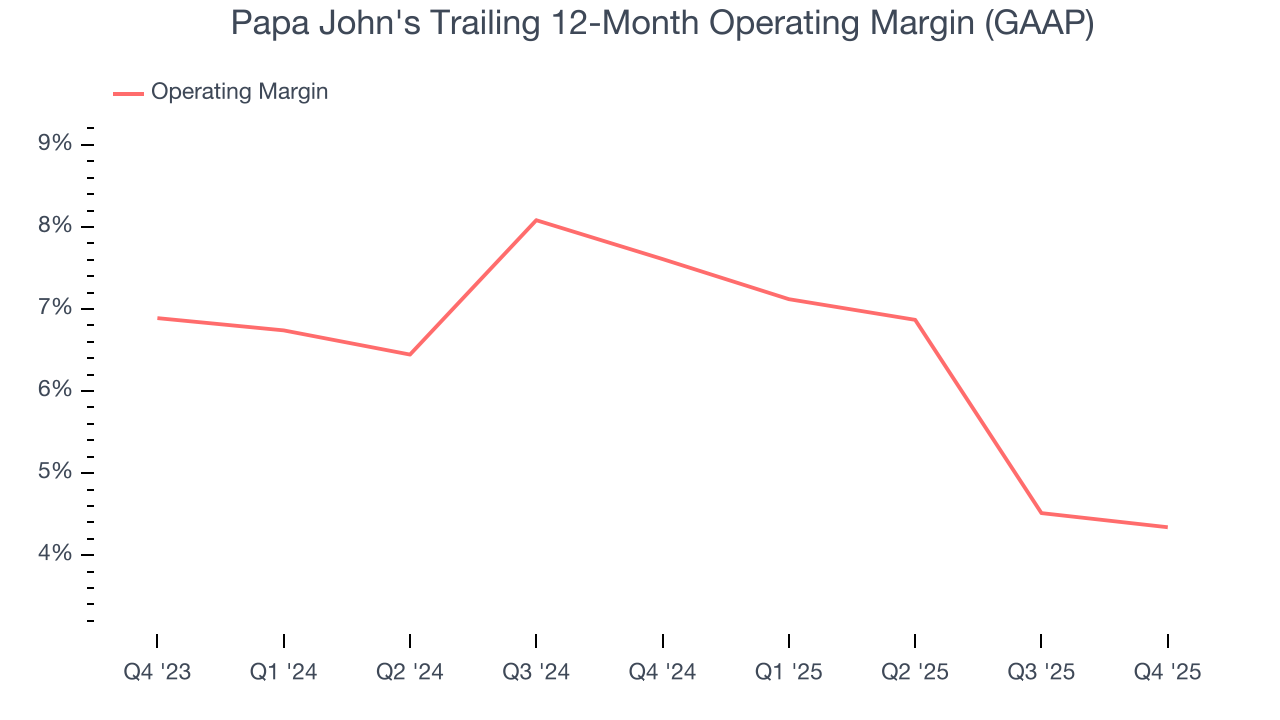
This quarter, Papa John's generated an operating margin profit margin of 4.9%, in line with the same quarter last year. This indicates the company’s cost structure has recently been stable.
9. Earnings Per Share
We track the long-term change in earnings per share (EPS) for the same reason as long-term revenue growth. Compared to revenue, however, EPS highlights whether a company’s growth is profitable.
Papa John’s unimpressive 3.4% annual EPS growth over the last six years aligns with its revenue performance. On the bright side, this tells us its incremental sales were profitable.
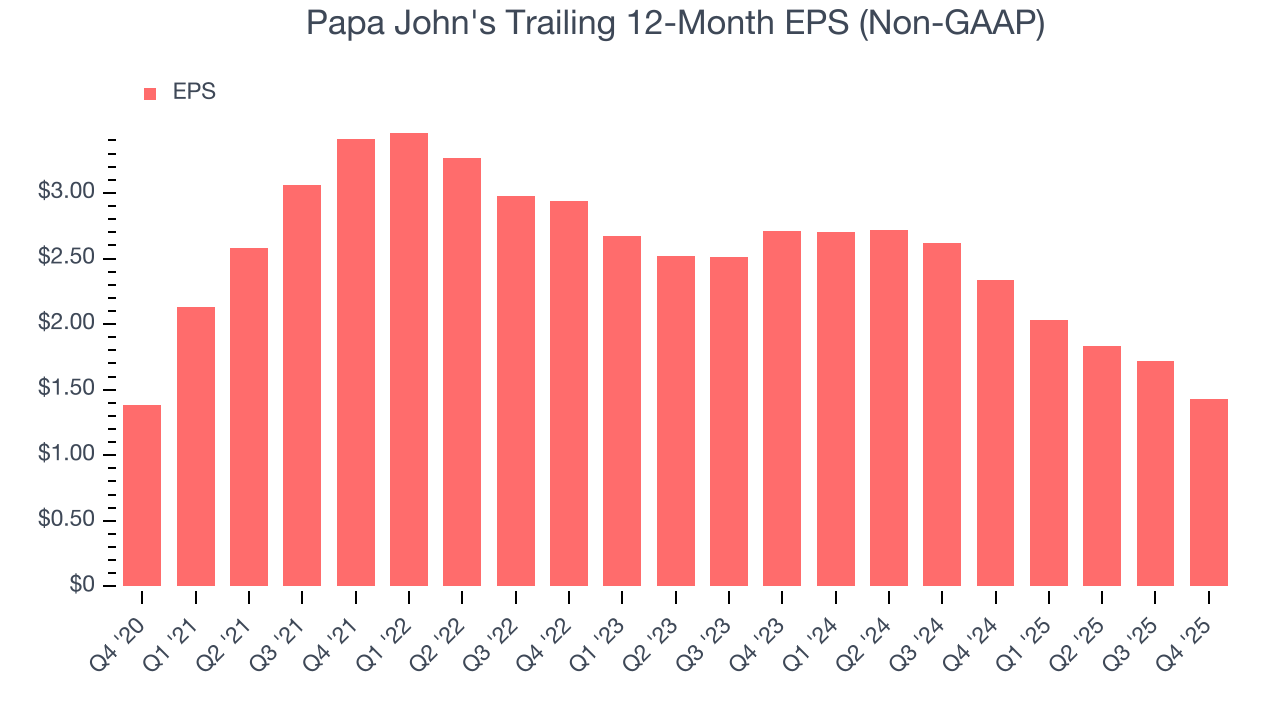
In Q4, Papa John's reported adjusted EPS of $0.34, down from $0.63 in the same quarter last year. Despite falling year on year, this print beat analysts’ estimates by 3.8%. Over the next 12 months, Wall Street expects Papa John’s full-year EPS of $1.43 to grow 30.1%.
10. Cash Is King
Free cash flow isn't a prominently featured metric in company financials and earnings releases, but we think it's telling because it accounts for all operating and capital expenses, making it tough to manipulate. Cash is king.
Papa John's has shown weak cash profitability over the last two years, giving the company limited opportunities to return capital to shareholders. Its free cash flow margin averaged 2.3%, subpar for a restaurant business.
Taking a step back, an encouraging sign is that Papa John’s margin expanded by 1.3 percentage points over the last year. The company’s improvement shows it’s heading in the right direction, and we can see it became a less capital-intensive business because its free cash flow profitability rose while its operating profitability fell.
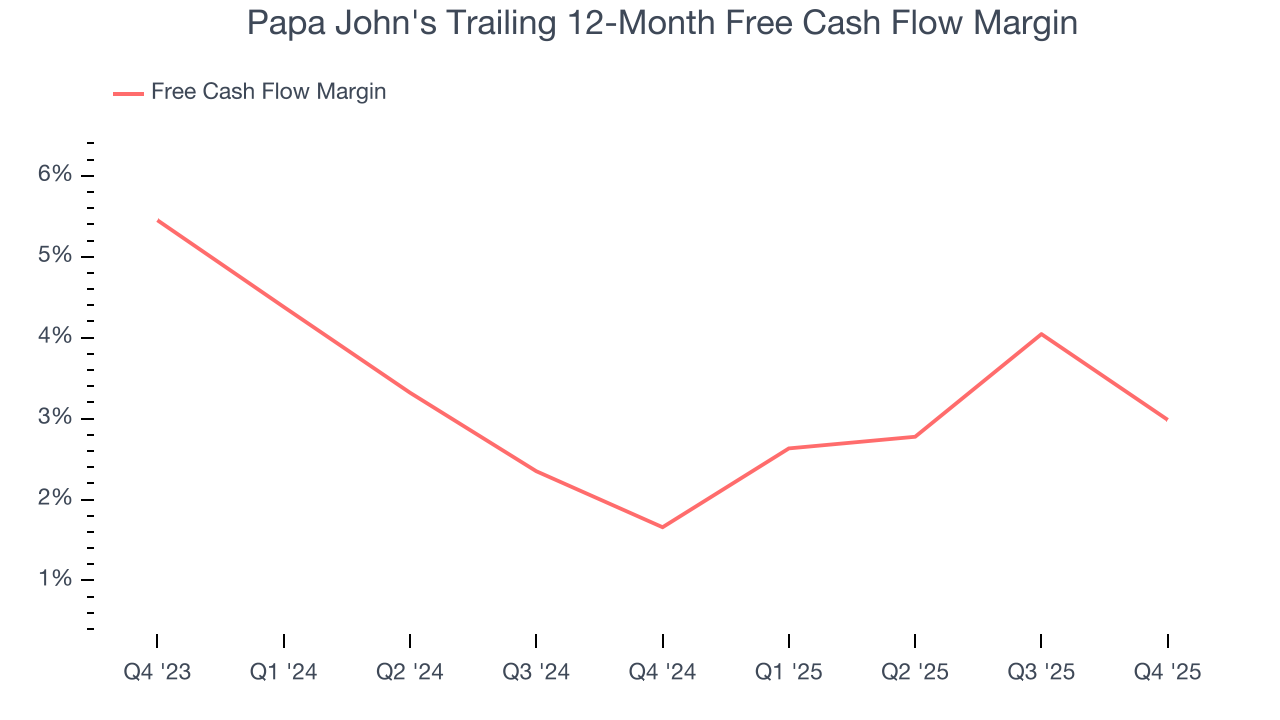
Papa John's broke even from a free cash flow perspective in Q4. The company’s cash profitability regressed as it was 4.3 percentage points lower than in the same quarter last year, prompting us to pay closer attention. Short-term fluctuations typically aren’t a big deal because investment needs can be seasonal, but we’ll be watching to see if the trend extrapolates into future quarters.
11. Return on Invested Capital (ROIC)
EPS and free cash flow tell us whether a company was profitable while growing its revenue. But was it capital-efficient? A company’s ROIC explains this by showing how much operating profit it makes compared to the money it has raised (debt and equity).
Although Papa John's hasn’t been the highest-quality company lately because of its poor top-line performance, it found a few growth initiatives in the past that worked out wonderfully. Its five-year average ROIC was 43.7%, splendid for a restaurant business.
12. Balance Sheet Assessment
Papa John's reported $36.95 million of cash and $936.4 million of debt on its balance sheet in the most recent quarter. As investors in high-quality companies, we primarily focus on two things: 1) that a company’s debt level isn’t too high and 2) that its interest payments are not excessively burdening the business.
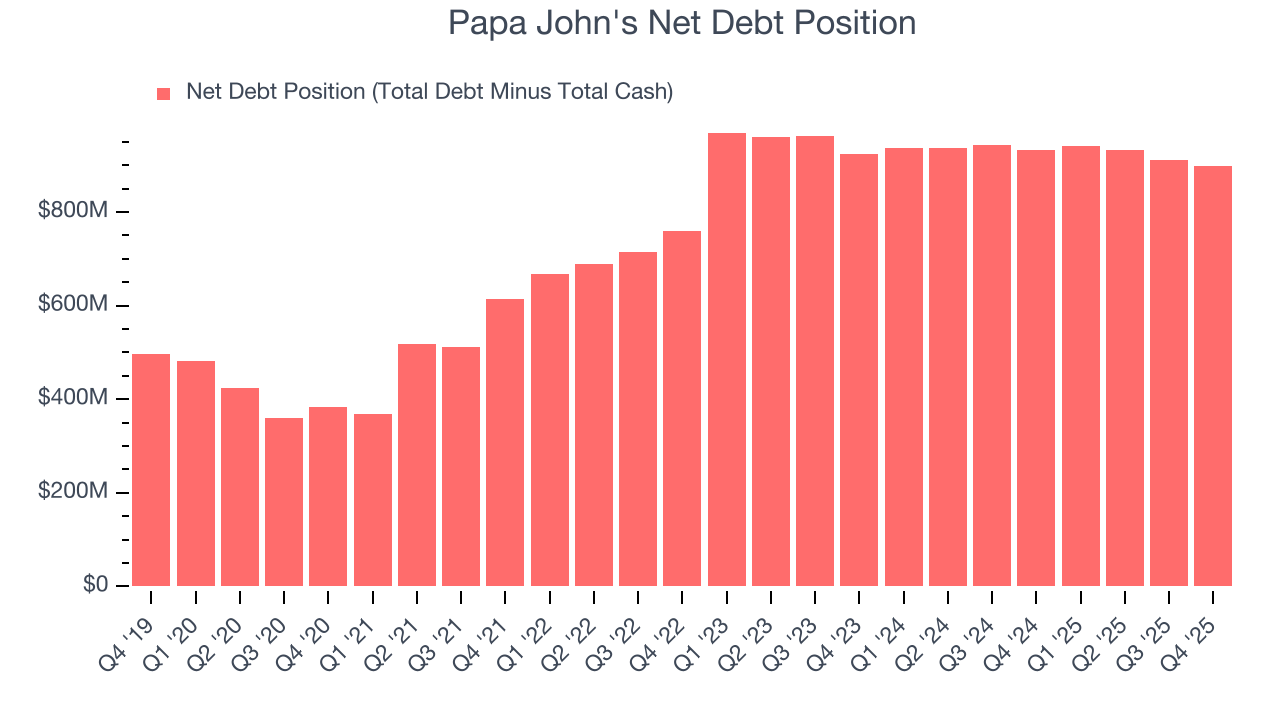
With $194.6 million of EBITDA over the last 12 months, we view Papa John’s 4.6× net-debt-to-EBITDA ratio as safe. We also see its $40.77 million of annual interest expenses as appropriate. The company’s profits give it plenty of breathing room, allowing it to continue investing in growth initiatives.
13. Key Takeaways from Papa John’s Q4 Results
We enjoyed seeing Papa John's beat analysts’ EBITDA expectations this quarter. On the other hand, its revenue missed and its full-year EBITDA guidance fell short of Wall Street’s estimates. Overall, this was a weaker quarter. The stock traded down 4.2% to $32.40 immediately after reporting.
14. Is Now The Time To Buy Papa John's?
Updated: March 14, 2026 at 10:52 PM EDT
We think that the latest earnings result is only one piece of the bigger puzzle. If you’re deciding whether to own Papa John's, you should also grasp the company’s longer-term business quality and valuation.
Papa John's doesn’t pass our quality test. To begin with, its revenue growth was uninspiring over the last six years, and analysts expect its demand to deteriorate over the next 12 months. While its stellar ROIC suggests it has been a well-run company historically, the downside is its shrinking same-store sales tell us it will need to change its strategy to succeed. On top of that, its projected EPS for the next year is lacking.
Papa John’s P/E ratio based on the next 12 months is 23.6x. While this valuation is reasonable, we don’t see a big opportunity at the moment. There are more exciting stocks to buy at the moment.
Wall Street analysts have a consensus one-year price target of $37.91 on the company (compared to the current share price of $36.73).