
QCR Holdings (QCRH)
QCR Holdings doesn’t impress us. Its revenue growth has been weak and its profitability has caved, showing it’s struggling to adapt.― StockStory Analyst Team
1. News


2. Summary
Why QCR Holdings Is Not Exciting
With roots dating back to 1993 and a name reflecting its original Quad Cities market, QCR Holdings (NASDAQGM:QCRH) operates four community banks across Iowa and Missouri, providing commercial, consumer banking, and trust services to businesses and individuals.
- Net interest income is projected to tank by 10.8% over the next 12 months as demand evaporates
- Day-to-day expenses have swelled relative to revenue over the last five years as its efficiency ratio increased by 6.2 percentage points
- On the plus side, its impressive 12.5% annual tangible book value per share growth over the last five years indicates it’s building equity value this cycle


QCR Holdings doesn’t check our boxes. We’d rather invest in businesses with stronger moats.
Why There Are Better Opportunities Than QCR Holdings


QCR Holdings is trading at $81.87 per share, or 1.1x forward P/B. The current valuation may be fair, but we’re still passing on this stock due to better alternatives out there.
We’d rather invest in similarly-priced but higher-quality companies with more reliable earnings growth.
3. QCR Holdings (QCRH) Research Report: Q4 CY2025 Update
Midwest regional bank QCR Holdings (NASDAQGM:QCRH) met Wall Streets revenue expectations in Q4 CY2025, with sales up 2.8% year on year to $107 million. Its non-GAAP profit of $2.21 per share was 11.3% above analysts’ consensus estimates.
QCR Holdings (QCRH) Q4 CY2025 Highlights:
- Net Interest Income: $68.35 million vs analyst estimates of $68.31 million (11.7% year-on-year growth, in line)
- Net Interest Margin: 3.1% vs analyst estimates of 3.6% (51 basis point miss)
- Revenue: $107 million vs analyst estimates of $106.9 million (2.8% year-on-year growth, in line)
- Efficiency Ratio: 58.7% vs analyst estimates of 53.3% (542.8 basis point miss)
- Adjusted EPS: $2.21 vs analyst estimates of $1.99 (11.3% beat)
- Tangible Book Value per Share: $57.86 vs analyst estimates of $57.68 (15.2% year-on-year growth, in line)
- Market Capitalization: $1.47 billion
Company Overview
With roots dating back to 1993 and a name reflecting its original Quad Cities market, QCR Holdings (NASDAQGM:QCRH) operates four community banks across Iowa and Missouri, providing commercial, consumer banking, and trust services to businesses and individuals.
QCR Holdings operates through four wholly-owned banking subsidiaries: Quad City Bank & Trust, Cedar Rapids Bank & Trust, Community State Bank, and Guaranty Bank. Each subsidiary serves distinct geographic markets across Iowa and Missouri, including the Quad Cities, Cedar Rapids, Waterloo/Cedar Falls, Des Moines/Ankeny, and Springfield/Joplin areas.
The company's business model centers on attracting deposits and investing them in loans and securities. QCR specializes in commercial and industrial (C&I) lending to small and mid-sized businesses across diverse sectors such as manufacturing, construction, business services, and retail. It also maintains a substantial commercial real estate portfolio, with approximately 39% dedicated to Low-Income Housing Tax Credit projects.
Beyond traditional banking, QCR offers specialized services through subsidiaries like m2 Equipment Finance, which provides machinery and equipment leasing to commercial clients. The company also offers wealth management services through its registered investment adviser subsidiary.
For businesses seeking capital, QCR might provide a line of credit to a local manufacturer expanding operations, term loans for a retailer purchasing a new location, or equipment financing for a construction company upgrading its fleet. For individual customers, services range from residential mortgages to personal loans and deposit accounts.
As a regulated financial institution, QCR must maintain specific capital requirements and comply with oversight from multiple regulatory bodies, including the Federal Reserve, FDIC, and state banking authorities in Iowa and Missouri.
4. Regional Banks
Regional banks, financial institutions operating within specific geographic areas, serve as intermediaries between local depositors and borrowers. They benefit from rising interest rates that improve net interest margins (the difference between loan yields and deposit costs), digital transformation reducing operational expenses, and local economic growth driving loan demand. However, these banks face headwinds from fintech competition, deposit outflows to higher-yielding alternatives, credit deterioration (increasing loan defaults) during economic slowdowns, and regulatory compliance costs. Recent concerns about regional bank stability following high-profile failures and significant commercial real estate exposure present additional challenges.
QCR Holdings competes with other regional banks operating in the Midwest, including Heartland Financial USA (NASDAQ:HTLF), Old National Bancorp (NASDAQ:ONB), and First Midwest Bancorp, as well as larger national banks with regional presence like U.S. Bancorp (NYSE:USB) and Wells Fargo (NYSE:WFC).
5. Sales Growth
Two primary revenue streams drive bank earnings. While net interest income, which is earned by charging higher rates on loans than paid on deposits, forms the foundation, fee-based services across banking, credit, wealth management, and trading operations provide additional income. Regrettably, QCR Holdings’s revenue grew at a tepid 7% compounded annual growth rate over the last five years. This was below our standard for the banking sector and is a tough starting point for our analysis.
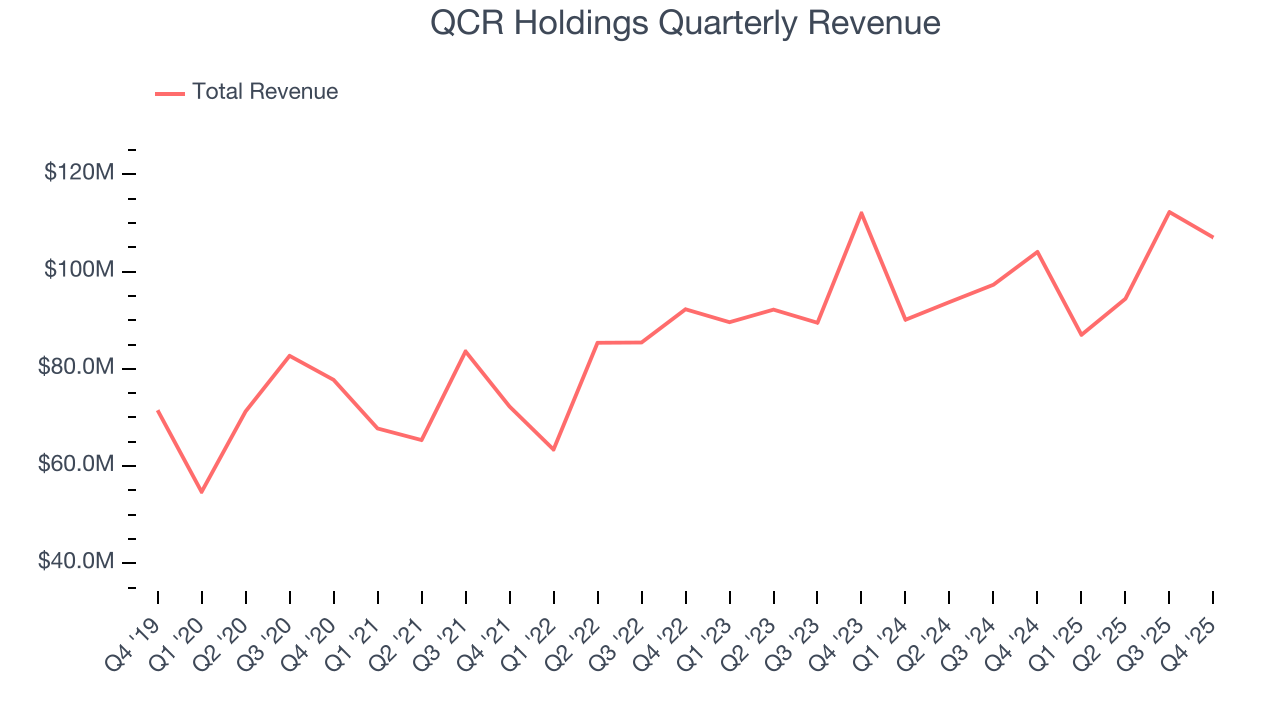
Long-term growth is the most important, but within financials, a half-decade historical view may miss recent interest rate changes and market returns. QCR Holdings’s recent performance shows its demand has slowed as its annualized revenue growth of 2.2% over the last two years was below its five-year trend. 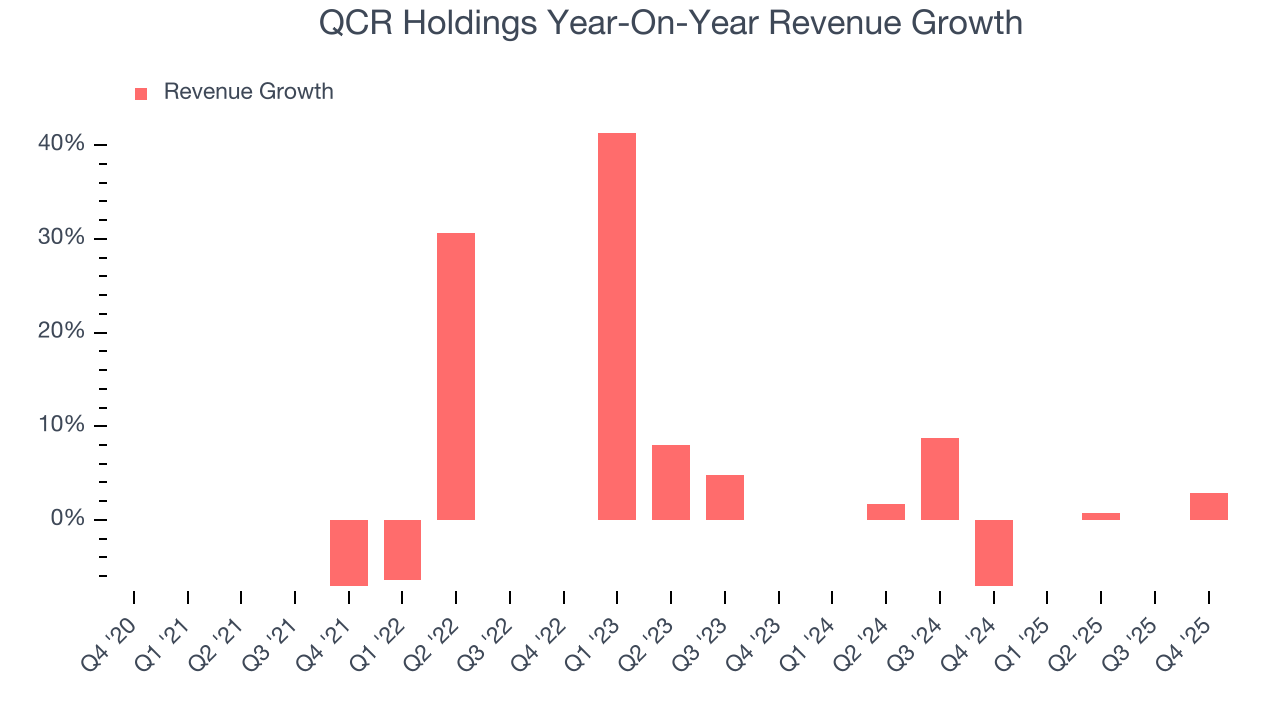 Note: Quarters not shown were determined to be outliers, impacted by outsized investment gains/losses that are not indicative of the recurring fundamentals of the business.
This quarter, QCR Holdings grew its revenue by 2.8% year on year, and its $107 million of revenue was in line with Wall Street’s estimates.
Net interest income made up 63.1% of the company’s total revenue during the last five years, meaning lending operations are QCR Holdings’s largest source of revenue.
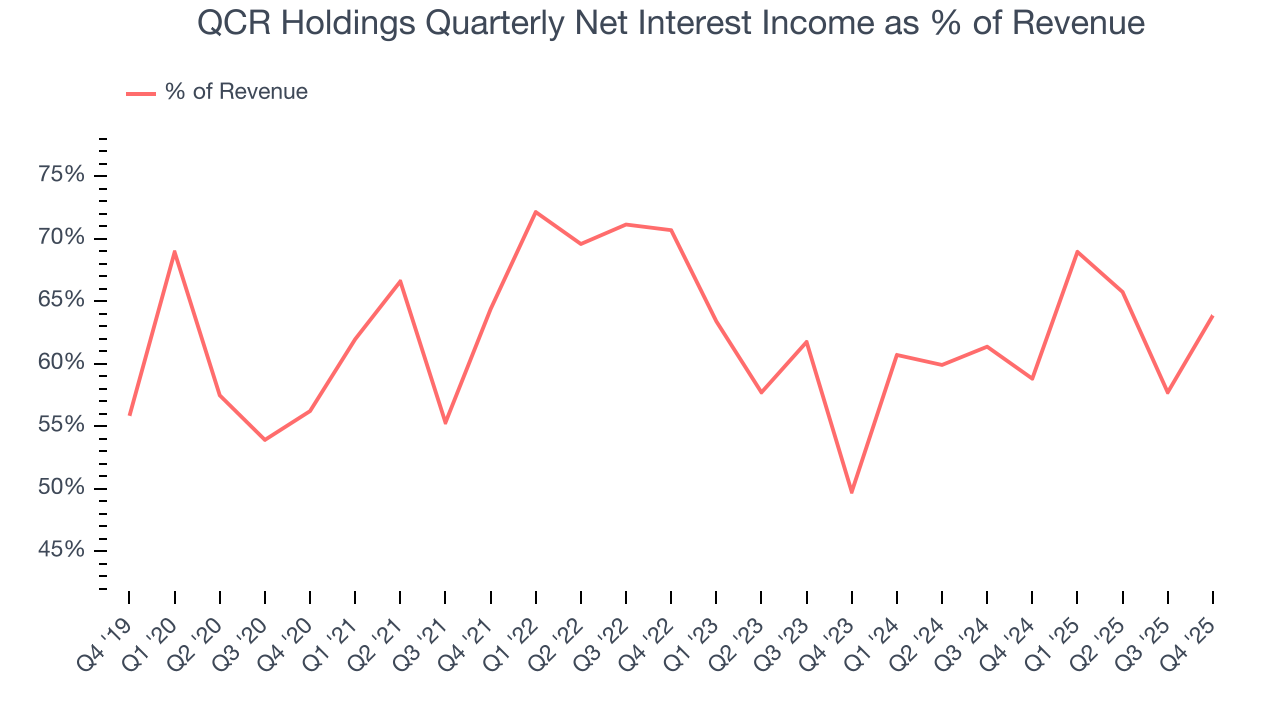
While banks generate revenue from multiple sources, investors view net interest income as the cornerstone - its predictable, recurring characteristics stand in sharp contrast to the volatility of non-interest income.
6. Efficiency Ratio
Topline growth carries importance, but the overall profitability behind this expansion determines true value creation. For banks, the efficiency ratio captures this relationship by measuring non-interest expenses, including salaries, facilities, technology, and marketing, against total revenue.
Investors focus on efficiency ratio changes rather than absolute levels, understanding that expense structures vary by revenue mix. Counterintuitively, lower efficiency ratios indicate better performance since they represent lower costs relative to revenue.
Over the last five years, QCR Holdings’s efficiency ratio has increased by 6.2 percentage points, going from 54.9% to 58.3%. Said differently, the company’s expenses have increased at a faster rate than revenue, which usually raises questions unless the company is in high-growth mode and reinvesting its profits into attractive ventures.
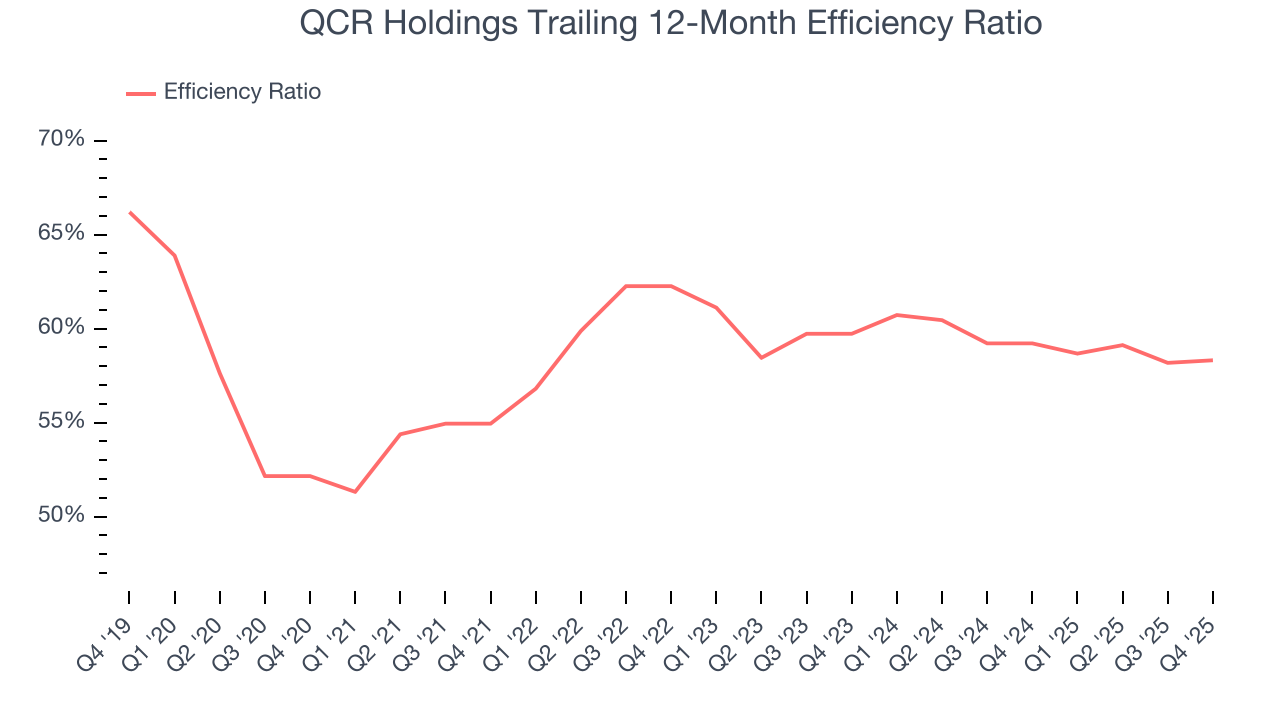
In Q4, QCR Holdings’s efficiency ratio was 58.7%, falling short of analysts’ expectations by 542.8 basis points (100 basis points = 1 percentage point).
For the next 12 months, Wall Street expects QCR Holdings to rein in some of its expenses as it anticipates an efficiency ratio of 54%.
7. Earnings Per Share
We track the long-term change in earnings per share (EPS) for the same reason as long-term revenue growth. Compared to revenue, however, EPS highlights whether a company’s growth is profitable.
QCR Holdings’s EPS grew at a remarkable 14% compounded annual growth rate over the last five years, higher than its 7% annualized revenue growth. This tells us the company became more profitable on a per-share basis as it expanded.
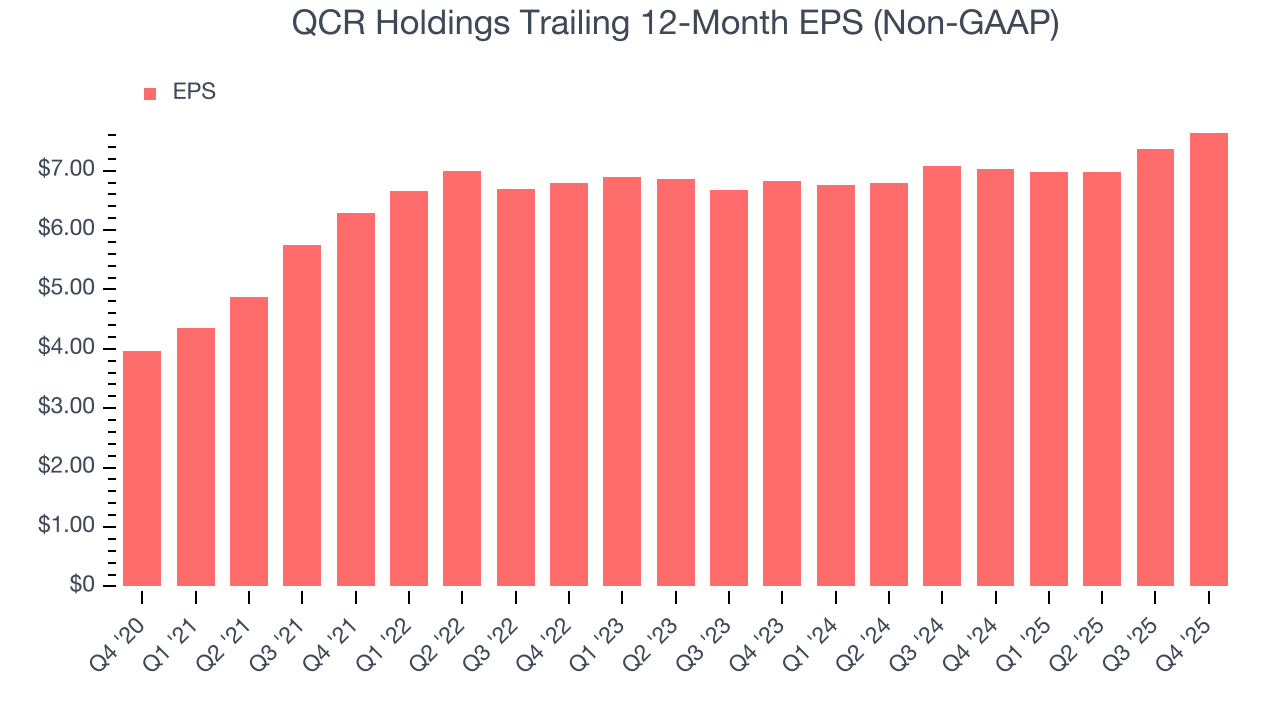
Like with revenue, we analyze EPS over a more recent period because it can provide insight into an emerging theme or development for the business.
For QCR Holdings, its two-year annual EPS growth of 5.8% was lower than its five-year trend. We hope its growth can accelerate in the future.
In Q4, QCR Holdings reported adjusted EPS of $2.21, up from $1.93 in the same quarter last year. This print easily cleared analysts’ estimates, and shareholders should be content with the results. Over the next 12 months, Wall Street expects QCR Holdings’s full-year EPS of $7.64 to grow 3.7%.
8. Tangible Book Value Per Share (TBVPS)
The balance sheet drives banking profitability since earnings flow from the spread between borrowing and lending rates. As such, valuations for these companies concentrate on capital strength and sustainable equity accumulation potential.
When analyzing banks, tangible book value per share (TBVPS) takes precedence over many other metrics. This measure isolates genuine per-share value by removing intangible assets of debatable liquidation worth. On the other hand, EPS is often distorted by mergers and flexible loan loss accounting. TBVPS provides clearer performance insights.
QCR Holdings’s TBVPS grew at an incredible 12.5% annual clip over the last five years. TBVPS growth has also accelerated recently, growing by 14.9% annually over the last two years from $43.81 to $57.86 per share.
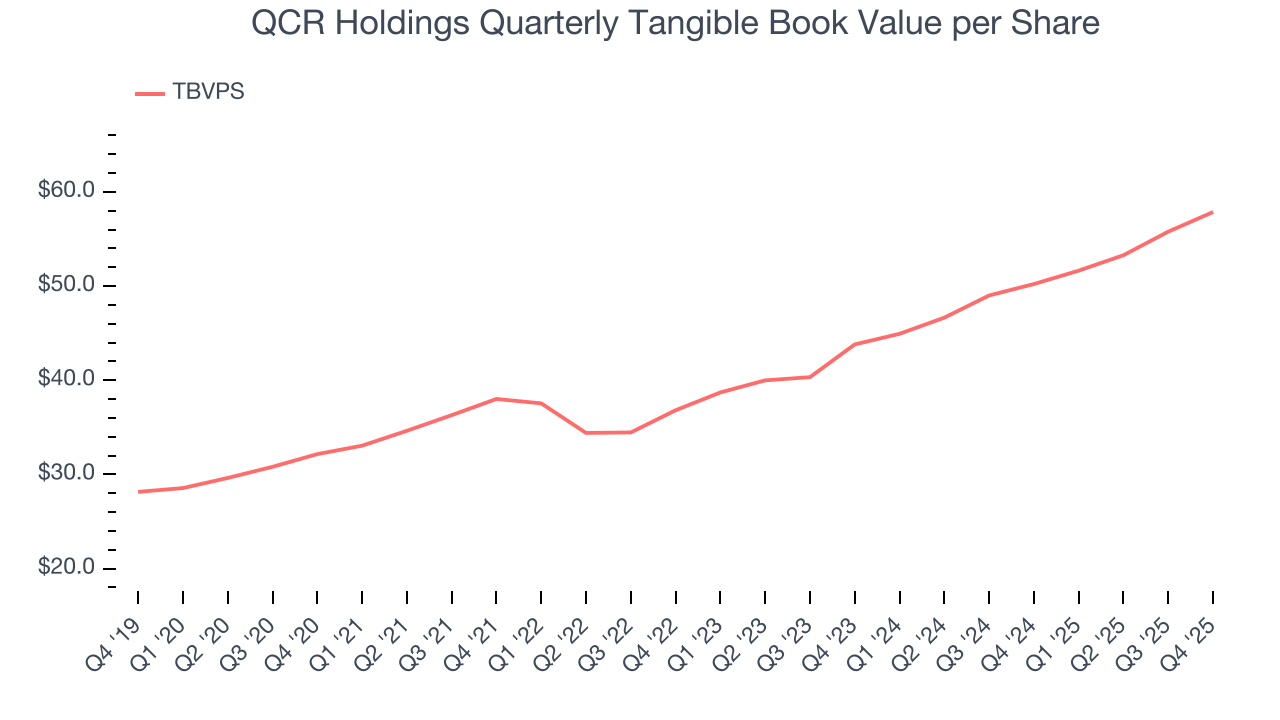
Over the next 12 months, Consensus estimates call for QCR Holdings’s TBVPS to grow by 12.8% to $65.26, decent growth rate.
9. Balance Sheet Assessment
Leverage is core to a financial firm’s business model (loans funded by deposits). To ensure economic stability and avoid a repeat of the 2008 GFC, regulators require certain levels of capital and liquidity, focusing on the Tier 1 capital ratio.
Tier 1 capital is the highest-quality capital that a firm holds, consisting primarily of common stock and retained earnings, but also physical gold. It serves as the primary cushion against losses and is the first line of defense in times of financial distress.
This capital is divided by risk-weighted assets to derive the Tier 1 capital ratio. Risk-weighted means that cash and US treasury securities are assigned little risk while unsecured consumer loans and equity investments get much higher risk weights, for example.
New regulation after the 2008 financial crisis requires that all firms must maintain a Tier 1 capital ratio greater than 4.5%. On top of this, there are additional buffers based on scale, risk profile, and other regulatory classifications, so that at the end of the day, firms generally must maintain a 7-10% ratio at minimum.
Over the last two years, QCR Holdings has averaged a Tier 1 capital ratio of 10.2%, which is considered safe and well capitalized in the event that macro or market conditions suddenly deteriorate.
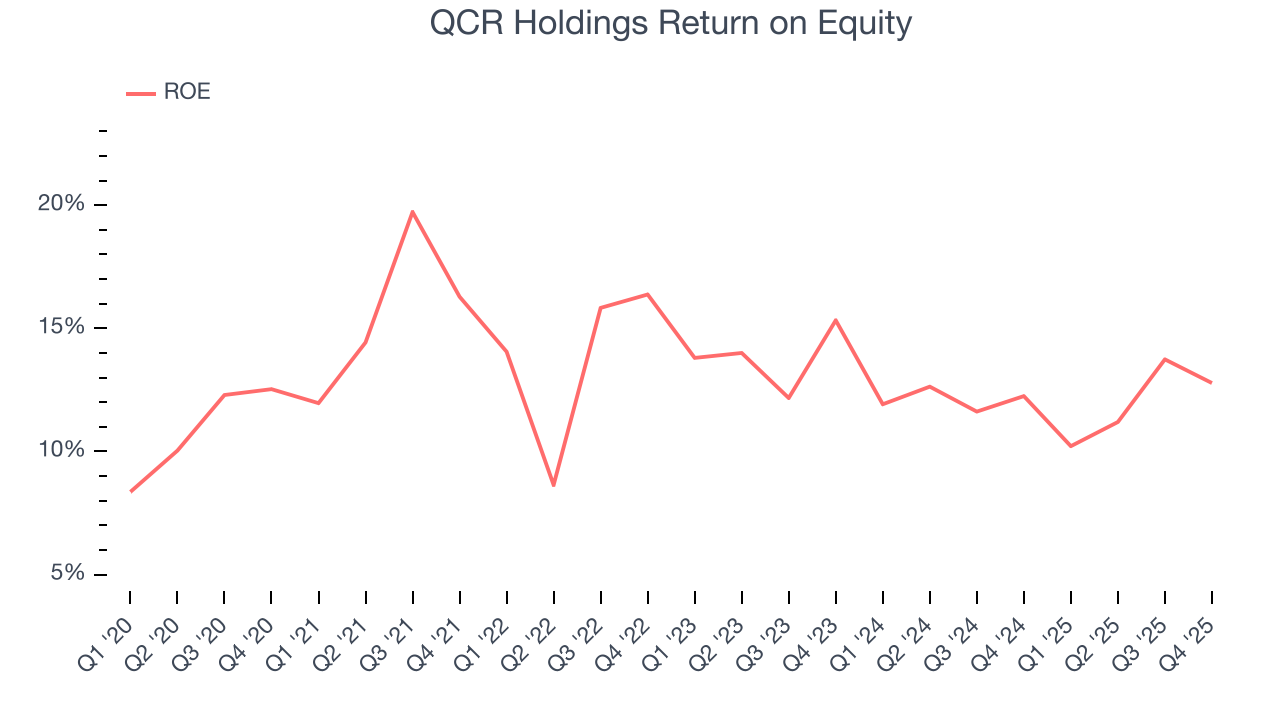
10. Return on Equity
Return on equity, or ROE, tells us how much profit a company generates for each dollar of shareholder equity, a key funding source for banks. Over a long period, banks with high ROE tend to compound shareholder wealth faster through retained earnings, buybacks, and dividends.
Over the last five years, QCR Holdings has averaged an ROE of 13.4%, healthy for a company operating in a sector where the average shakes out around 7.5% and those putting up 15%+ are greatly admired. This is a bright spot for QCR Holdings.
11. Key Takeaways from QCR Holdings’s Q4 Results
It was good to see QCR Holdings beat analysts’ EPS expectations this quarter. Overall, this print had some key positives. The stock remained flat at $88.06 immediately following the results.
12. Is Now The Time To Buy QCR Holdings?
Updated: March 15, 2026 at 12:12 AM EDT
A common mistake we notice when investors are deciding whether to buy a stock or not is that they simply look at the latest earnings results. Business quality and valuation matter more, so we urge you to understand these dynamics as well.
QCR Holdings isn’t a bad business, but we have other favorites. Although its revenue growth was uninspiring over the last five years, its TBVPS growth was exceptional over the last five years. Tread carefully with this one, however, as its estimated net interest income for the next 12 months are weak.
QCR Holdings’s P/B ratio based on the next 12 months is 1.1x. This valuation is reasonable, but the company’s shakier fundamentals present too much downside risk. We're pretty confident there are more exciting stocks to buy at the moment.
Wall Street analysts have a consensus one-year price target of $102.60 on the company (compared to the current share price of $81.87).