
Sanmina (SANM)
Sanmina doesn’t excite us. Its poor sales growth and falling returns on capital suggest its growth opportunities are shrinking.― StockStory Analyst Team
1. News


2. Summary
Why Sanmina Is Not Exciting
Founded in 1980, Sanmina (NASDAQ:SANM) is an electronics manufacturing services company offering end-to-end solutions for various industries.
- Competitive supply chain dynamics and steep production costs are reflected in its low gross margin of 8.2%
- Ability to fund investments or reward shareholders with increased buybacks or dividends is restricted by its weak free cash flow margin of 3.1% for the last five years
- A positive is that its projected revenue growth of 58.2% for the next 12 months is above its two-year trend, pointing to accelerating demand


Sanmina doesn’t check our boxes. There are more rewarding stocks elsewhere.
Why There Are Better Opportunities Than Sanmina


Sanmina is trading at $125.26 per share, or 11.9x forward P/E. Yes, this valuation multiple is lower than that of other industrials peers, but we’ll remind you that you often get what you pay for.
Cheap stocks can look like great bargains at first glance, but you often get what you pay for. These mediocre businesses often have less earnings power, meaning there is more reliance on a re-rating to generate good returns - an unlikely scenario for low-quality companies.
3. Sanmina (SANM) Research Report: Q4 CY2025 Update
Electronics manufacturing services company Sanmina (NASDAQ:SANM) reported Q4 CY2025 results beating Wall Street’s revenue expectations, with sales up 59% year on year to $3.19 billion. On the other hand, next quarter’s revenue guidance of $3.25 billion was less impressive, coming in 7.6% below analysts’ estimates. Its non-GAAP profit of $2.38 per share was 11% above analysts’ consensus estimates.
Sanmina (SANM) Q4 CY2025 Highlights:
- Revenue: $3.19 billion vs analyst estimates of $3.09 billion (59% year-on-year growth, 3.3% beat)
- Adjusted EPS: $2.38 vs analyst estimates of $2.15 (11% beat)
- Adjusted EBITDA: $136.7 million vs analyst estimates of $225.7 million (4.3% margin, 39.4% miss)
- Revenue Guidance for Q1 CY2026 is $3.25 billion at the midpoint, below analyst estimates of $3.52 billion
- Adjusted EPS guidance for Q1 CY2026 is $2.40 at the midpoint, above analyst estimates of $2.34
- Operating Margin: 2.3%, down from 4.5% in the same quarter last year
- Free Cash Flow Margin: 2.9%, similar to the same quarter last year
- Market Capitalization: $9.7 billion
Company Overview
Founded in 1980, Sanmina (NASDAQ:SANM) is an electronics manufacturing services company offering end-to-end solutions for various industries.
Initially focusing on printed circuit boards, Sanmina expanded through strategic acquisitions and diversification, enabling it to provide end-to-end manufacturing solutions across various high-tech sectors. One significant merger was with SCI Systems in 2001, significantly expanding its capabilities and global footprint.
Sanmina offers a diverse suite of services designed to enhance the productivity and efficiency of businesses across several sectors including industrial manufacturing, medical, defense and aerospace, and communications networks. Its product offerings range from electronic components like printed circuit boards and backplanes to complex systems such as medical devices and communications hardware. Additionally, Sanmina provides services including product design, engineering, direct order fulfillment, and after-market services. For example, its advanced manufacturing products cater to the aerospace industry where precision and reliability are critical.
Sanmina's revenue primarily stems from its long-term supply agreements with major OEM customers. These agreements typically last three to five years, though they often don't require the customer to commit to minimum purchase volumes. This can lead to some variability in revenue, but it's mitigated by clauses that make the customer responsible for the cost of materials ordered based on their forecasts, even if those materials are not ultimately used.
This structure supports recurring revenue streams by ensuring that, while individual orders might fluctuate, the overall relationship and contractual obligations continue over a multi-year period. This setup helps stabilize Sanmina's revenue generation, making it less susceptible to short-term market fluctuations and more reliant on long-term strategic partnerships.
4. Electrical Systems
Like many equipment and component manufacturers, electrical systems companies are buoyed by secular trends such as connectivity and industrial automation. More specific pockets of strong demand include Internet of Things (IoT) connectivity and the 5G telecom upgrade cycle, which can benefit companies whose cables and conduits fit those needs. But like the broader industrials sector, these companies are also at the whim of economic cycles. Interest rates, for example, can greatly impact projects that drive demand for these products.
Competitors of Sanmina in the electronics manufacturing services (EMS) industry include Flex (NASDAQ:FLEX), Javil (NYSE:JBL), and Celestica (NYSE:CLS).
5. Revenue Growth
A company’s long-term performance is an indicator of its overall quality. Any business can have short-term success, but a top-tier one grows for years. Over the last five years, Sanmina grew its sales at a mediocre 6.3% compounded annual growth rate. This fell short of our benchmark for the industrials sector and is a poor baseline for our analysis.
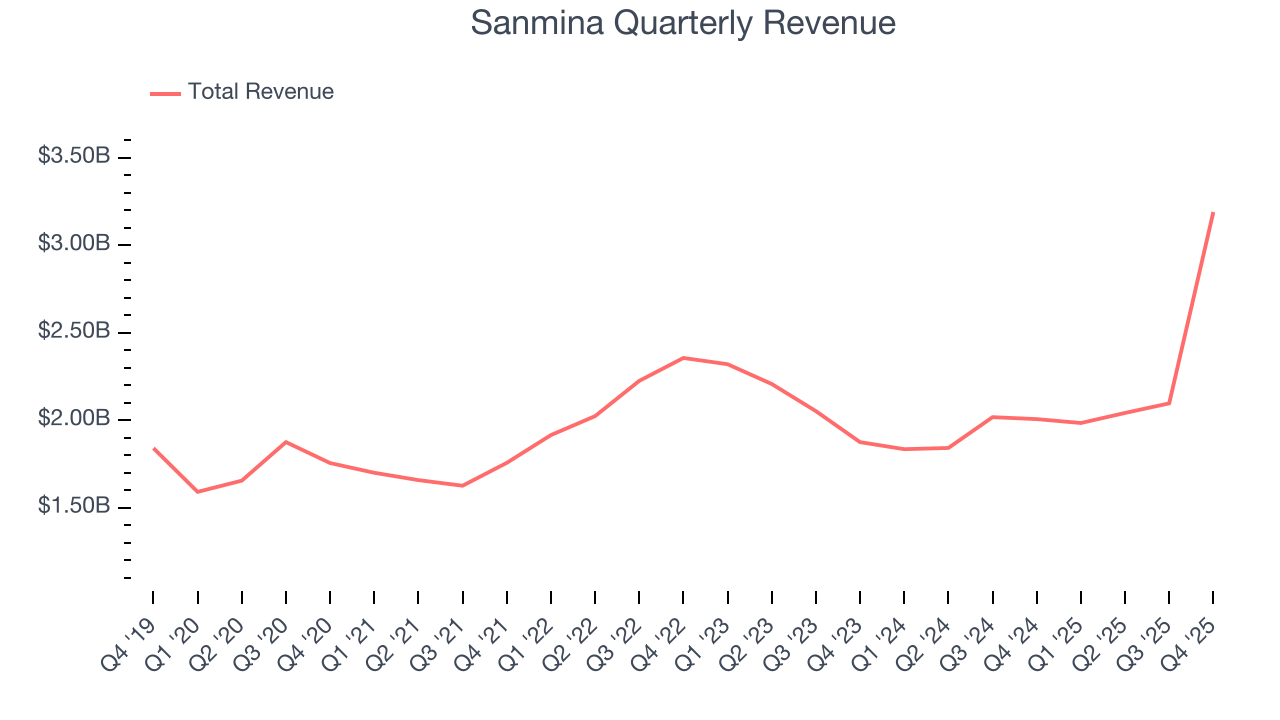
Long-term growth is the most important, but within industrials, a half-decade historical view may miss new industry trends or demand cycles. Sanmina’s recent performance shows its demand has slowed as its annualized revenue growth of 5% over the last two years was below its five-year trend. 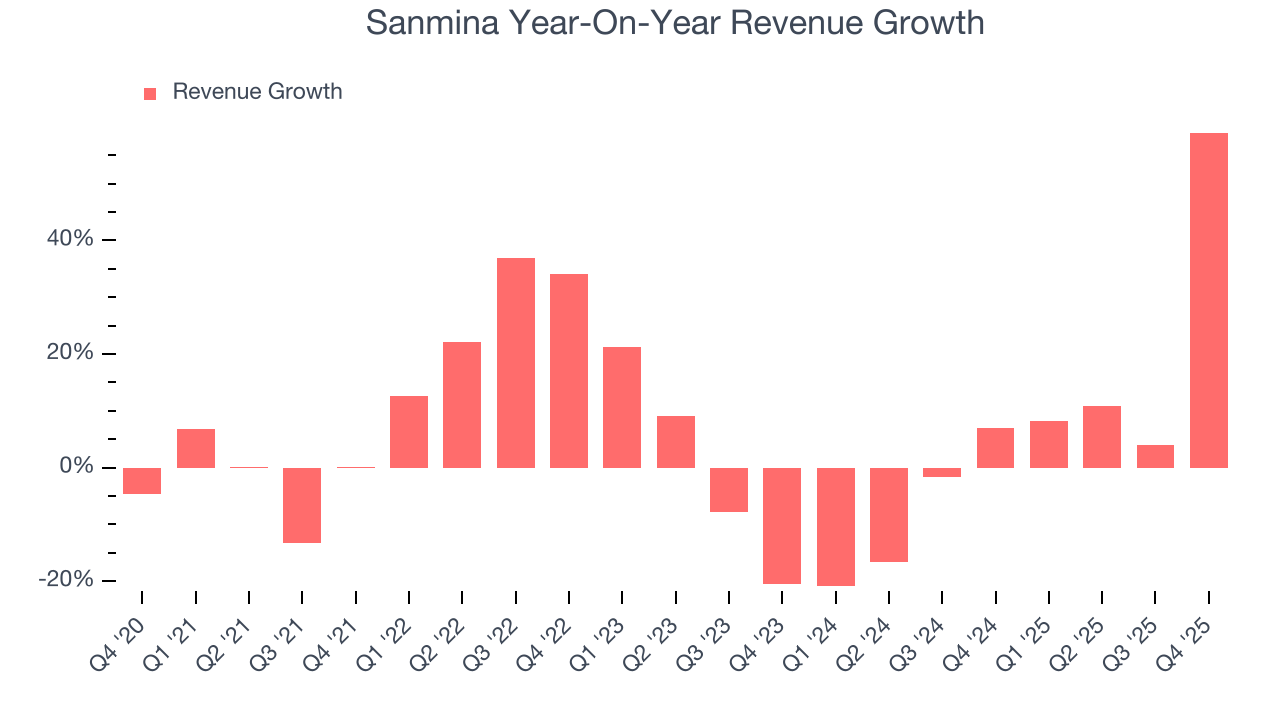
This quarter, Sanmina reported magnificent year-on-year revenue growth of 59%, and its $3.19 billion of revenue beat Wall Street’s estimates by 3.3%. Company management is currently guiding for a 63.8% year-on-year increase in sales next quarter.
Looking further ahead, sell-side analysts expect revenue to grow 59.4% over the next 12 months, an improvement versus the last two years. This projection is eye-popping and indicates its newer products and services will catalyze better top-line performance.
6. Gross Margin & Pricing Power
Sanmina has bad unit economics for an industrials business, signaling it operates in a competitive market. As you can see below, it averaged a 8.2% gross margin over the last five years. That means Sanmina paid its suppliers a lot of money ($91.77 for every $100 in revenue) to run its business. 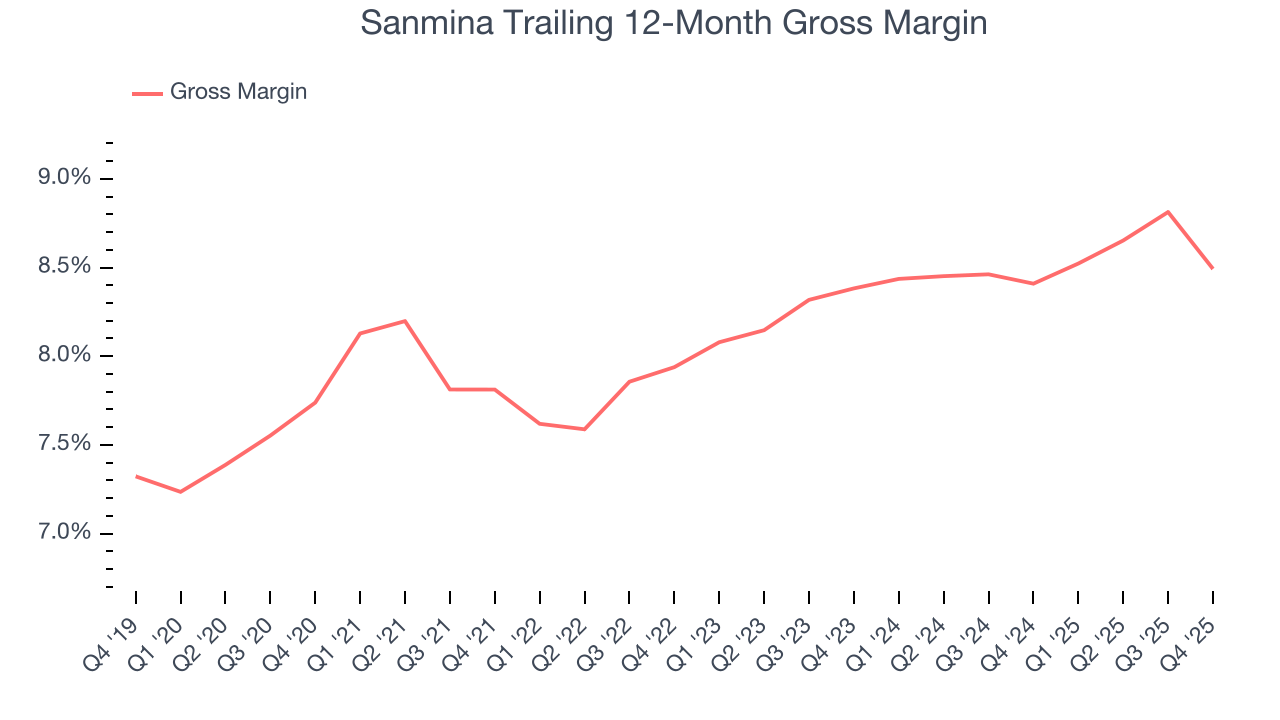
Sanmina’s gross profit margin came in at 7.6% this quarter, in line with the same quarter last year. Zooming out, the company’s full-year margin has remained steady over the past 12 months, suggesting its input costs (such as raw materials and manufacturing expenses) have been stable and it isn’t under pressure to lower prices.
7. Operating Margin
Sanmina’s operating margin might fluctuated slightly over the last 12 months but has remained more or less the same, averaging 4.5% over the last five years. This profitability was lousy for an industrials business and caused by its suboptimal cost structureand low gross margin.
Analyzing the trend in its profitability, Sanmina’s operating margin might fluctuated slightly but has generally stayed the same over the last five years. This raises questions about the company’s expense base because its revenue growth should have given it leverage on its fixed costs, resulting in better economies of scale and profitability.
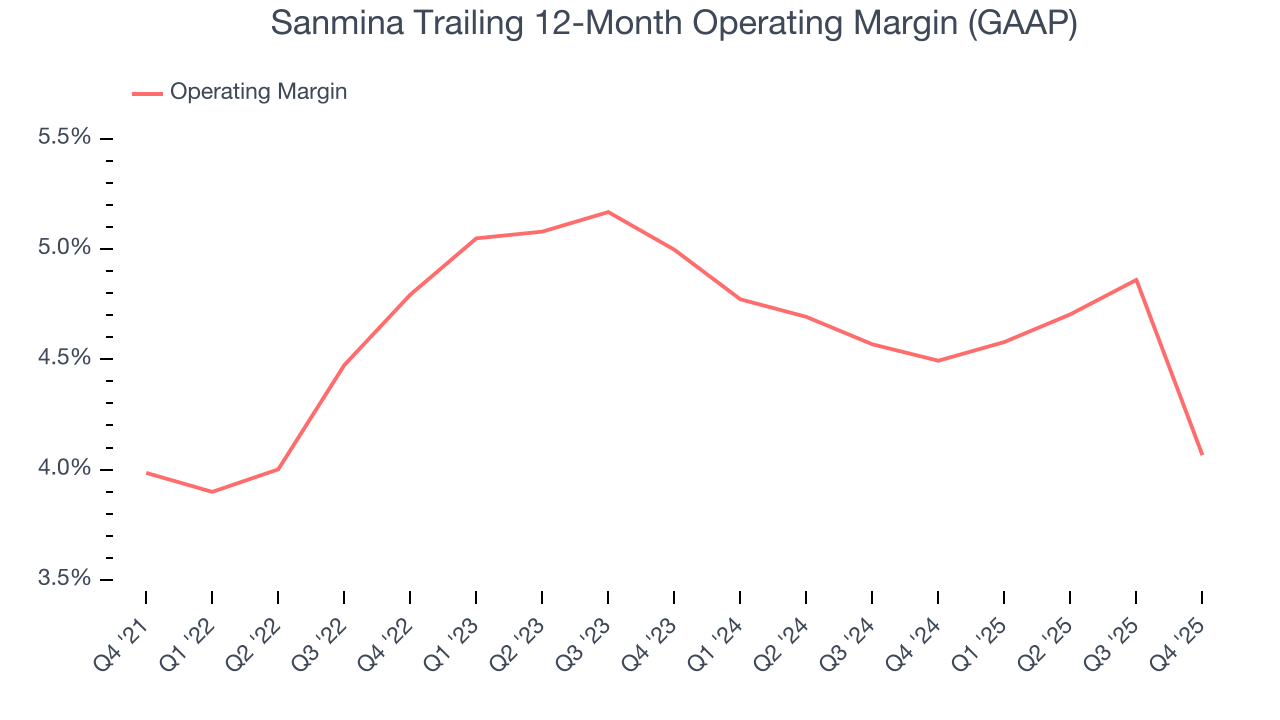
In Q4, Sanmina generated an operating margin profit margin of 2.3%, down 2.2 percentage points year on year. Since Sanmina’s operating margin decreased more than its gross margin, we can assume it was less efficient because expenses such as marketing, R&D, and administrative overhead increased.
8. Earnings Per Share
Revenue trends explain a company’s historical growth, but the long-term change in earnings per share (EPS) points to the profitability of that growth – for example, a company could inflate its sales through excessive spending on advertising and promotions.
Sanmina’s EPS grew at a spectacular 16.2% compounded annual growth rate over the last five years, higher than its 6.3% annualized revenue growth. However, this alone doesn’t tell us much about its business quality because its operating margin didn’t improve.
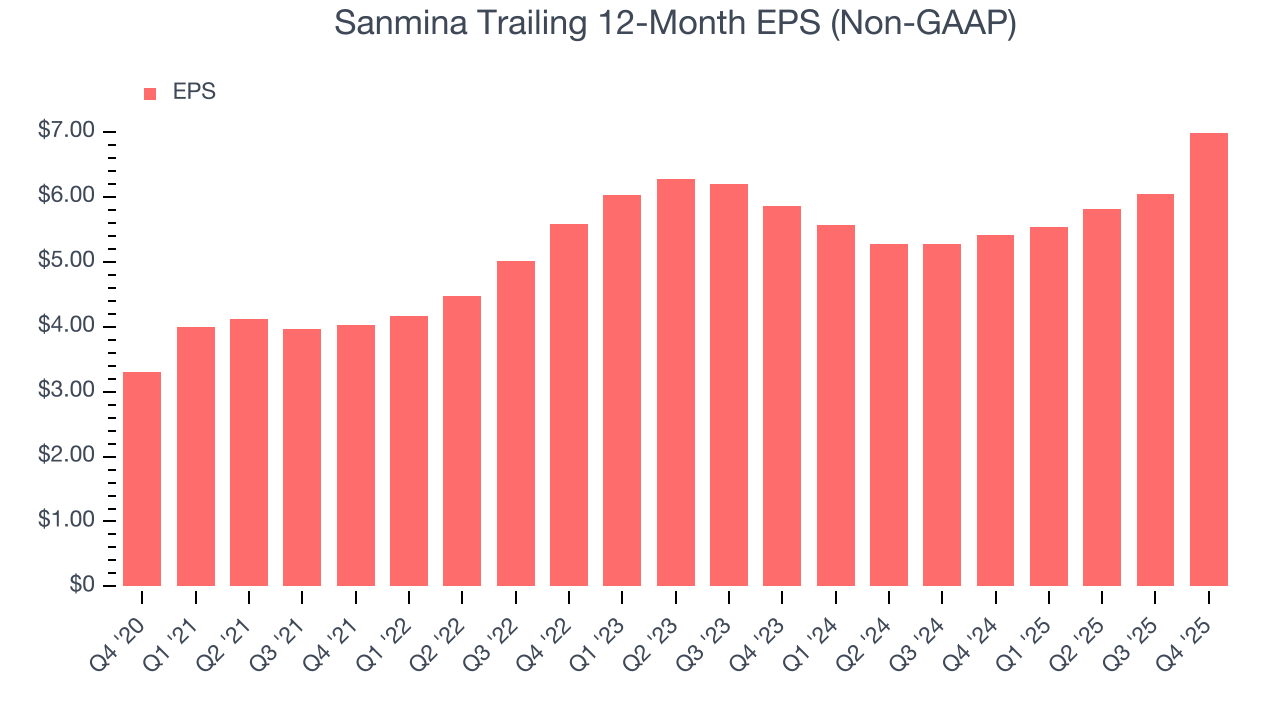
We can take a deeper look into Sanmina’s earnings to better understand the drivers of its performance. A five-year view shows that Sanmina has repurchased its stock, shrinking its share count by 16.9%. This tells us its EPS outperformed its revenue not because of increased operational efficiency but financial engineering, as buybacks boost per share earnings. 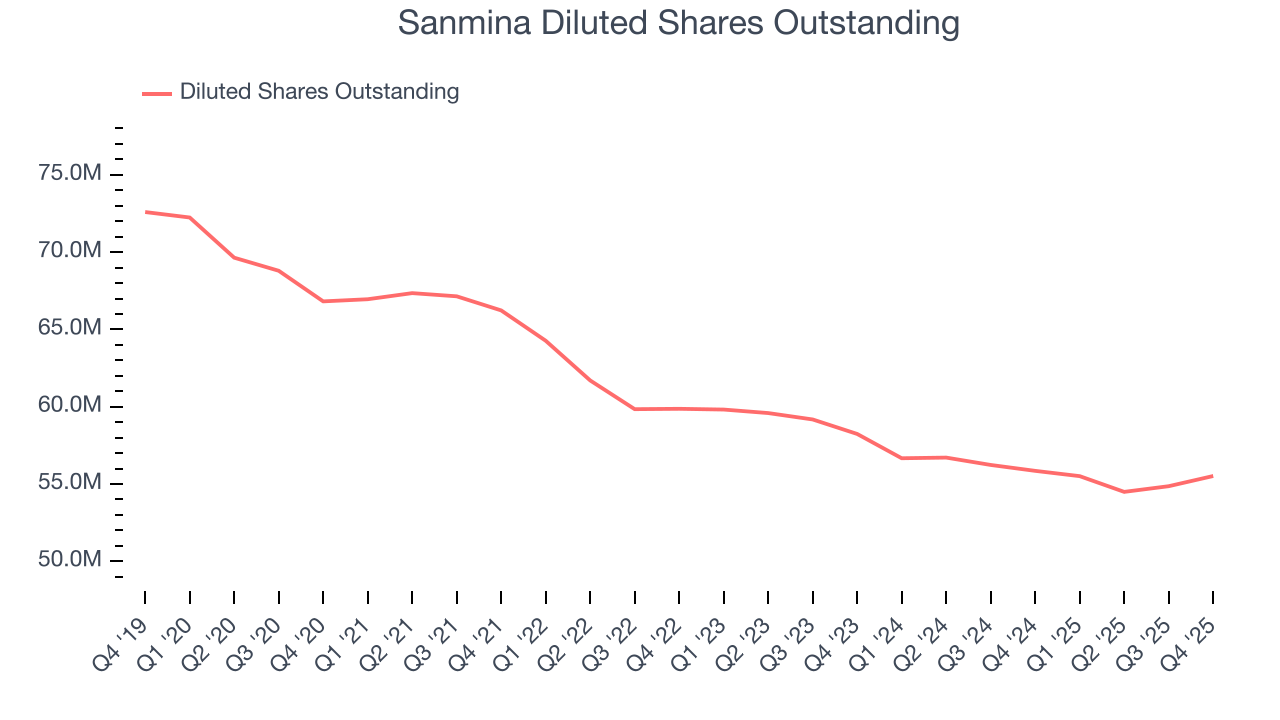
Like with revenue, we analyze EPS over a more recent period because it can provide insight into an emerging theme or development for the business.
For Sanmina, its two-year annual EPS growth of 9.2% was lower than its five-year trend. We hope its growth can accelerate in the future.
In Q4, Sanmina reported adjusted EPS of $2.38, up from $1.44 in the same quarter last year. This print easily cleared analysts’ estimates, and shareholders should be content with the results. Over the next 12 months, Wall Street expects Sanmina’s full-year EPS of $6.99 to grow 45.1%.
9. Cash Is King
Free cash flow isn't a prominently featured metric in company financials and earnings releases, but we think it's telling because it accounts for all operating and capital expenses, making it tough to manipulate. Cash is king.
Sanmina has shown weak cash profitability over the last five years, giving the company limited opportunities to return capital to shareholders. Its free cash flow margin averaged 3.1%, subpar for an industrials business.
Taking a step back, an encouraging sign is that Sanmina’s margin expanded by 1.7 percentage points during that time. The company’s improvement shows it’s heading in the right direction, and we can see it became a less capital-intensive business because its free cash flow profitability rose while its operating profitability was flat.
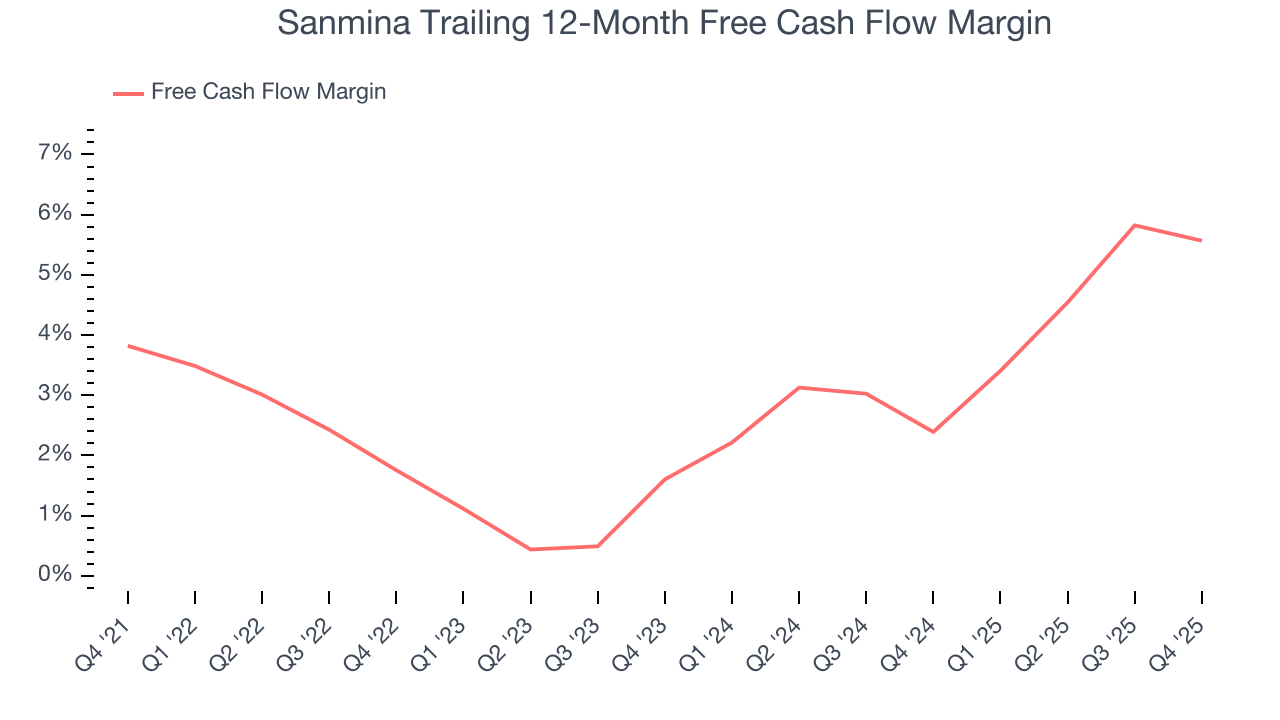
Sanmina’s free cash flow clocked in at $91.96 million in Q4, equivalent to a 2.9% margin. This cash profitability was in line with the comparable period last year and its five-year average.
10. Return on Invested Capital (ROIC)
EPS and free cash flow tell us whether a company was profitable while growing its revenue. But was it capital-efficient? A company’s ROIC explains this by showing how much operating profit it makes compared to the money it has raised (debt and equity).
Although Sanmina hasn’t been the highest-quality company lately, it historically found a few growth initiatives that worked out well. Its five-year average ROIC was 16.8%, impressive for an industrials business.
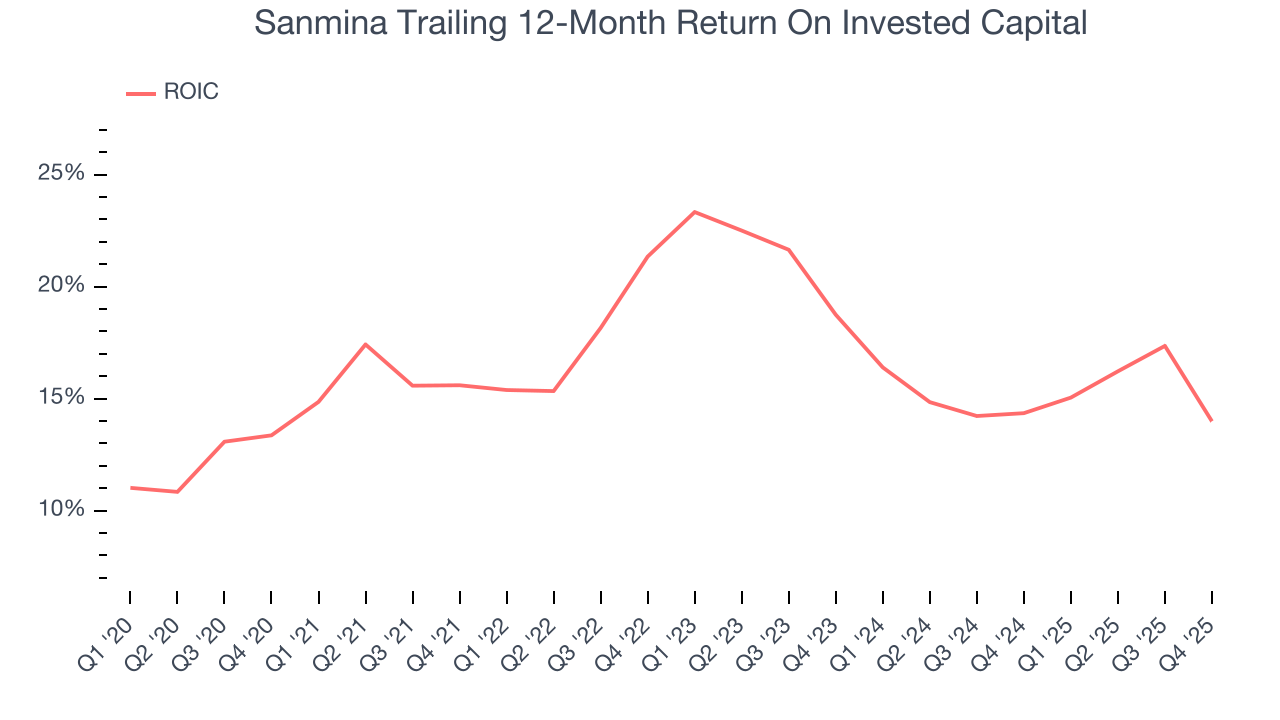
We like to invest in businesses with high returns, but the trend in a company’s ROIC is what often surprises the market and moves the stock price. Over the last few years, Sanmina’s ROIC averaged 4.3 percentage point decreases each year. We like what management has done in the past, but its declining returns are perhaps a symptom of fewer profitable growth opportunities.
11. Balance Sheet Assessment
Sanmina reported $1.42 billion of cash and $2.17 billion of debt on its balance sheet in the most recent quarter. As investors in high-quality companies, we primarily focus on two things: 1) that a company’s debt level isn’t too high and 2) that its interest payments are not excessively burdening the business.
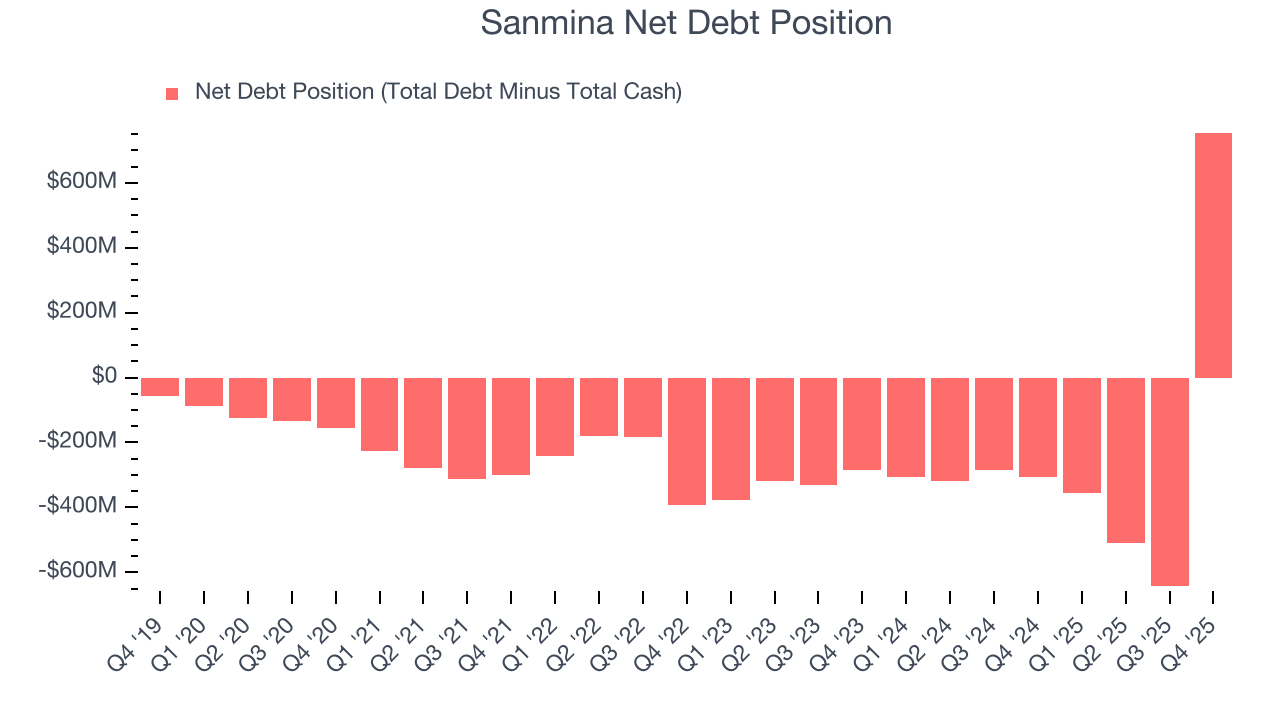
With $397.3 million of EBITDA over the last 12 months, we view Sanmina’s 1.9× net-debt-to-EBITDA ratio as safe. We also see its $13.97 million of annual interest expenses as appropriate. The company’s profits give it plenty of breathing room, allowing it to continue investing in growth initiatives.
12. Key Takeaways from Sanmina’s Q4 Results
We enjoyed seeing Sanmina beat analysts’ revenue expectations this quarter. We were also glad its adjusted operating income outperformed Wall Street’s estimates. On the other hand, its revenue guidance for next quarter missed and its EBITDA fell short of Wall Street’s estimates. Zooming out, we think this was a mixed quarter. Investors were likely hoping for more, and shares traded down 6.3% to $170.97 immediately following the results.
13. Is Now The Time To Buy Sanmina?
Updated: March 18, 2026 at 11:05 PM EDT
When considering an investment in Sanmina, investors should account for its valuation and business qualities as well as what’s happened in the latest quarter.
Sanmina isn’t a terrible business, but it isn’t one of our picks. First off, its revenue growth was mediocre over the last five years. While its projected EPS for the next year implies the company’s fundamentals will improve, the downside is its low gross margins indicate some combination of competitive pressures and high production costs. On top of that, its diminishing returns show management's prior bets haven't worked out.
Sanmina’s P/E ratio based on the next 12 months is 11.9x. This valuation is reasonable, but the company’s shakier fundamentals present too much downside risk. We're pretty confident there are more exciting stocks to buy at the moment.
Wall Street analysts have a consensus one-year price target of $197.50 on the company (compared to the current share price of $125.26).
Although the price target is bullish, readers should exercise caution because analysts tend to be overly optimistic. The firms they work for, often big banks, have relationships with companies that extend into fundraising, M&A advisory, and other rewarding business lines. As a result, they typically hesitate to say bad things for fear they will lose out. We at StockStory do not suffer from such conflicts of interest, so we’ll always tell it like it is.