
Shoe Carnival (SCVL)
We wouldn’t buy Shoe Carnival. Not only are its sales cratering but also its low returns on capital suggest it struggles to generate profits.― StockStory Analyst Team
1. News


2. Summary
Why We Think Shoe Carnival Will Underperform
Known for its playful atmosphere that features carnival elements, Shoe Carnival (NASDAQ:SCVL) is a retailer that sells footwear from mainstream brands for the entire family.
- Weak same-store sales trends over the past two years suggest there may be few opportunities in its core markets to open new locations
- Annual sales declines of 3.5% for the past three years show its products struggled to connect with the market
- Subscale operations are evident in its revenue base of $1.14 billion, meaning it has fewer distribution channels than its larger rivals


Shoe Carnival’s quality is inadequate. There are more promising alternatives.
Why There Are Better Opportunities Than Shoe Carnival


At $16.02 per share, Shoe Carnival trades at 10.9x forward P/E. This multiple rich for the business quality. Not a great combination.
We’d rather pay up for companies with elite fundamentals than get a decent price on a poor one. High-quality businesses often have more durable earnings power, helping us sleep well at night.
3. Shoe Carnival (SCVL) Research Report: Q4 CY2025 Update
Footwear retailer Shoe Carnival (NASDAQ:SCVL) met Wall Street’s revenue expectations in Q4 CY2025, but sales fell by 3.4% year on year to $254.1 million. Its GAAP profit of $0.33 per share was in line with analysts’ consensus estimates.
Shoe Carnival (SCVL) Q4 CY2025 Highlights:
- Revenue: $254.1 million vs analyst estimates of $253.9 million (3.4% year-on-year decline, in line)
- EPS (GAAP): $0.33 vs analyst estimates of $0.33 (in line)
- Operating Margin: 4.3%, in line with the same quarter last year
- Free Cash Flow Margin: 10.9%, down from 13.8% in the same quarter last year
- Same-Store Sales fell 3.5% year on year (-6.3% in the same quarter last year)
- Market Capitalization: $489.2 million
Company Overview
Known for its playful atmosphere that features carnival elements, Shoe Carnival (NASDAQ:SCVL) is a retailer that sells footwear from mainstream brands for the entire family.
A shopper can find shoes from Nike, Adidas, Skechers, Converse, Vans, and Crocs for sale at a typical store. Because Shoe Carnival focuses on keeping prices low and attracting a value customer, the selection from these brands will likely not be the newest, hottest releases but the staples. The company’s purchasing approach is also a major reason prices are competitive–Shoe Carnival acquires some inventory through excess inventory and closeouts. The company also maintains direct relationships with many suppliers, cutting out the expenses of middlemen.
On average, Shoe Carnival stores are mid-sized in the world of retail at approximately 10,000 square feet. Stores are typically located in both urban and suburban areas shopping centers and malls alongside other apparel and footwear retailers. The floors are easy to navigate, with sections for men, women, and children and those sections with further subsections for athletic, casual, and dress shoes. Shoe Carnival does have an e-commerce presence, established in 2008, but it is a concept and category that tends to draw shoppers in person.
4. Footwear Retailer
Footwear sales–like their apparel counterparts–are driven by seasons, trends, and innovation more so than absolute need and similarly face the bigger-picture secular trend of e-commerce penetration. Footwear plays a part in societal belonging, personal expression, and occasion, and retailers selling shoes recognize this. Therefore, they aim to balance selection, competitive prices, and the latest trends to attract consumers. Unlike their apparel counterparts, footwear retailers most sell popular third-party brands (as opposed to their own exclusive brands), which could mean less exclusivity of product but more nimbleness to pivot to what’s hot.
Footwear retailer competitors include Designer Brands’s (NYSE:DBI) DSW banner, Foot Locker (NYSE:FL), and TJX (NYSE:TJX).
5. Revenue Growth
Reviewing a company’s long-term sales performance reveals insights into its quality. Any business can have short-term success, but a top-tier one grows for years.
With $1.14 billion in revenue over the past 12 months, Shoe Carnival is a small retailer, which sometimes brings disadvantages compared to larger competitors benefiting from economies of scale and negotiating leverage with suppliers.
As you can see below, Shoe Carnival’s demand was weak over the last three years. Its sales fell by 3.5% annually despite opening new stores. This implies its underperformance was driven by lower sales at existing, established locations.
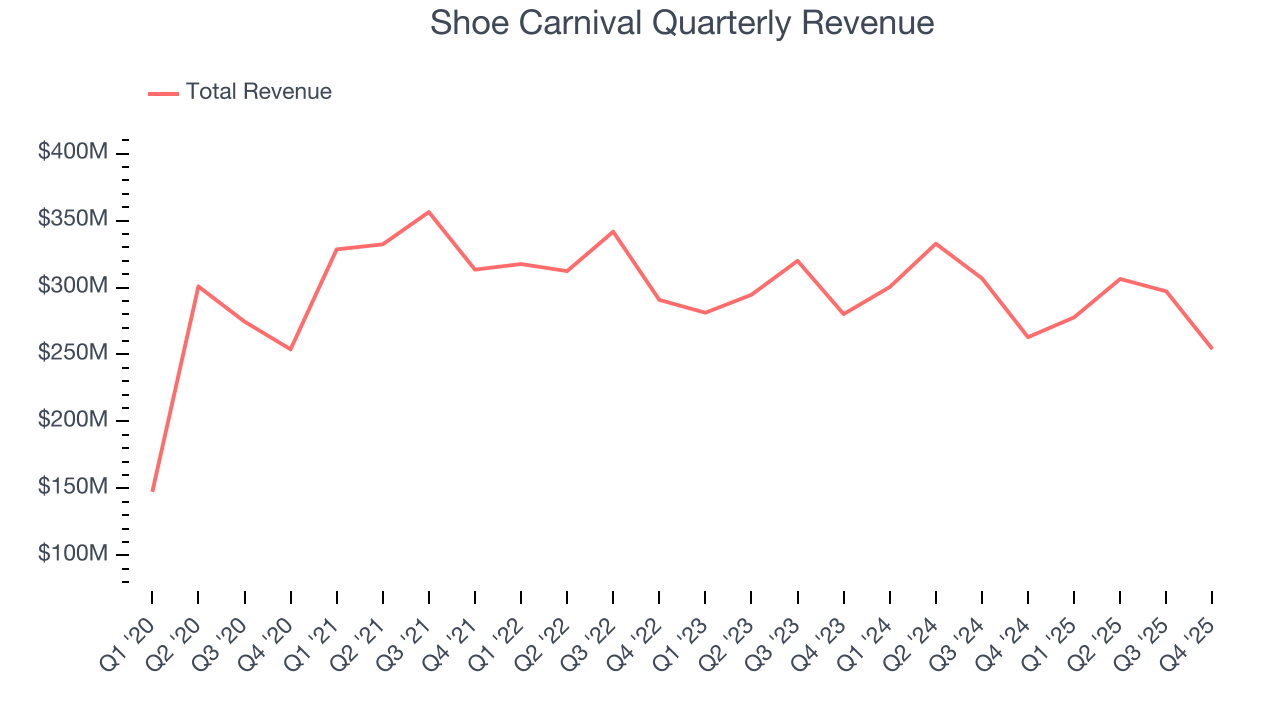
This quarter, Shoe Carnival reported a rather uninspiring 3.4% year-on-year revenue decline to $254.1 million of revenue, in line with Wall Street’s estimates.
Looking ahead, sell-side analysts expect revenue to decline by 1.9% over the next 12 months. it’s tough to feel optimistic about a company facing demand difficulties.
6. Store Performance
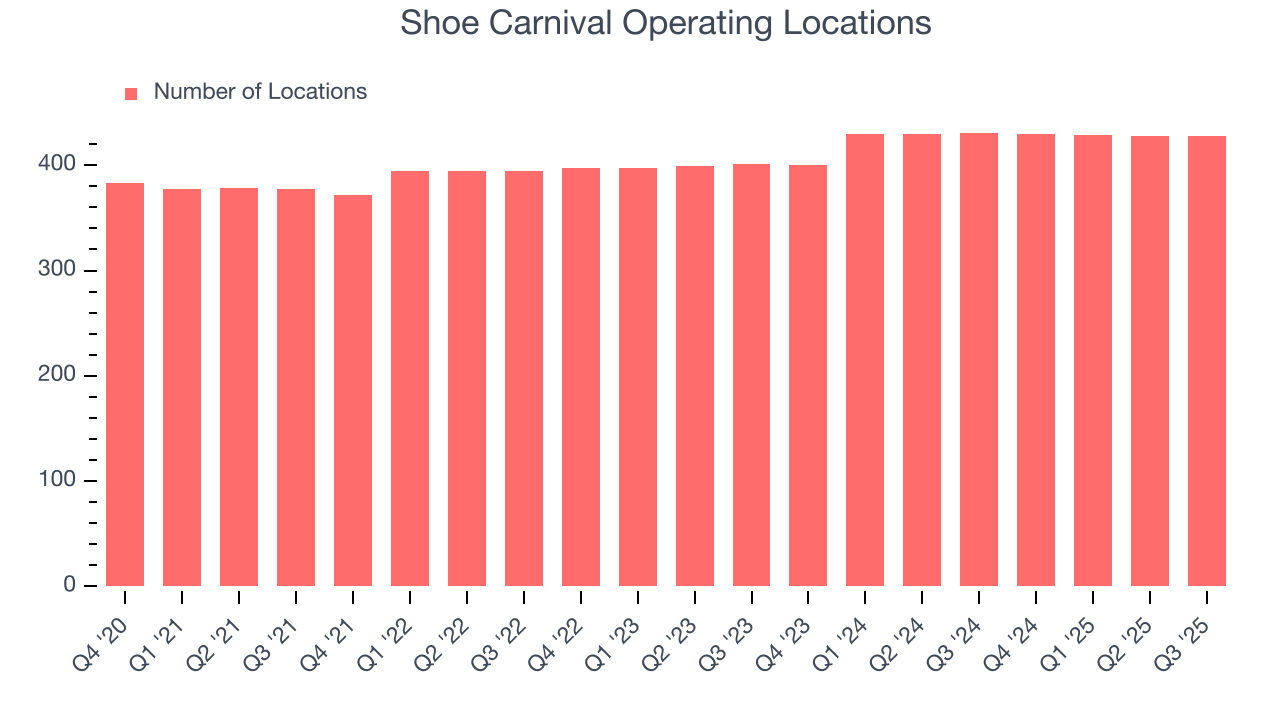
Number of Stores
A retailer’s store count influences how much it can sell and how quickly revenue can grow.
Over the last two years, Shoe Carnival opened new stores at a rapid clip by averaging 4.2% annual growth, among the fastest in the consumer retail sector. This gives it a chance to scale into a mid-sized business over time.
When a retailer opens new stores, it usually means it’s investing for growth because demand is greater than supply, especially in areas where consumers may not have a store within reasonable driving distance.
Note that Shoe Carnival reports its store count intermittently, so some data points are missing in the chart below.
Same-Store Sales
The change in a company's store base only tells one side of the story. The other is the performance of its existing locations and e-commerce sales, which informs management teams whether they should expand or downsize their physical footprints. Same-store sales gives us insight into this topic because it measures organic growth for a retailer's e-commerce platform and brick-and-mortar shops that have existed for at least a year.
Shoe Carnival’s demand has been shrinking over the last two years as its same-store sales have averaged 4.7% annual declines. This performance is concerning - it shows Shoe Carnival artificially boosts its revenue by building new stores. We’d like to see a company’s same-store sales rise before it takes on the costly, capital-intensive endeavor of expanding its store base.
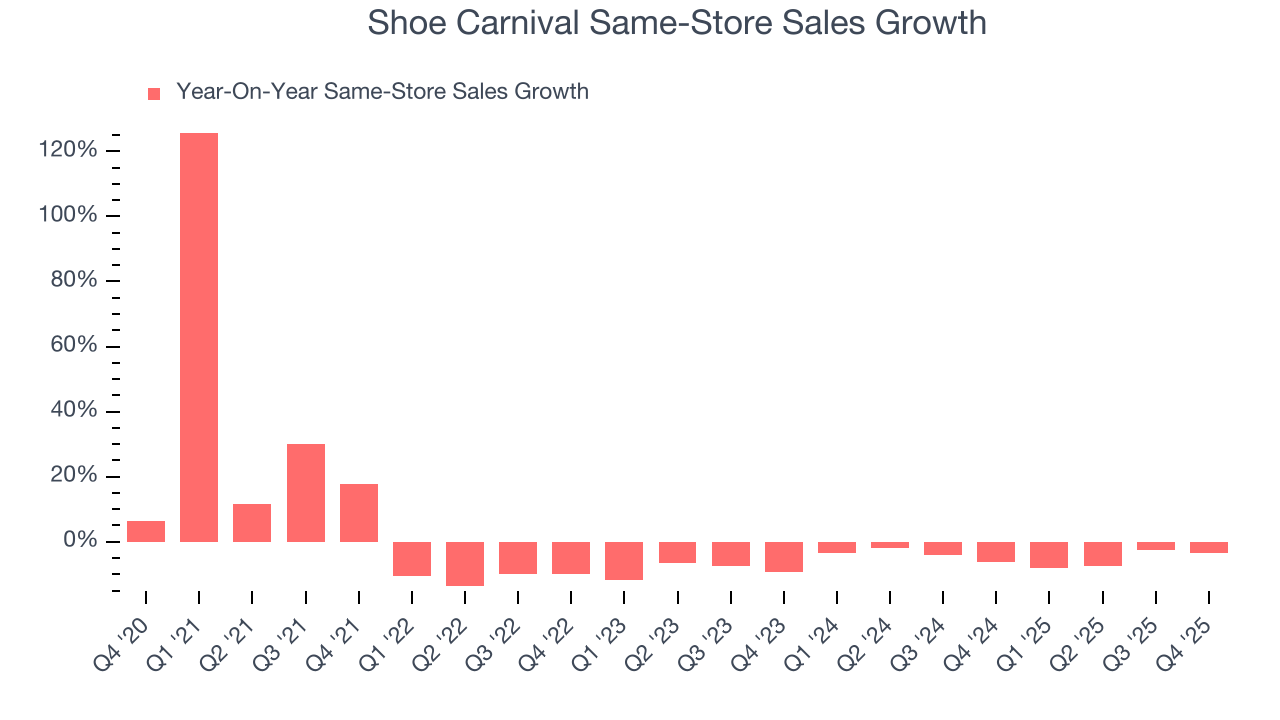
In the latest quarter, Shoe Carnival’s same-store sales fell by 3.5% year on year. This decrease represents a further deceleration from its historical levels. We hope the business can get back on track.
7. Gross Margin & Pricing Power
Shoe Carnival has bad unit economics for a retailer, giving it less room to reinvest and grow its presence. As you can see below, it averaged a 36.1% gross margin over the last two years. That means Shoe Carnival paid its suppliers a lot of money ($63.91 for every $100 in revenue) to run its business. 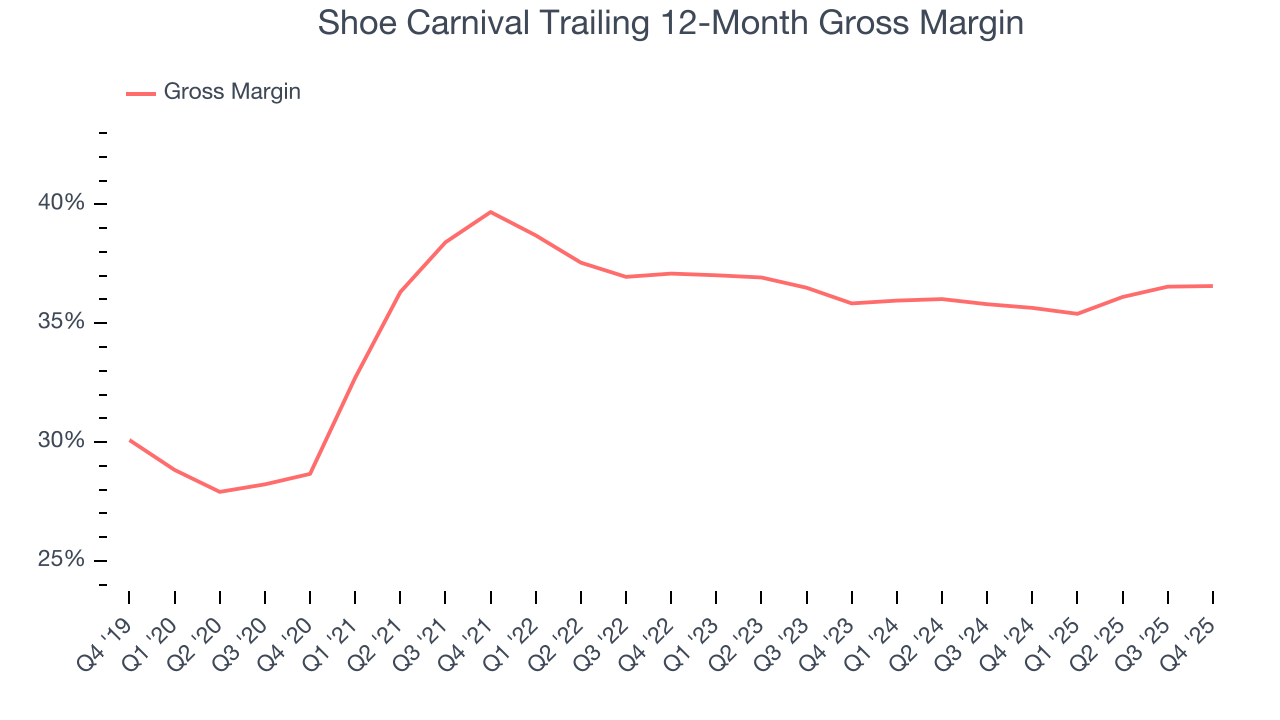
Shoe Carnival’s gross profit margin came in at 34.9% this quarter, in line with the same quarter last year. On a wider time horizon, the company’s full-year margin has remained steady over the past four quarters, suggesting it strives to keep prices low for customers and has stable input costs (such as labor and freight expenses to transport goods).
8. Operating Margin
Operating margin is a key measure of profitability. Think of it as net income - the bottom line - excluding the impact of taxes and interest on debt, which are less connected to business fundamentals.
Shoe Carnival was profitable over the last two years but held back by its large cost base. Its average operating margin of 6.8% was weak for a consumer retail business. This result isn’t too surprising given its low gross margin as a starting point.
Looking at the trend in its profitability, Shoe Carnival’s operating margin decreased by 1.7 percentage points over the last year. Shoe Carnival’s performance was poor no matter how you look at it - it shows that costs were rising and it couldn’t pass them onto its customers.
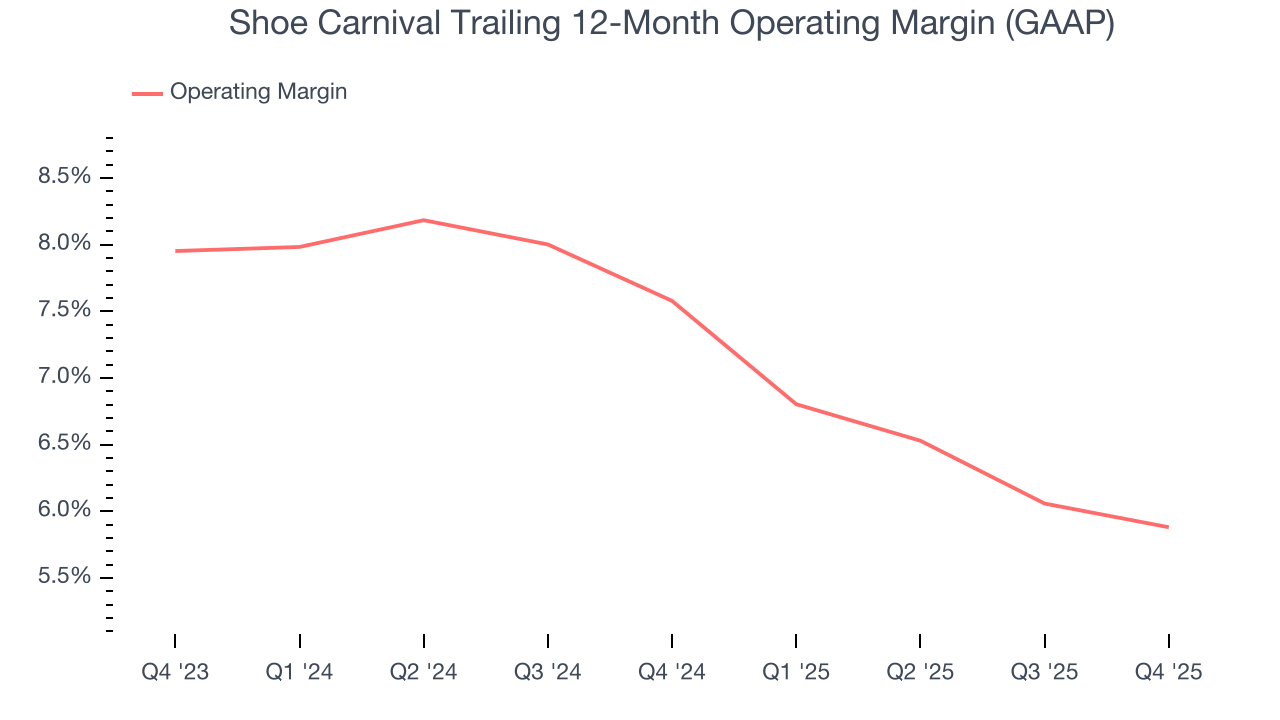
In Q4, Shoe Carnival generated an operating margin profit margin of 4.3%, in line with the same quarter last year. This indicates the company’s cost structure has recently been stable.
9. Earnings Per Share
We track the long-term change in earnings per share (EPS) for the same reason as long-term revenue growth. Compared to revenue, however, EPS highlights whether a company’s growth is profitable.
Sadly for Shoe Carnival, its EPS declined by 21.7% annually over the last three years, more than its revenue. This tells us the company struggled because its fixed cost base made it difficult to adjust to shrinking demand.
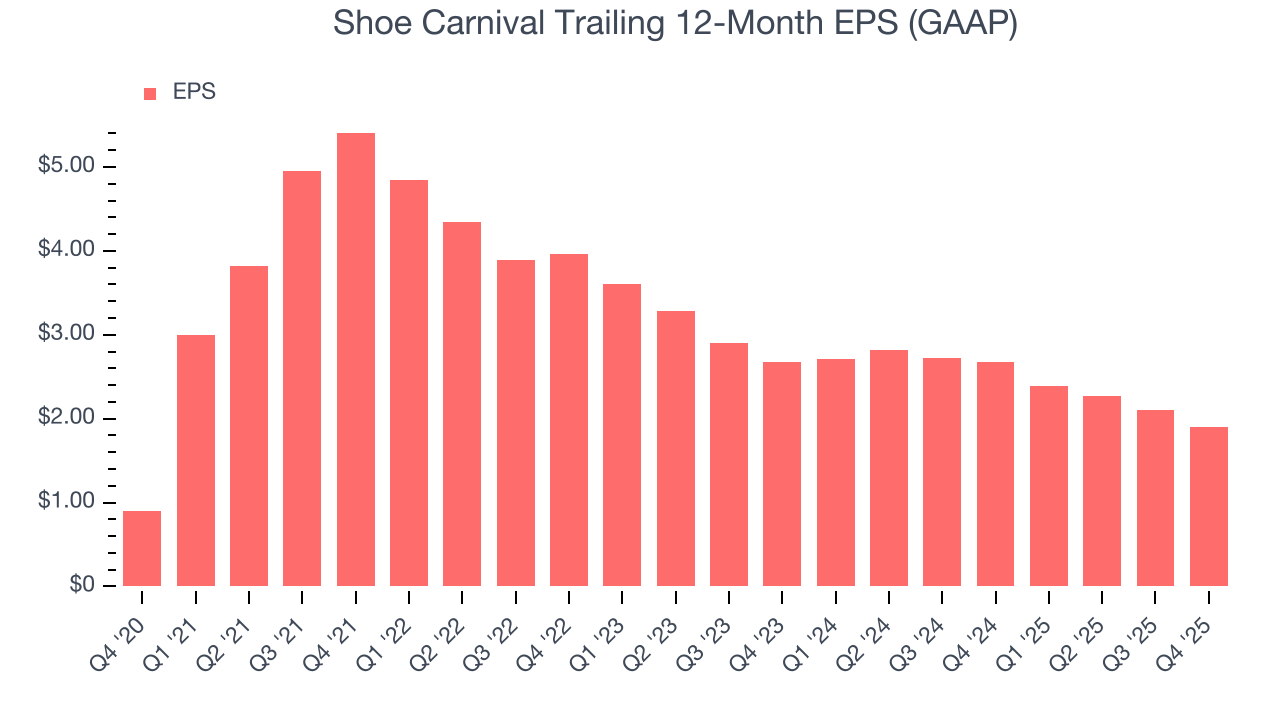
In Q4, Shoe Carnival reported EPS of $0.33, down from $0.53 in the same quarter last year. This print was close to analysts’ estimates. Over the next 12 months, Wall Street expects Shoe Carnival’s full-year EPS of $1.90 to shrink by 20.5%.
10. Cash Is King
If you’ve followed StockStory for a while, you know we emphasize free cash flow. Why, you ask? We believe that in the end, cash is king, and you can’t use accounting profits to pay the bills.
Shoe Carnival has shown decent cash profitability, giving it some flexibility to reinvest or return capital to investors. The company’s free cash flow margin averaged 4.1% over the last two years, slightly better than the broader consumer retail sector.
Taking a step back, we can see that Shoe Carnival’s margin dropped by 3.4 percentage points over the last year. This decrease came from the higher costs associated with opening more stores.
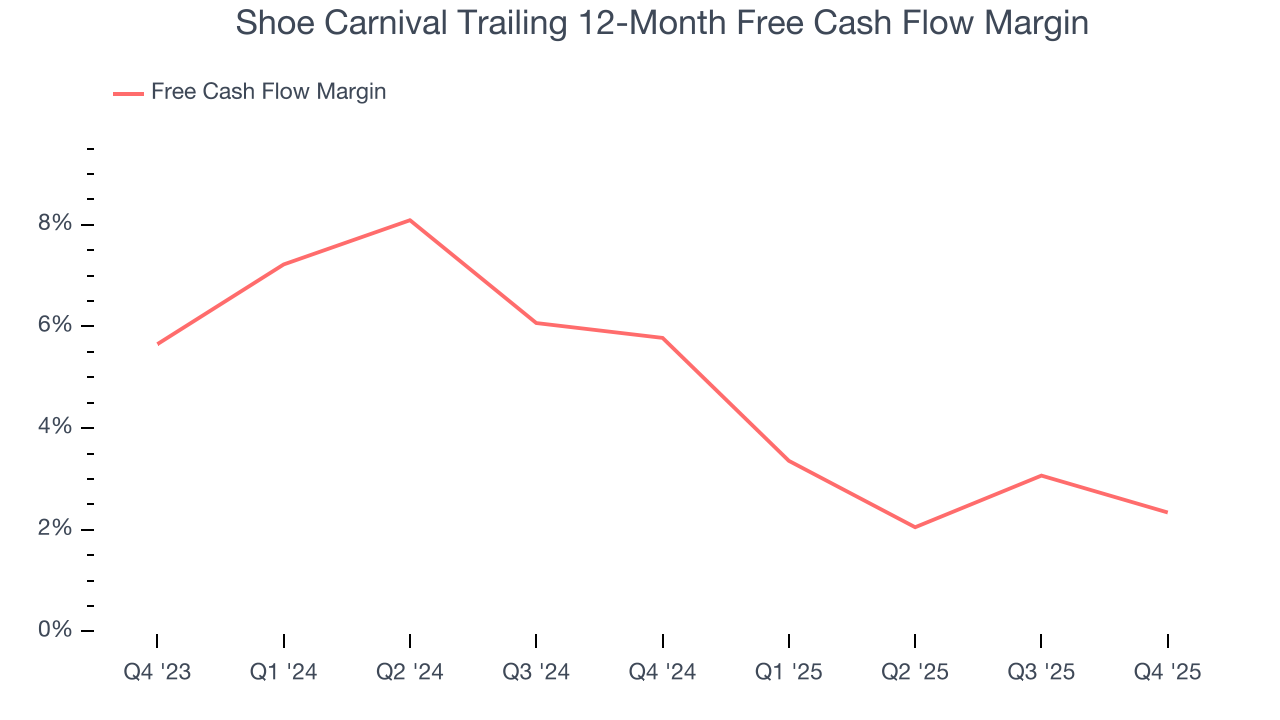
Shoe Carnival’s free cash flow clocked in at $27.66 million in Q4, equivalent to a 10.9% margin. The company’s cash profitability regressed as it was 2.9 percentage points lower than in the same quarter last year, but it’s still above its two-year average. We wouldn’t put too much weight on this quarter’s decline because investment needs can be seasonal, causing short-term swings. Long-term trends are more important.
11. Return on Invested Capital (ROIC)
EPS and free cash flow tell us whether a company was profitable while growing its revenue. But was it capital-efficient? A company’s ROIC explains this by showing how much operating profit it makes compared to the money it has raised (debt and equity).
Shoe Carnival historically did a mediocre job investing in profitable growth initiatives. Its five-year average ROIC was 14%, somewhat low compared to the best consumer retail companies that consistently pump out 25%+.
12. Balance Sheet Assessment
Shoe Carnival reported $130.7 million of cash and $371.4 million of debt on its balance sheet in the most recent quarter. As investors in high-quality companies, we primarily focus on two things: 1) that a company’s debt level isn’t too high and 2) that its interest payments are not excessively burdening the business.
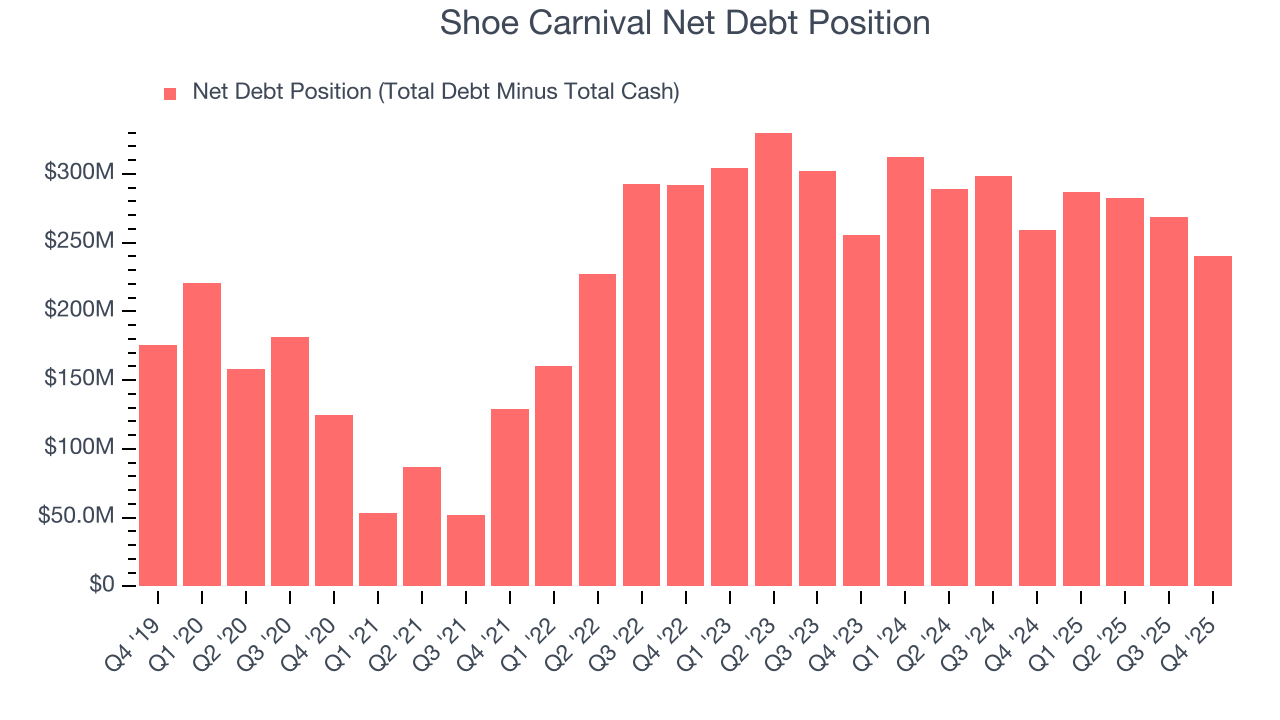
With $95.44 million of EBITDA over the last 12 months, we view Shoe Carnival’s 2.5× net-debt-to-EBITDA ratio as safe. We also see its $1.88 million of annual interest expenses as appropriate. The company’s profits give it plenty of breathing room, allowing it to continue investing in growth initiatives.
13. Key Takeaways from Shoe Carnival’s Q4 Results
This quarter was without many surprises, good or bad. Revenue and EPS both came in line with Wall Street estimates. The stock remained flat at $17.99 immediately following the results.
14. Is Now The Time To Buy Shoe Carnival?
Updated: March 27, 2026 at 10:39 PM EDT
When considering an investment in Shoe Carnival, investors should account for its valuation and business qualities as well as what’s happened in the latest quarter.
Shoe Carnival falls short of our quality standards. To kick things off, its revenue has declined over the last three years. While its expanding store base shows it’s playing offense to grow its brand, the downside is its shrinking same-store sales tell us it will need to change its strategy to succeed. On top of that, its brand caters to a niche market.
Shoe Carnival’s P/E ratio based on the next 12 months is 10.9x. This valuation tells us a lot of optimism is priced in - we think there are better opportunities elsewhere.
Wall Street analysts have a consensus one-year price target of $22 on the company (compared to the current share price of $16.02).
Although the price target is bullish, readers should exercise caution because analysts tend to be overly optimistic. The firms they work for, often big banks, have relationships with companies that extend into fundraising, M&A advisory, and other rewarding business lines. As a result, they typically hesitate to say bad things for fear they will lose out. We at StockStory do not suffer from such conflicts of interest, so we’ll always tell it like it is.