Sterling (STRL)
Sterling is a world-class company. Its elite revenue growth and returns on capital demonstrate it can grow rapidly and profitably.― StockStory Analyst Team
1. News


2. Summary
Why We Like Sterling
Involved in the construction of a major highway, the Grand Parkway in Houston, TX, Sterling Infrastructure (NASDAQ:STRL) provides civil infrastructure construction.
- Incremental sales significantly boosted profitability as its annual earnings per share growth of 47.7% over the last five years outstripped its revenue performance
- Demand for the next 12 months is expected to accelerate above its two-year trend as Wall Street forecasts robust revenue growth of 22.6%
- Robust free cash flow profile gives it the flexibility to invest in growth initiatives or return capital to shareholders, and its improved cash conversion implies it’s becoming a less capital-intensive business


We’re optimistic about Sterling. The valuation looks fair relative to its quality, and we think now is a good time to invest.
Why Is Now The Time To Buy Sterling?


At $405.30 per share, Sterling trades at 31.1x forward P/E. While this multiple is higher than most industrials companies, we think the valuation is fair given its quality characteristics.
Our work shows, time and again, that buying high-quality companies and holding them routinely leads to market outperformance. Over a multi-year investment horizon, entry price doesn’t matter nearly as much as business quality.
3. Sterling (STRL) Research Report: Q4 CY2025 Update
Civil infrastructure construction company Sterling Infrastructure (NASDAQ:STRL) reported revenue ahead of Wall Street’s expectations in Q4 CY2025, with sales up 51.5% year on year to $755.6 million. The company’s full-year revenue guidance of $3.13 billion at the midpoint came in 10.7% above analysts’ estimates. Its non-GAAP profit of $3.08 per share was 17% above analysts’ consensus estimates.
Sterling (STRL) Q4 CY2025 Highlights:
- Revenue: $755.6 million vs analyst estimates of $639.4 million (51.5% year-on-year growth, 18.2% beat)
- Adjusted EPS: $3.08 vs analyst estimates of $2.63 (17% beat)
- Adjusted EBITDA: $142.1 million vs analyst estimates of $128.4 million (18.8% margin, 10.7% beat)
- Adjusted EPS guidance for the upcoming financial year 2026 is $13.75 at the midpoint, beating analyst estimates by 13.9%
- EBITDA guidance for the upcoming financial year 2026 is $642.5 million at the midpoint, above analyst estimates of $580.9 million
- Operating Margin: 0.9%, down from 12.5% in the same quarter last year
- Free Cash Flow Margin: 21.1%, down from 31.8% in the same quarter last year
- Market Capitalization: $14.12 billion
Company Overview
Involved in the construction of a major highway, the Grand Parkway in Houston, TX, Sterling Infrastructure (NASDAQ:STRL) provides civil infrastructure construction.
Other than highways, Sterling builds and maintains transportation infrastructure such as roads, bridges, light rail, and water infrastructure like wastewater drainage systems and storm drainage systems.
Sterling also offers the foundation and excavation services needed to erect the aforementioned infrastructure, by providing deep foundation solutions, including drilled shafts, driven piles, and earth retention systems. Additionally, the company offers “Heavy Civil Construction,” which means the construction of large-scale engineering projects like dams (including gravity dams and arch dams), and levees, which are banks along the side of rivers and dams to prevent flooding.
Sterling generates revenue through all of the infrastructure industries mentioned above, but revenue from the construction of highways, bridges, and transit systems has historically accounted for the most significant portion of its revenue. The company mostly sells to government entities from the local to the federal level and sells through a competitive bidding process where it submits its bid for jobs demanded on the market. Due to the need for maintenance of these highly engineered infrastructure projects, the company has a solid base for recurring revenue in its business model.
4. Engineering and Design Services
Companies providing engineering and design services boast ever-evolving technical expertise. Compared to their counterparts who manufacture and sell physical products, these companies can also pivot faster to more trending areas due to their smaller physical asset bases. Green energy and water conservation, for example, are current themes driving incremental demand in this space. On the other hand, those providing engineering and design services are at the whim of construction and infrastructure project volumes, which tend to be cyclical and can be impacted heavily by economic factors such as interest rates.
Sterling’s competitors in the civil construction and infrastructure sector include Granite Construction (NYSE:GVA), AECOM (NYSE:ACM), and private company Kiewit.
5. Revenue Growth
A company’s long-term sales performance is one signal of its overall quality. Any business can put up a good quarter or two, but many enduring ones grow for years. Thankfully, Sterling’s 11.8% annualized revenue growth over the last five years was impressive. Its growth surpassed the average industrials company and shows its offerings resonate with customers, a great starting point for our analysis.
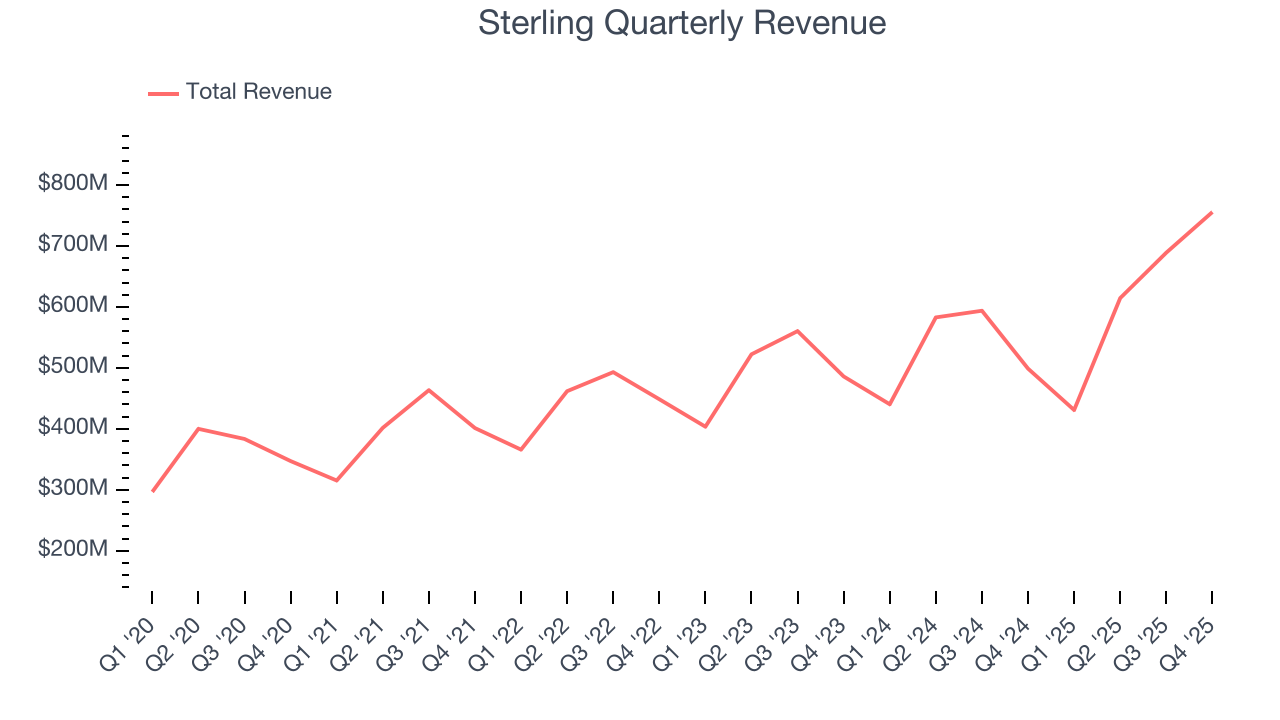
We at StockStory place the most emphasis on long-term growth, but within industrials, a half-decade historical view may miss cycles, industry trends, or a company capitalizing on catalysts such as a new contract win or a successful product line. Sterling’s annualized revenue growth of 12.4% over the last two years aligns with its five-year trend, suggesting its demand was predictably strong. 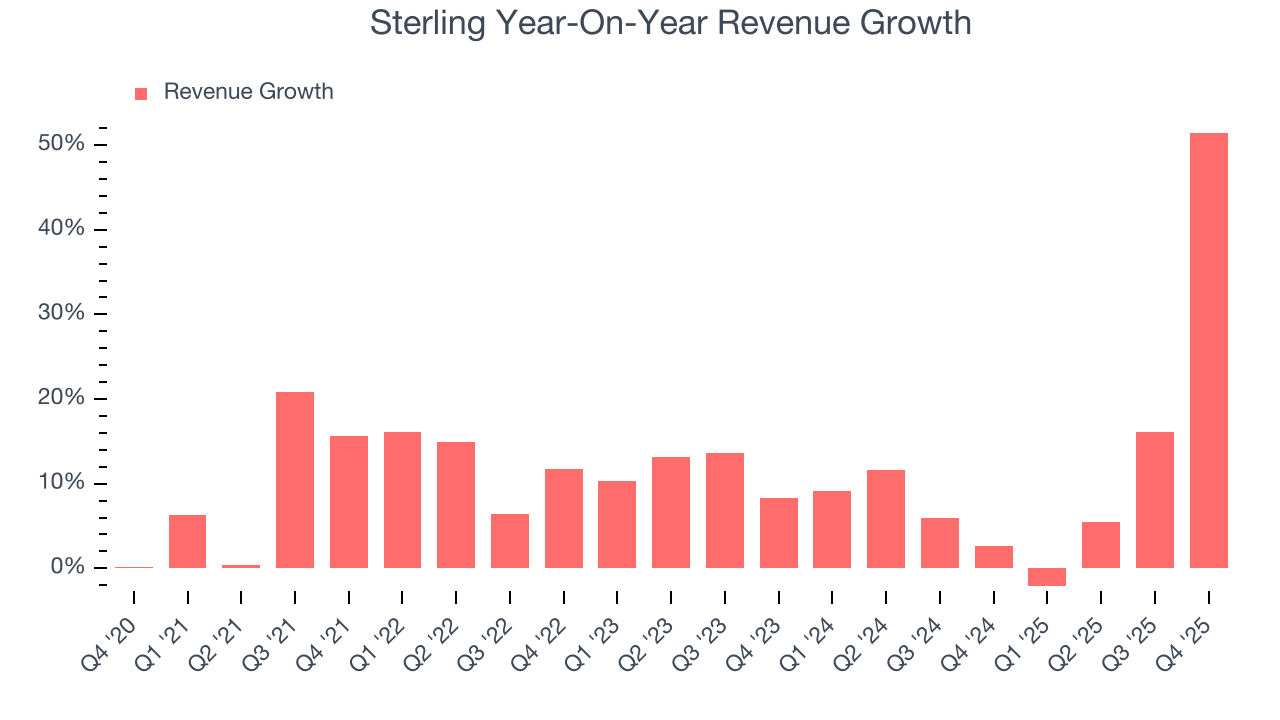
This quarter, Sterling reported magnificent year-on-year revenue growth of 51.5%, and its $755.6 million of revenue beat Wall Street’s estimates by 18.2%.
Looking ahead, sell-side analysts expect revenue to grow 13.2% over the next 12 months, similar to its two-year rate. This projection is admirable and implies the market is forecasting success for its products and services.
6. Gross Margin & Pricing Power
Gross profit margin is a critical metric to track because it sheds light on its pricing power, complexity of products, and ability to procure raw materials, equipment, and labor.
Sterling has bad unit economics for an industrials business, signaling it operates in a competitive market. As you can see below, it averaged a 18.4% gross margin over the last five years. Said differently, Sterling had to pay a chunky $81.62 to its suppliers for every $100 in revenue. 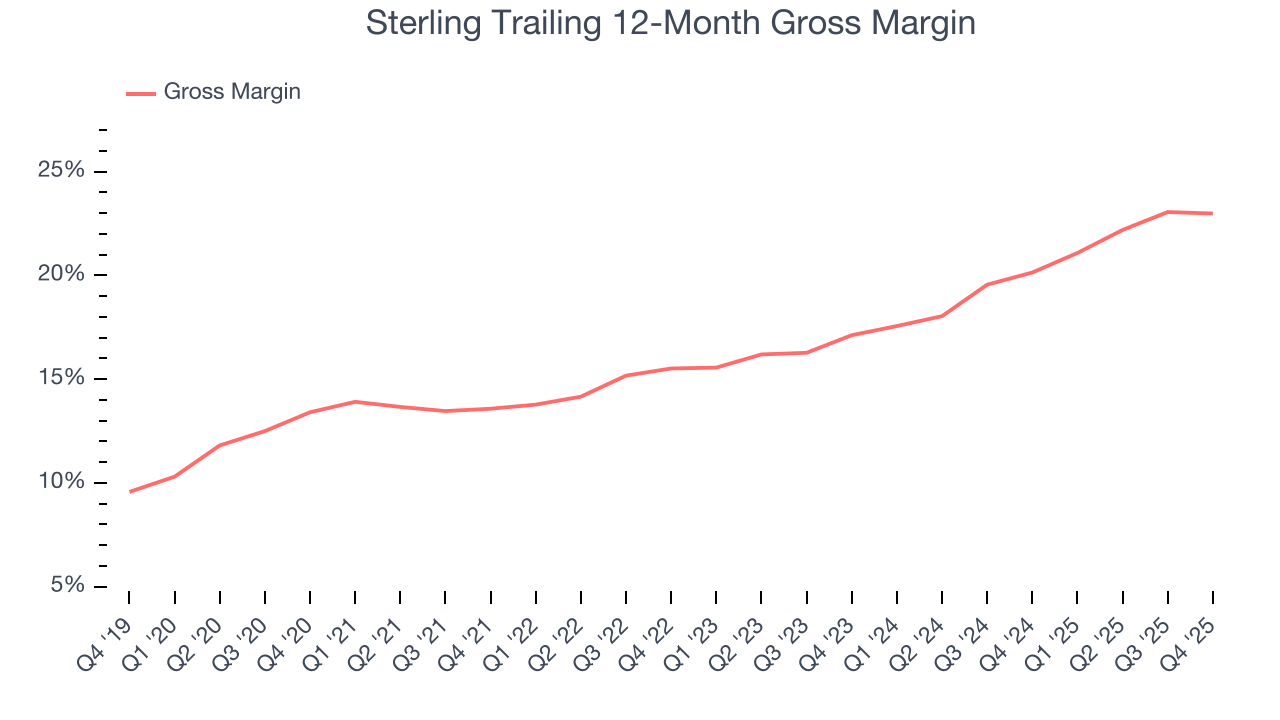
In Q4, Sterling produced a 21.7% gross profit margin, in line with the same quarter last year. On a wider time horizon, Sterling’s full-year margin has been trending up over the past 12 months, increasing by 2.8 percentage points. If this move continues, it could suggest better unit economics due to more leverage from its growing sales on the fixed portion of its cost of goods sold (such as manufacturing expenses).
7. Operating Margin
Operating margin is a key measure of profitability. Think of it as net income - the bottom line - excluding the impact of taxes and interest on debt, which are less connected to business fundamentals.
Sterling has managed its cost base well over the last five years. It demonstrated solid profitability for an industrials business, producing an average operating margin of 10.6%. This result was particularly impressive because of its low gross margin, which is mostly a factor of what it sells and takes huge shifts to move meaningfully. Companies have more control over their operating margins, and it’s a show of well-managed operations if they’re high when gross margins are low.
Analyzing the trend in its profitability, Sterling’s operating margin rose by 5.5 percentage points over the last five years, as its sales growth gave it immense operating leverage.
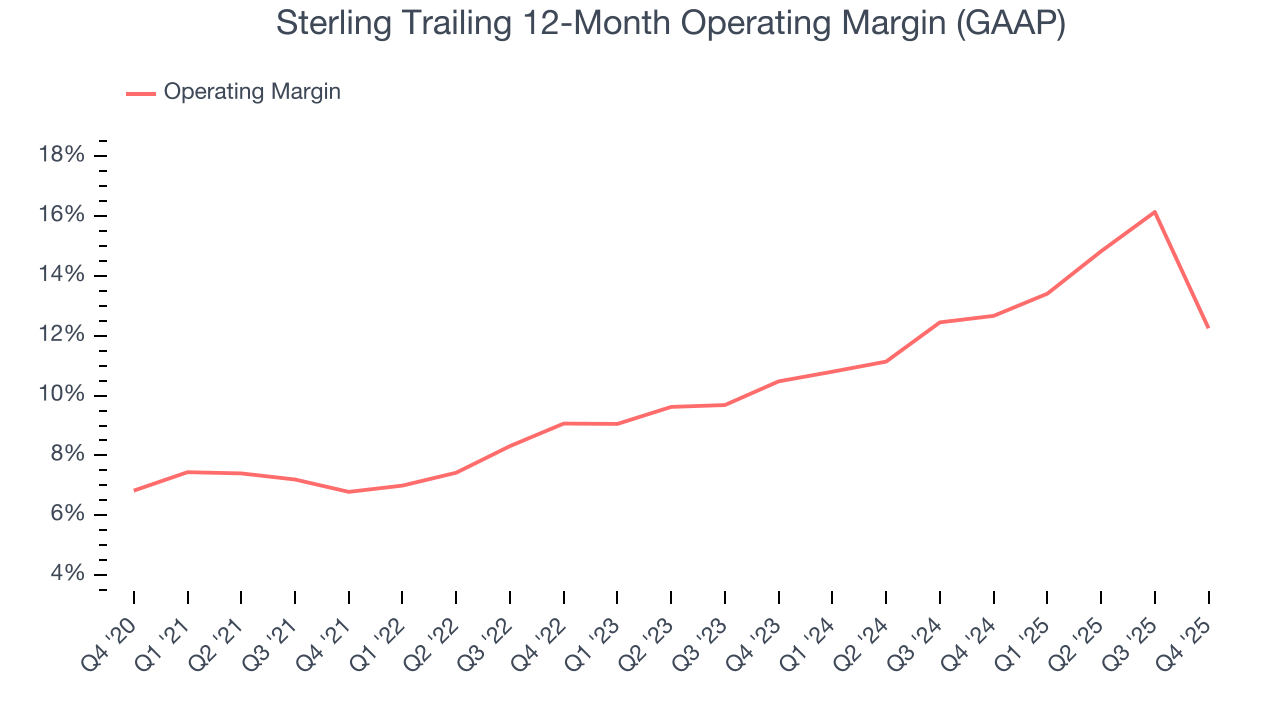
In Q4, Sterling’s breakeven margin was 0.9%, down 11.6 percentage points year on year. Since Sterling’s operating margin decreased more than its gross margin, we can assume it was less efficient because expenses such as marketing, R&D, and administrative overhead increased.
8. Earnings Per Share
Revenue trends explain a company’s historical growth, but the long-term change in earnings per share (EPS) points to the profitability of that growth – for example, a company could inflate its sales through excessive spending on advertising and promotions.
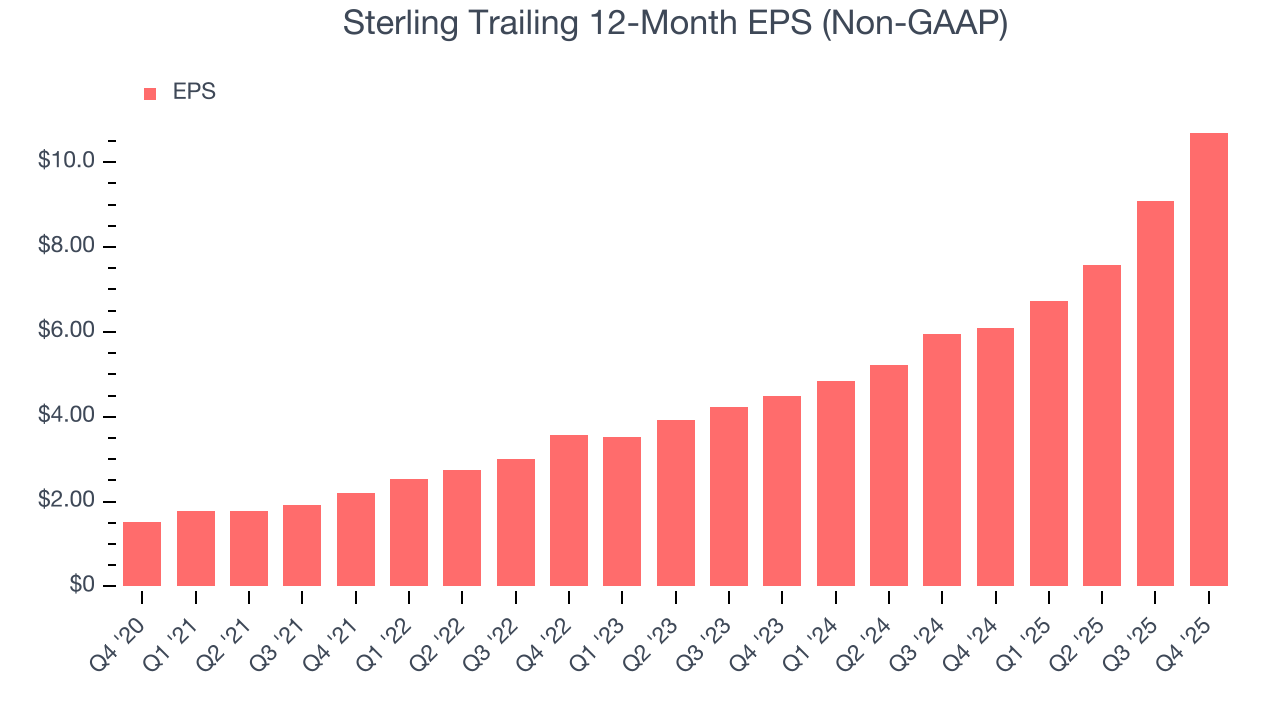
Sterling’s EPS grew at an astounding 47.7% compounded annual growth rate over the last five years, higher than its 11.8% annualized revenue growth. This tells us the company became more profitable on a per-share basis as it expanded.
Diving into Sterling’s quality of earnings can give us a better understanding of its performance. As we mentioned earlier, Sterling’s operating margin declined this quarter but expanded by 5.5 percentage points over the last five years. This was the most relevant factor (aside from the revenue impact) behind its higher earnings; interest expenses and taxes can also affect EPS but don’t tell us as much about a company’s fundamentals.
Like with revenue, we analyze EPS over a more recent period because it can provide insight into an emerging theme or development for the business.
For Sterling, its two-year annual EPS growth of 54.5% was higher than its five-year trend. We love it when earnings growth accelerates, especially when it accelerates off an already high base.
In Q4, Sterling reported adjusted EPS of $3.08, up from $1.46 in the same quarter last year. This print easily cleared analysts’ estimates, and shareholders should be content with the results. Over the next 12 months, Wall Street expects Sterling’s full-year EPS of $10.70 to grow 13.2%.
9. Cash Is King
If you’ve followed StockStory for a while, you know we emphasize free cash flow. Why, you ask? We believe that in the end, cash is king, and you can’t use accounting profits to pay the bills.
Sterling has shown terrific cash profitability, putting it in an advantageous position to invest in new products, return capital to investors, and consolidate the market during industry downturns. The company’s free cash flow margin was among the best in the industrials sector, averaging 15.2% over the last five years.
Taking a step back, we can see that Sterling’s margin expanded by 3.5 percentage points during that time. This is encouraging because it gives the company more optionality.
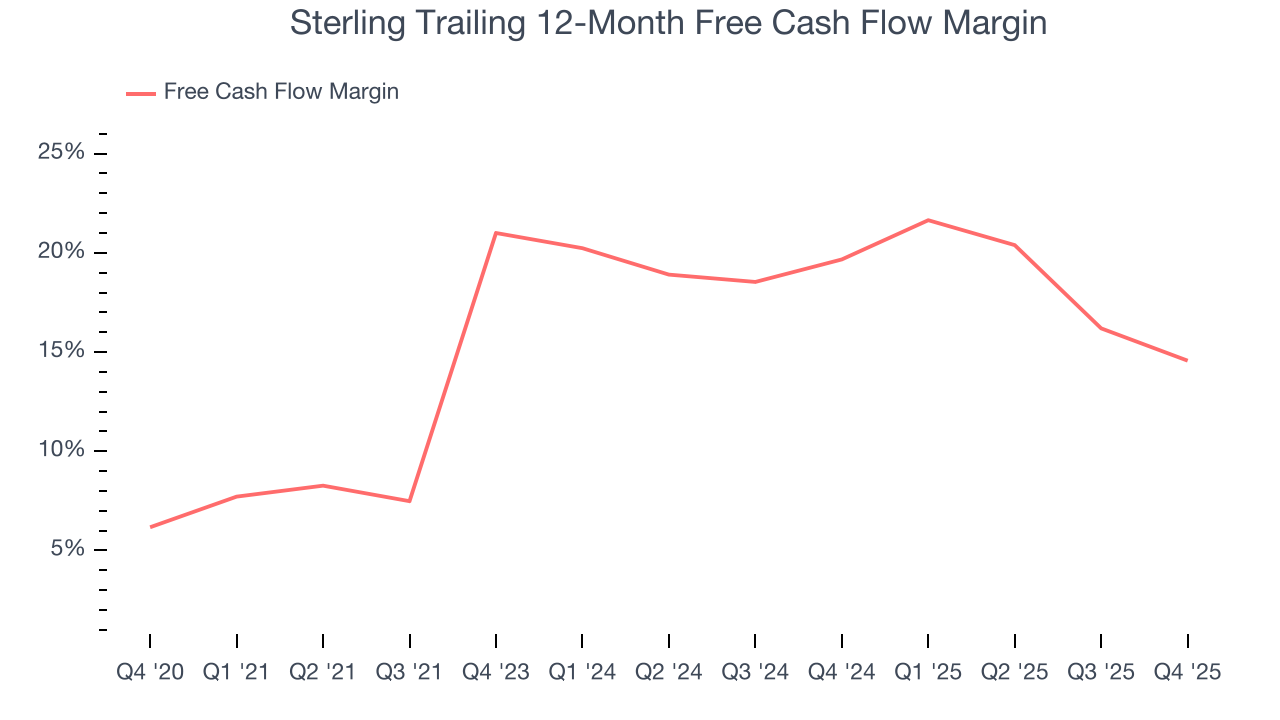
Sterling’s free cash flow clocked in at $159.7 million in Q4, equivalent to a 21.1% margin. The company’s cash profitability regressed as it was 10.7 percentage points lower than in the same quarter last year, but it’s still above its five-year average. We wouldn’t put too much weight on this quarter’s decline because capital expenditures can be seasonal and companies often stockpile inventory in anticipation of higher demand, causing short-term swings. Long-term trends carry greater meaning.
10. Return on Invested Capital (ROIC)
EPS and free cash flow tell us whether a company was profitable while growing its revenue. But was it capital-efficient? A company’s ROIC explains this by showing how much operating profit it makes compared to the money it has raised (debt and equity).
Sterling’s five-year average ROIC was 25.8%, placing it among the best industrials companies. This illustrates its management team’s ability to invest in highly profitable ventures and produce tangible results for shareholders.
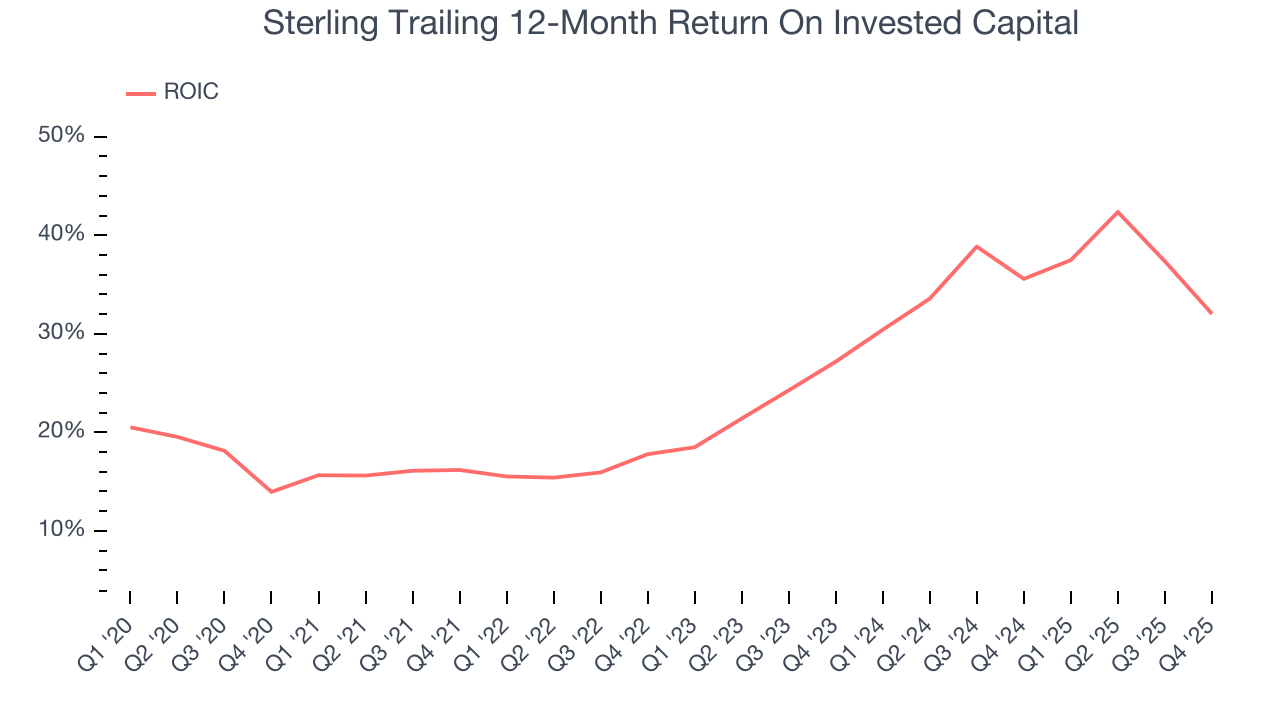
We like to invest in businesses with high returns, but the trend in a company’s ROIC is what often surprises the market and moves the stock price. Fortunately, Sterling’s ROIC has increased significantly over the last few years. This is a great sign when paired with its already strong returns. It could suggest its competitive advantage or profitable growth opportunities are expanding.
11. Balance Sheet Assessment
One of the best ways to mitigate bankruptcy risk is to hold more cash than debt.
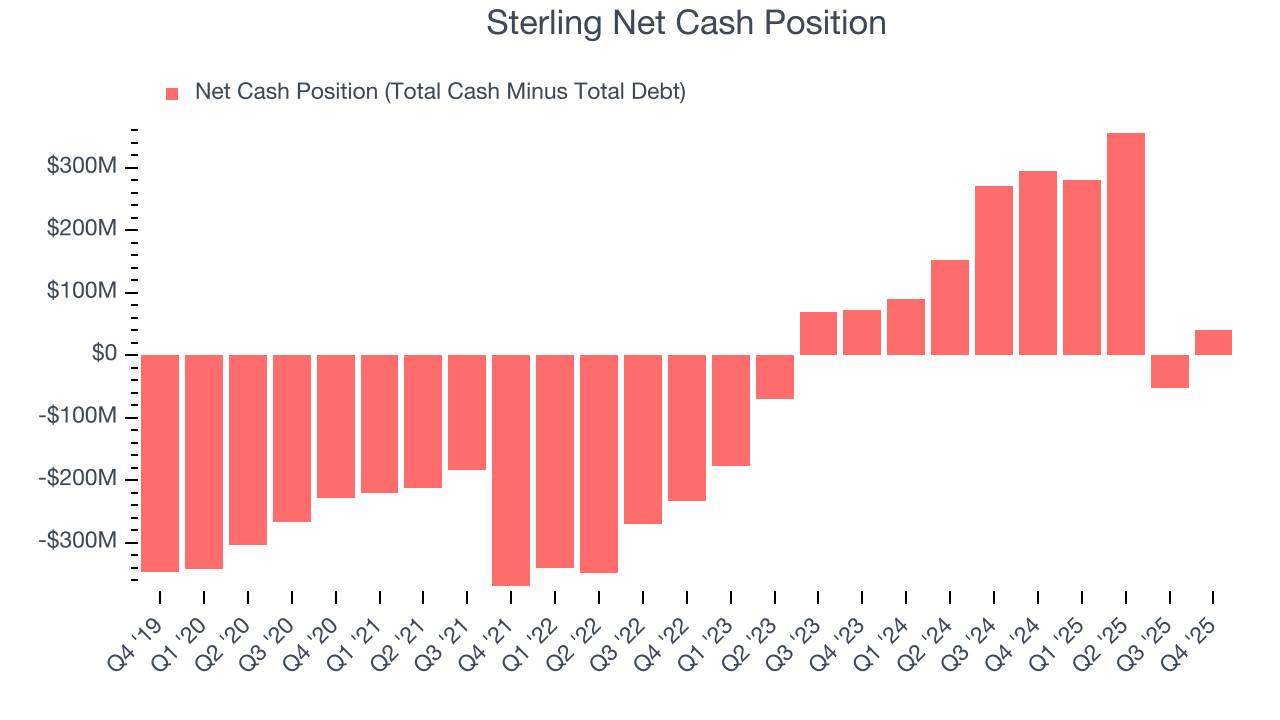
Sterling is a profitable, well-capitalized company with $390.7 million of cash and $349.9 million of debt on its balance sheet. This $40.81 million net cash position gives it the freedom to borrow money, return capital to shareholders, or invest in growth initiatives. Leverage is not an issue here.
12. Key Takeaways from Sterling’s Q4 Results
We were impressed by how significantly Sterling blew past analysts’ EBITDA expectations this quarter. We were also excited its revenue outperformed Wall Street’s estimates by a wide margin. Zooming out, we think this quarter featured some important positives. The stock traded up 5% to $483.50 immediately following the results.
13. Is Now The Time To Buy Sterling?
Updated: March 13, 2026 at 11:08 PM EDT
Before deciding whether to buy Sterling or pass, we urge investors to consider business quality, valuation, and the latest quarterly results.
There are numerous reasons why we think Sterling is one of the best industrials companies out there. For starters, its revenue growth was impressive over the last five years and is expected to accelerate over the next 12 months. And while its low gross margins indicate some combination of competitive pressures and high production costs, its powerful free cash flow generation enables it to stay ahead of the competition through consistent reinvestment of profits. Additionally, Sterling’s expanding operating margin shows the business has become more efficient.
Sterling’s P/E ratio based on the next 12 months is 29.9x. Looking at the industrials space today, Sterling’s qualities as one of the best businesses really stand out, and we like it at this price.
Wall Street analysts have a consensus one-year price target of $495.40 on the company (compared to the current share price of $397.00), implying they see 24.8% upside in buying Sterling in the short term.