AECOM (ACM)
AECOM doesn’t excite us. Its underwhelming revenue growth and failure to generate meaningful free cash flow is a concerning trend.― StockStory Analyst Team
1. News


2. Summary
Why AECOM Is Not Exciting
Founded in 1990 when a group of engineers from five companies decided to merge, AECOM (NYSE:ACM) provides various infrastructure consulting services.
- Product roadmap and go-to-market strategy need to be reconsidered as its backlog has averaged 4% declines over the past two years
- The company has faced growth challenges as its 3.7% annual revenue increases over the last five years fell short of other industrials companies
- On the plus side, its earnings per share have outperformed its peers over the last five years, increasing by 17.7% annually


AECOM doesn’t live up to our standards. We see more favorable opportunities in the market.
Why There Are Better Opportunities Than AECOM


AECOM’s stock price of $91.09 implies a valuation ratio of 14.9x forward P/E. This multiple is cheaper than most industrials peers, but we think this is justified.
Our advice is to pay up for elite businesses whose advantages are tailwinds to earnings growth. Don’t get sucked into lower-quality businesses just because they seem like bargains. These mediocre businesses often never achieve a higher multiple as hoped, a phenomenon known as a “value trap”.
3. AECOM (ACM) Research Report: Q4 CY2025 Update
Infrastructure consulting service company AECOM (NYSE:ACM) reported Q4 CY2025 results topping the market’s revenue expectations, but sales fell by 4.6% year on year to $3.83 billion. Its non-GAAP profit of $1.29 per share was 10.9% above analysts’ consensus estimates.
AECOM (ACM) Q4 CY2025 Highlights:
- Revenue: $3.83 billion vs analyst estimates of $3.74 billion (4.6% year-on-year decline, 2.5% beat)
- Adjusted EPS: $1.29 vs analyst estimates of $1.16 (10.9% beat)
- Adjusted EBITDA: $286.8 million vs analyst estimates of $265.9 million (7.5% margin, 7.9% beat)
- Management raised its full-year Adjusted EPS guidance to $5.95 at the midpoint, a 3.5% increase
- EBITDA guidance for the full year is $1.29 billion at the midpoint, above analyst estimates of $1.21 billion
- Operating Margin: 5.8%, in line with the same quarter last year
- Free Cash Flow Margin: 1.1%, down from 2.8% in the same quarter last year
- Backlog: $25.96 billion at quarter end, up 8.7% year on year
- Market Capitalization: $13.06 billion
Company Overview
Founded in 1990 when a group of engineers from five companies decided to merge, AECOM (NYSE:ACM) provides various infrastructure consulting services.
The company provides advisory, planning, consulting, architectural, and engineering design services to public and private clients. Businesses and government organizations in industries like transportation, facilities, water management and go to AECOM for its consulting services.
The company offers its consulting services to five types of markets, which include transportation, like rail, highways, bridges, and ports; water, like drought response and wastewater management; and energy, like hydropower and solar power.
The US Government makes up half of the company’s operating revenue, with the other half going to private companies. Operating revenue from the US Government is divided into multiple subsegments ranging from local municipalities to the federal government, so no single public (or private) entity makes up a significant portion of the company’s revenue source. Recurring revenue is a part of AECOM’s business model in the form of multi-year contracts and recurring consulting services for the same project.
4. Engineering and Design Services
Companies providing engineering and design services boast ever-evolving technical expertise. Compared to their counterparts who manufacture and sell physical products, these companies can also pivot faster to more trending areas due to their smaller physical asset bases. Green energy and water conservation, for example, are current themes driving incremental demand in this space. On the other hand, those providing engineering and design services are at the whim of construction and infrastructure project volumes, which tend to be cyclical and can be impacted heavily by economic factors such as interest rates.
AECOM’s competitors include Jacobs Engineering (NYSE:J), Fluor (NYSE:FLR), and KBR (NYSE:KBR).
5. Revenue Growth
Reviewing a company’s long-term sales performance reveals insights into its quality. Any business can experience short-term success, but top-performing ones enjoy sustained growth for years. Unfortunately, AECOM’s 3.7% annualized revenue growth over the last five years was sluggish. This was below our standard for the industrials sector and is a rough starting point for our analysis.
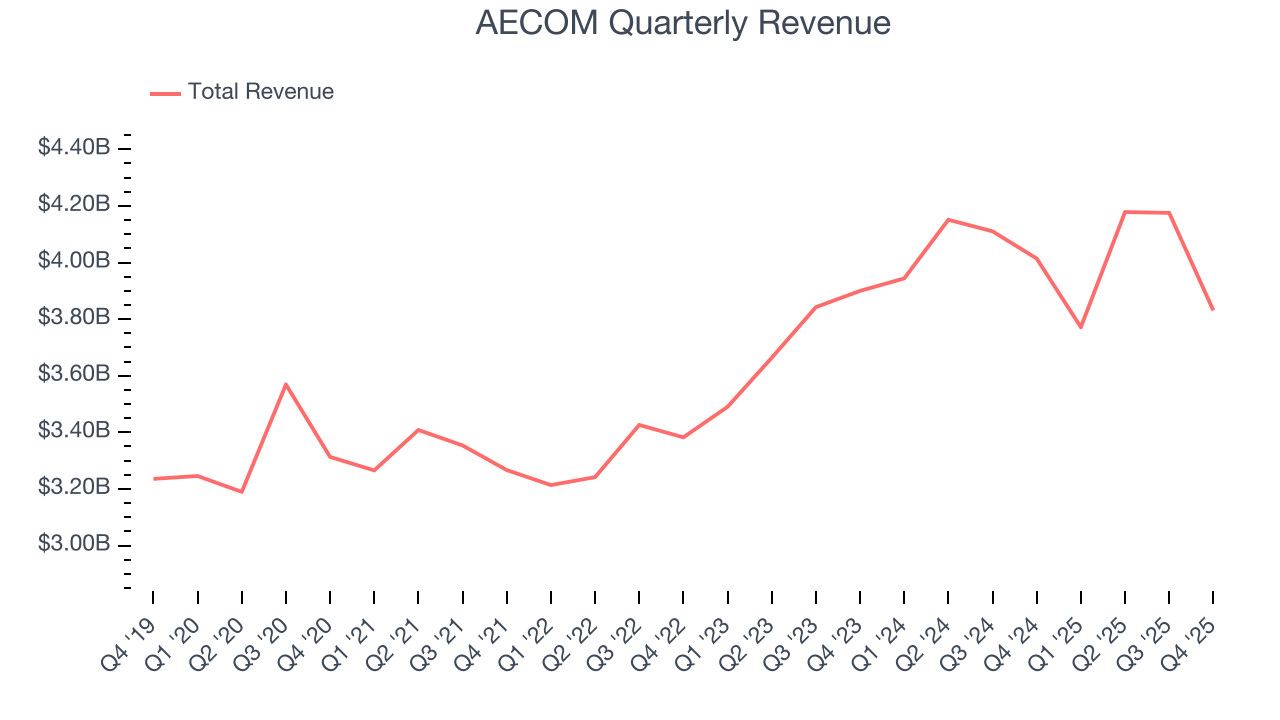
We at StockStory place the most emphasis on long-term growth, but within industrials, a half-decade historical view may miss cycles, industry trends, or a company capitalizing on catalysts such as a new contract win or a successful product line. AECOM’s annualized revenue growth of 3.5% over the last two years aligns with its five-year trend, suggesting its demand was consistently weak. 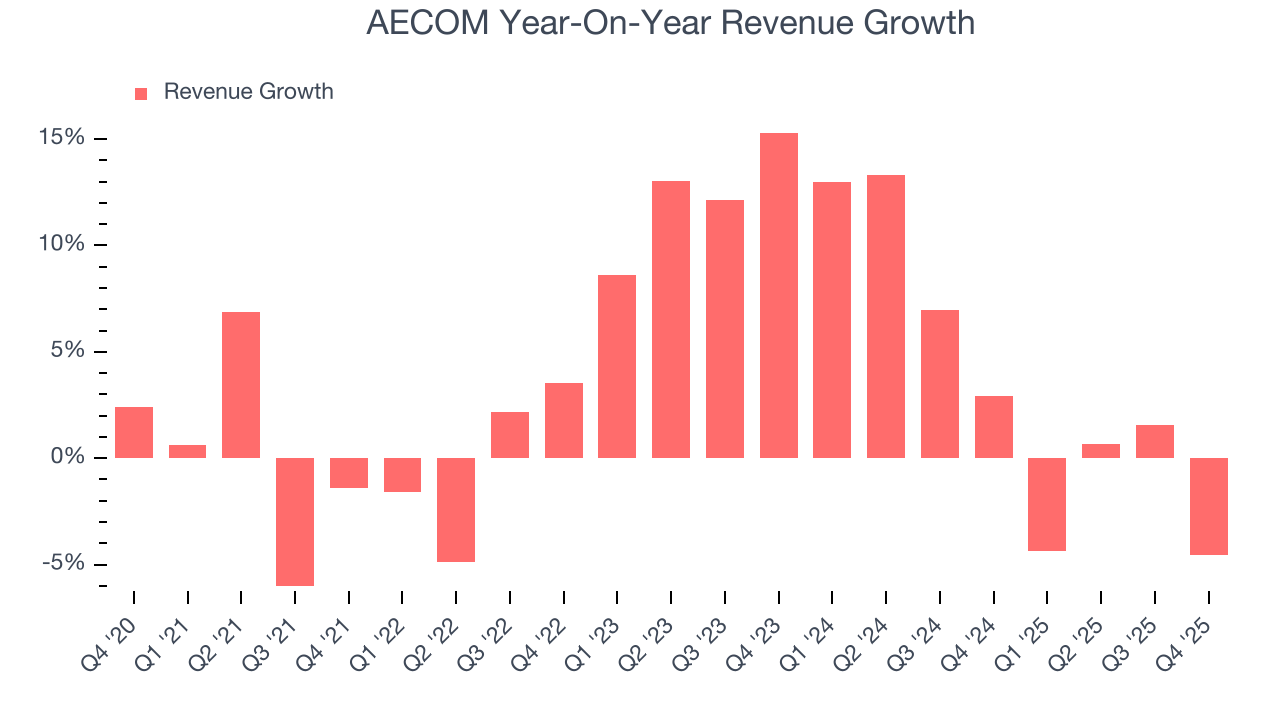
We can better understand the company’s revenue dynamics by analyzing its backlog, or the value of its outstanding orders that have not yet been executed or delivered. AECOM’s backlog reached $25.96 billion in the latest quarter and averaged 3.7% year-on-year growth over the last two years. Because this number is in line with its revenue growth, we can see the company effectively balanced its new order intake and fulfillment processes. 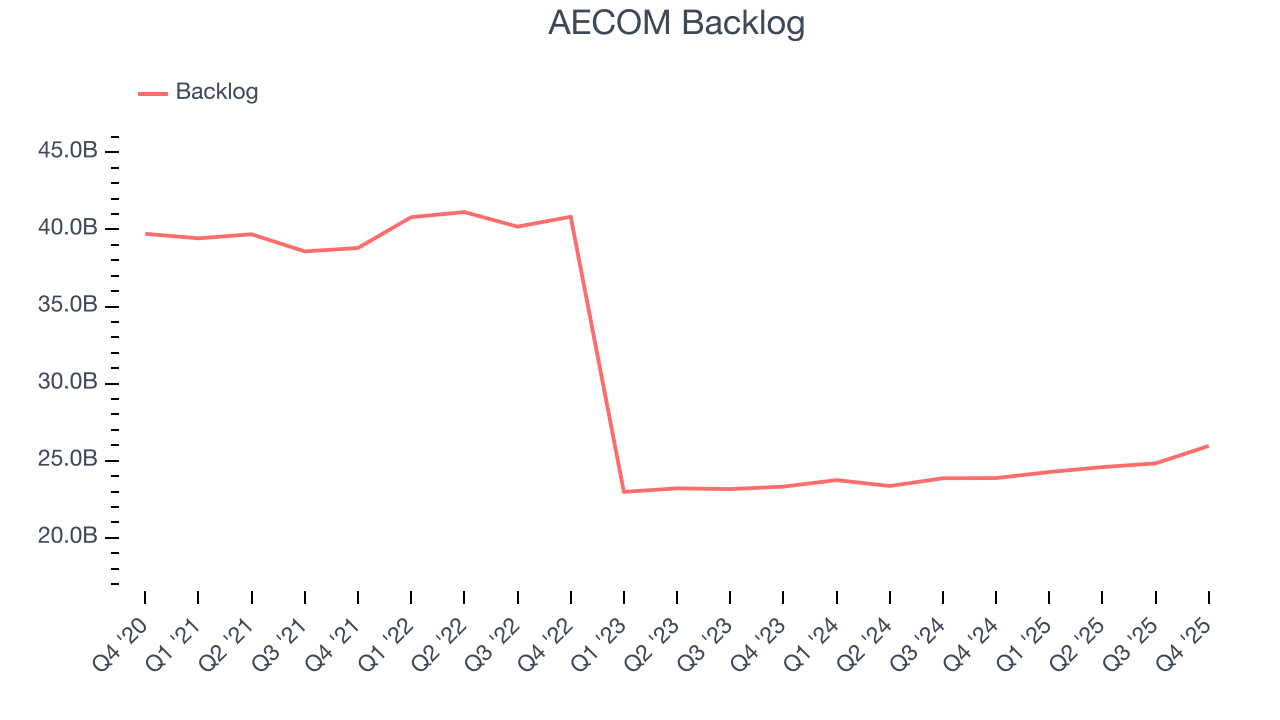
This quarter, AECOM’s revenue fell by 4.6% year on year to $3.83 billion but beat Wall Street’s estimates by 2.5%.
Looking ahead, sell-side analysts expect revenue to decline by 3.4% over the next 12 months, a deceleration versus the last two years. This projection doesn't excite us and indicates its products and services will face some demand challenges.
6. Operating Margin
AECOM was profitable over the last five years but held back by its large cost base. Its average operating margin of 4.8% was weak for an industrials business.
On the plus side, AECOM’s operating margin rose by 1.4 percentage points over the last five years, as its sales growth gave it operating leverage.
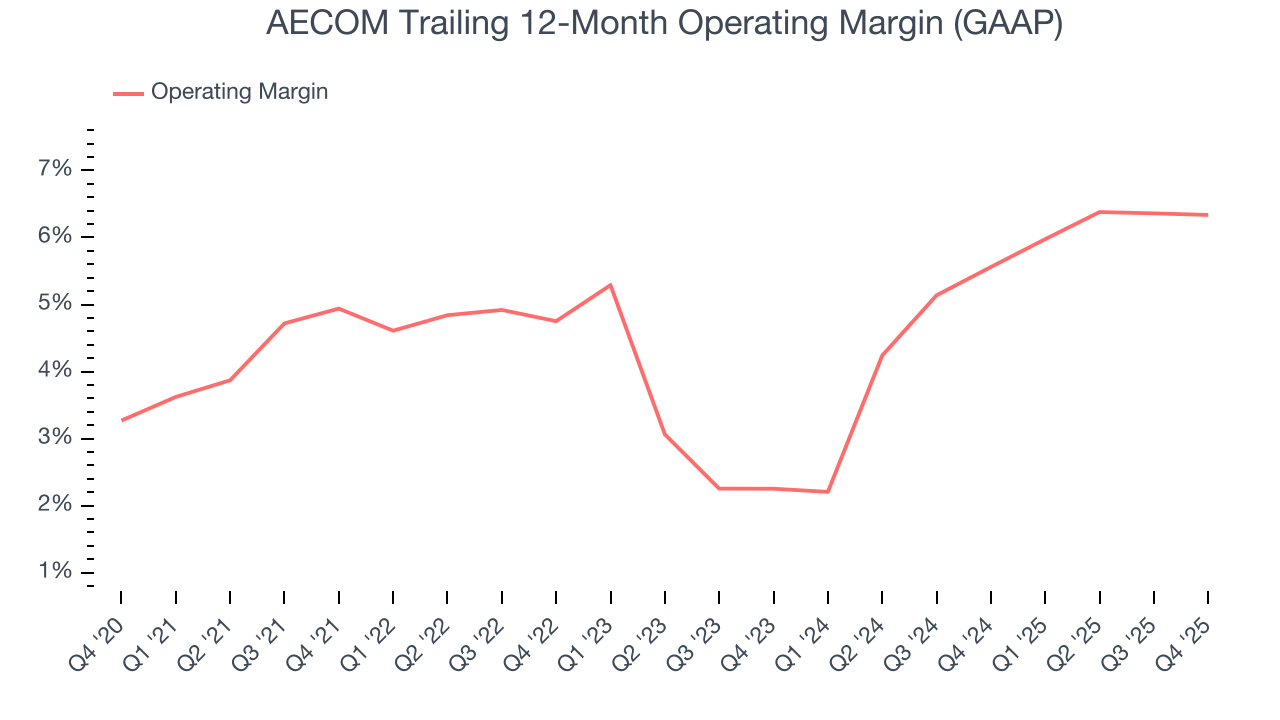
In Q4, AECOM generated an operating margin profit margin of 5.8%, in line with the same quarter last year. This indicates the company’s overall cost structure has been relatively stable.
7. Earnings Per Share
We track the long-term change in earnings per share (EPS) for the same reason as long-term revenue growth. Compared to revenue, however, EPS highlights whether a company’s growth is profitable.
AECOM’s EPS grew at an astounding 17.7% compounded annual growth rate over the last five years, higher than its 3.7% annualized revenue growth. This tells us the company became more profitable on a per-share basis as it expanded.
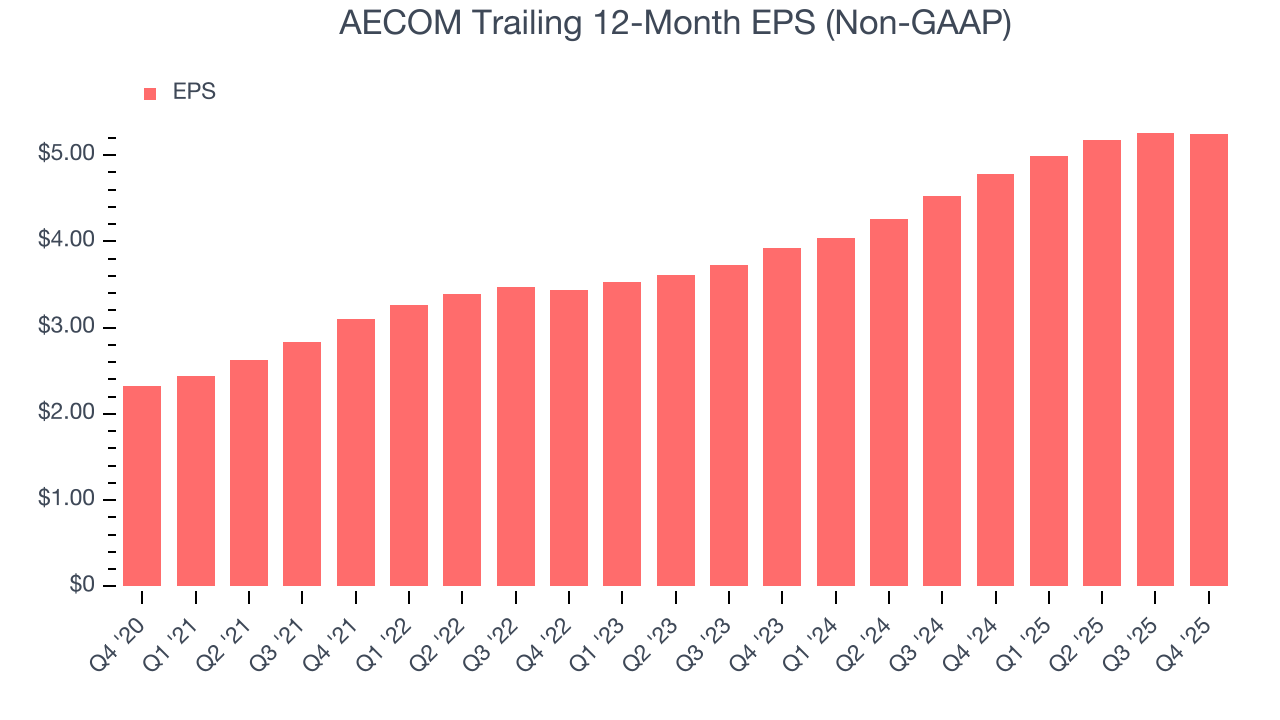
Diving into the nuances of AECOM’s earnings can give us a better understanding of its performance. As we mentioned earlier, AECOM’s operating margin was flat this quarter but expanded by 1.4 percentage points over the last five years. On top of that, its share count shrank by 14.2%. These are positive signs for shareholders because improving profitability and share buybacks turbocharge EPS growth relative to revenue growth. 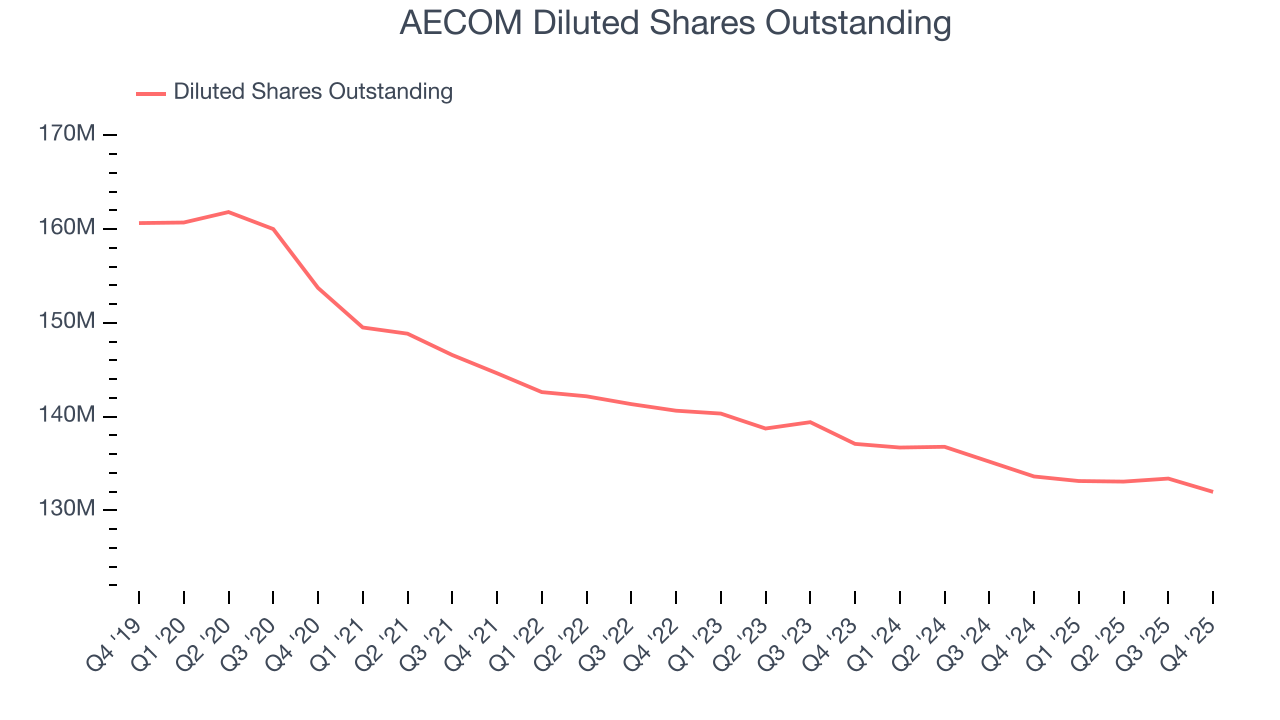
Like with revenue, we analyze EPS over a shorter period to see if we are missing a change in the business.
For AECOM, its two-year annual EPS growth of 15.6% was lower than its five-year trend. We still think its growth was good and hope it can accelerate in the future.
In Q4, AECOM reported adjusted EPS of $1.29, down from $1.31 in the same quarter last year. Despite falling year on year, this print easily cleared analysts’ estimates. Over the next 12 months, Wall Street expects AECOM’s full-year EPS of $5.24 to grow 2.5%.
8. Cash Is King
Although earnings are undoubtedly valuable for assessing company performance, we believe cash is king because you can’t use accounting profits to pay the bills.
AECOM has shown weak cash profitability over the last five years, giving the company limited opportunities to return capital to shareholders. Its free cash flow margin averaged 4.4%, subpar for an industrials business.
Taking a step back, we can see that AECOM’s margin dropped by 1.9 percentage points during that time. This along with its unexciting margin put the company in a tough spot, and shareholders are likely hoping it can reverse course. If the trend continues, it could signal it’s becoming a more capital-intensive business.
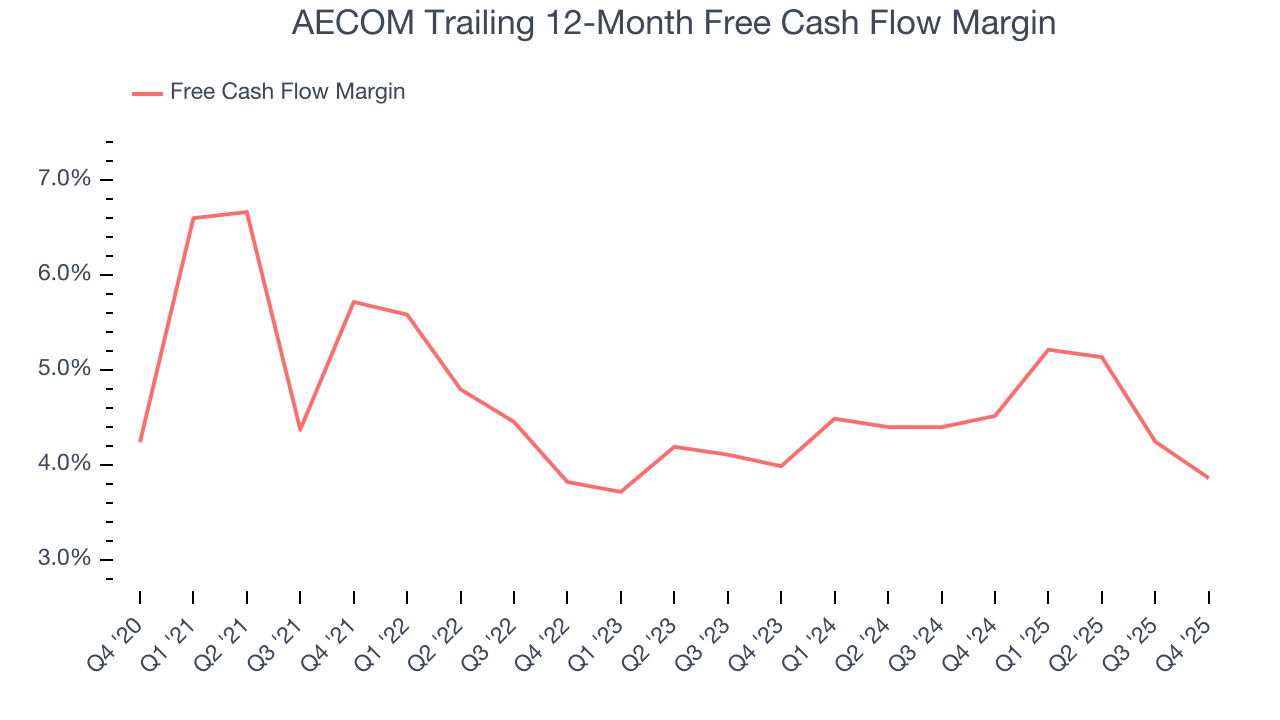
AECOM’s free cash flow clocked in at $41.9 million in Q4, equivalent to a 1.1% margin. The company’s cash profitability regressed as it was 1.7 percentage points lower than in the same quarter last year, suggesting its historical struggles have dragged on.
9. Return on Invested Capital (ROIC)
EPS and free cash flow tell us whether a company was profitable while growing its revenue. But was it capital-efficient? Enter ROIC, a metric showing how much operating profit a company generates relative to the money it has raised (debt and equity).
Although AECOM hasn’t been the highest-quality company lately because of its poor top-line performance, it historically found a few growth initiatives that worked out well. Its five-year average ROIC was 14.8%, impressive for an industrials business.
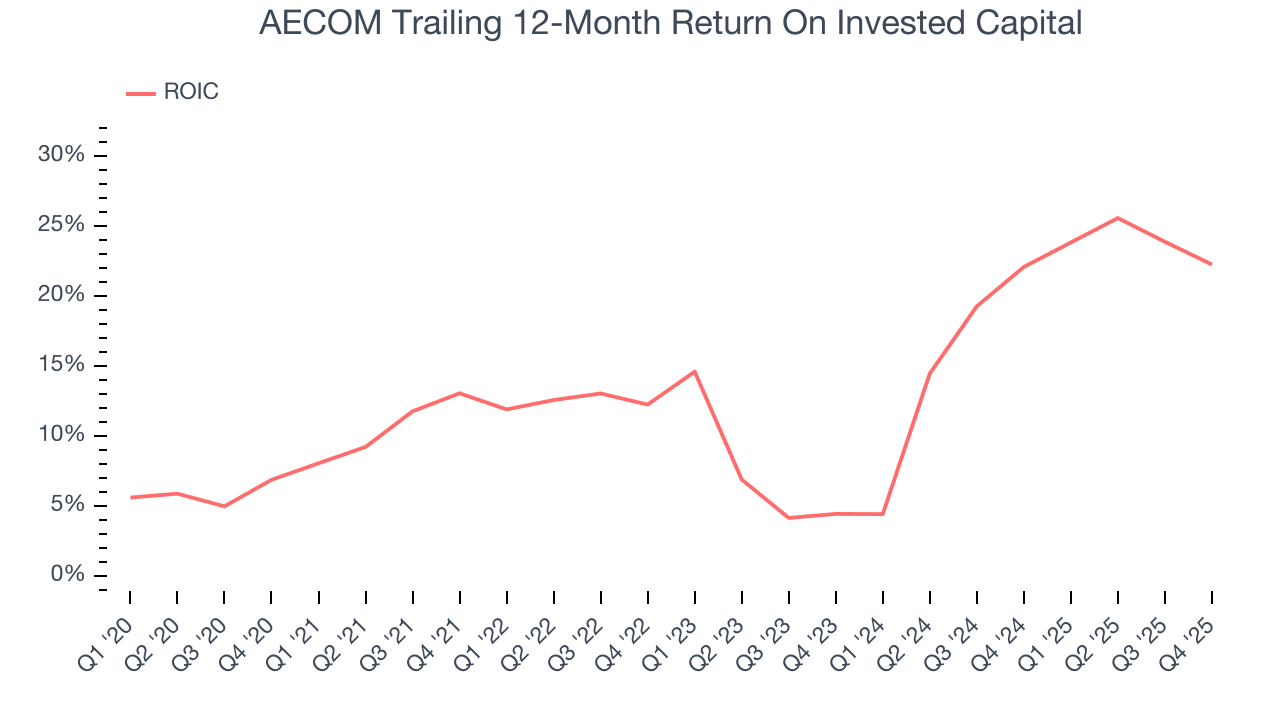
We like to invest in businesses with high returns, but the trend in a company’s ROIC is what often surprises the market and moves the stock price. Fortunately, AECOM’s has increased over the last few years. This is a good sign, and we hope the company can keep improving.
10. Balance Sheet Assessment
AECOM reported $1.25 billion of cash and $2.74 billion of debt on its balance sheet in the most recent quarter. As investors in high-quality companies, we primarily focus on two things: 1) that a company’s debt level isn’t too high and 2) that its interest payments are not excessively burdening the business.
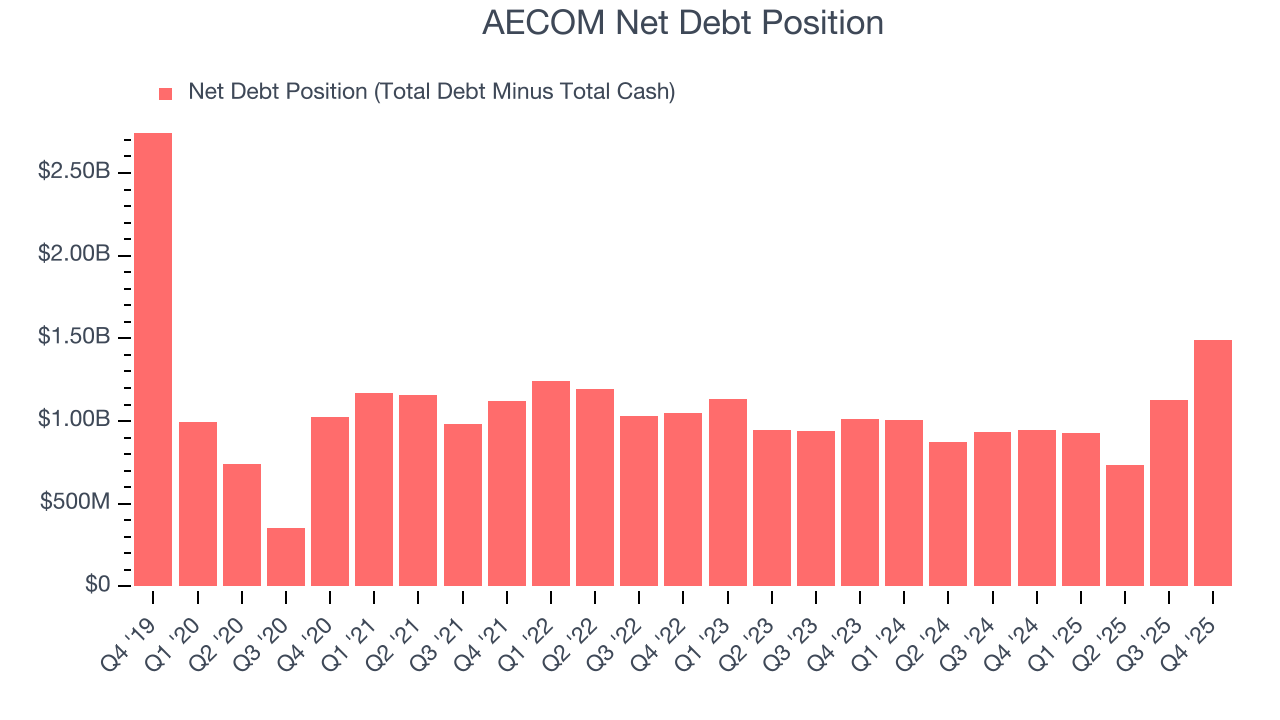
With $1.22 billion of EBITDA over the last 12 months, we view AECOM’s 1.2× net-debt-to-EBITDA ratio as safe. We also see its $63.42 million of annual interest expenses as appropriate. The company’s profits give it plenty of breathing room, allowing it to continue investing in growth initiatives.
11. Key Takeaways from AECOM’s Q4 Results
We were impressed by how significantly AECOM blew past analysts’ EBITDA expectations this quarter. We were also glad its full-year EBITDA guidance trumped Wall Street’s estimates. Zooming out, we think this was a solid print. The stock traded up 3% to $105.76 immediately after reporting.
12. Is Now The Time To Buy AECOM?
Updated: March 14, 2026 at 10:06 PM EDT
We think that the latest earnings result is only one piece of the bigger puzzle. If you’re deciding whether to own AECOM, you should also grasp the company’s longer-term business quality and valuation.
AECOM has some positive attributes, but it isn’t one of our picks. Although its revenue growth was weak over the last five years, its growth over the next 12 months is expected to be higher. And while AECOM’s backlog declined, its astounding EPS growth over the last five years shows its profits are trickling down to shareholders.
AECOM’s P/E ratio based on the next 12 months is 14.9x. This valuation multiple is fair, but we don’t have much faith in the company. We're pretty confident there are more exciting stocks to buy at the moment.
Wall Street analysts have a consensus one-year price target of $128.25 on the company (compared to the current share price of $91.09).