
Teradyne (TER)
Teradyne is intriguing. It generates heaps of profits that are consistently reinvested, creating a virtuous cycle of returns.― StockStory Analyst Team
1. News


2. Summary
Why Teradyne Is Interesting
Sporting most major chip manufacturers as its customers, Teradyne (NASDAQ:TER) is a US-based supplier of automated test equipment for semiconductors as well as other technologies and devices.
- Market share is on track to rise over the next 12 months as its 32.3% projected revenue growth implies demand will accelerate from its two-year trend
- Offerings are difficult to replicate at scale and result in a top-tier gross margin of 58.3%
- On the other hand, its sales stagnated over the last five years and signal the need for new growth strategies


Teradyne almost passes our quality test. If you like the story, the valuation looks fair.
Why Is Now The Time To Buy Teradyne?


At $297.37 per share, Teradyne trades at 45.9x forward P/E. It’s fair to say that this lofty multiple may result in short-term volatility, but given Teradyne’s business quality, we think the current price is justified.
Now could be a good time to invest if you believe in the story.
3. Teradyne (TER) Research Report: Q4 CY2025 Update
Semiconductor testing company Teradyne (NASDAQ:TER) reported Q4 CY2025 results topping the market’s revenue expectations, with sales up 43.9% year on year to $1.08 billion. On top of that, next quarter’s revenue guidance ($1.2 billion at the midpoint) was surprisingly good and 25.8% above what analysts were expecting. Its non-GAAP profit of $1.80 per share was 30.1% above analysts’ consensus estimates.
Teradyne (TER) Q4 CY2025 Highlights:
- Revenue: $1.08 billion vs analyst estimates of $975.6 million (43.9% year-on-year growth, 11% beat)
- Adjusted EPS: $1.80 vs analyst estimates of $1.38 (30.1% beat)
- Adjusted Operating Income: $314 million vs analyst estimates of $249.8 million (29% margin, 25.7% beat)
- Revenue Guidance for Q1 CY2026 is $1.2 billion at the midpoint, above analyst estimates of $954 million
- Adjusted EPS guidance for Q1 CY2026 is $2.07 at the midpoint, above analyst estimates of $1.25
- Operating Margin: 27.1%, up from 20.4% in the same quarter last year
- Free Cash Flow Margin: 20.2%, down from 29.9% in the same quarter last year
- Inventory Days Outstanding: 74, down from 104 in the previous quarter
- Market Capitalization: $37.75 billion
Company Overview
Sporting most major chip manufacturers as its customers, Teradyne (NASDAQ:TER) is a US-based supplier of automated test equipment for semiconductors as well as other technologies and devices.
Teradyne (NASDAQ:TER) was founded in 1960 by MIT classmates Alex d'Arbeloff and Nick DeWolf and remains headquartered in Massachusetts. The company went public on the NYSE in 1970.
Throughout the semiconductor manufacturing process, chips need to be tested to ensure they comply with accepted industry standards and are accurate and functional. Since semiconductor manufacturing is a complex and resource-intensive process, detecting flaws early in the process means saving money and time.
Historically, much of the testing was performed manually, leading to bottlenecks. Teradyne speeds testing up through automation, and their testing products range from simple, single digital measurement devices to complicated systems containing multiple instruments that automatically reveal faults on wafers or in packaged parts. This automation ensures quality control while increasing speed to market and improving production yields.
In addition to automated semiconductor testing equipment, Teradyne systems are also used to ensure the readiness of aerospace electronics systems, such as tactical aircraft and missile systems. The company also provides solutions for testing the reliability of hard drives and Wi-Fi, Bluetooth and cellular chips.
Competitors in automated testing equipment include Advantest Corporation (TSE:6857), Cohu (NASDAQ:COHU), Keysight Technologies (NYSE:KEYS), and Rohde & Schwarz.
4. Revenue Growth
Examining a company’s long-term performance can provide clues about its quality. Any business can have short-term success, but a top-tier one grows for years. Unfortunately, Teradyne struggled to consistently increase demand as its $3.19 billion of sales for the trailing 12 months was close to its revenue five years ago. This was below our standards and is a poor baseline for our analysis. Semiconductors are a cyclical industry, and long-term investors should be prepared for periods of high growth followed by periods of revenue contractions.
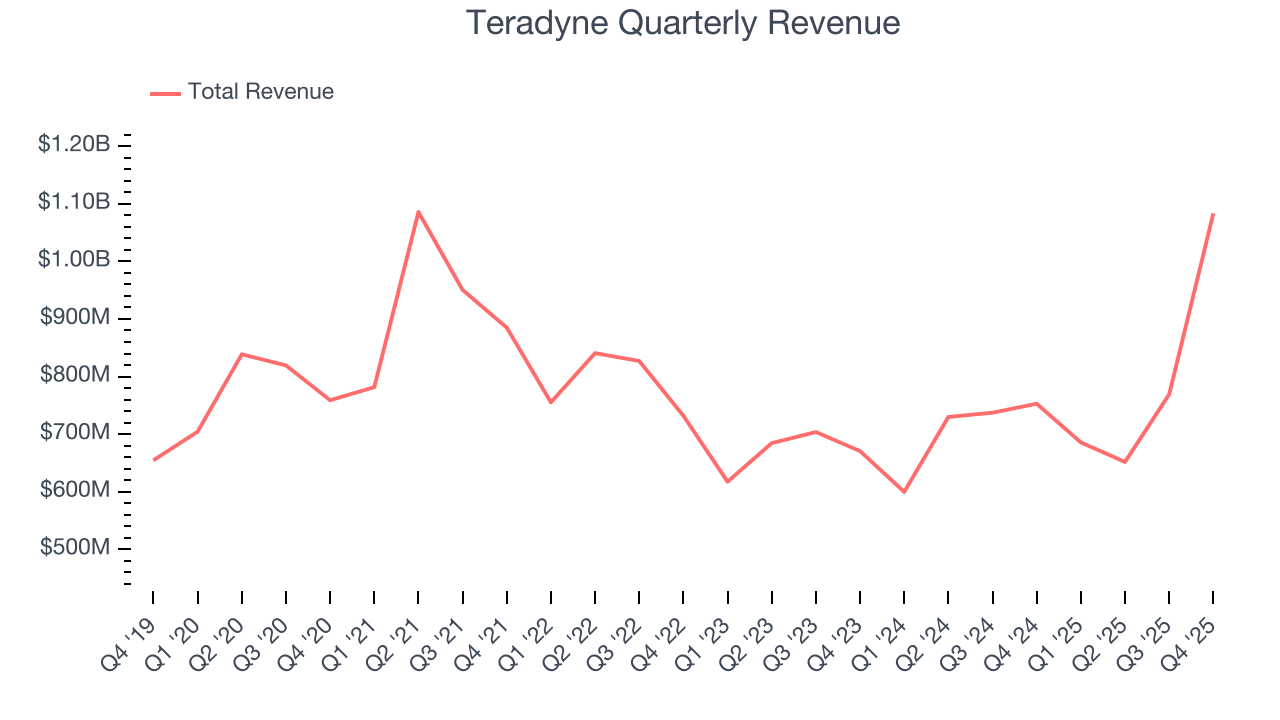
We at StockStory place the most emphasis on long-term growth, but within semiconductors, a half-decade historical view may miss new demand cycles or industry trends like AI. Teradyne’s annualized revenue growth of 9.2% over the last two years is above its five-year trend, suggesting its demand recently accelerated. 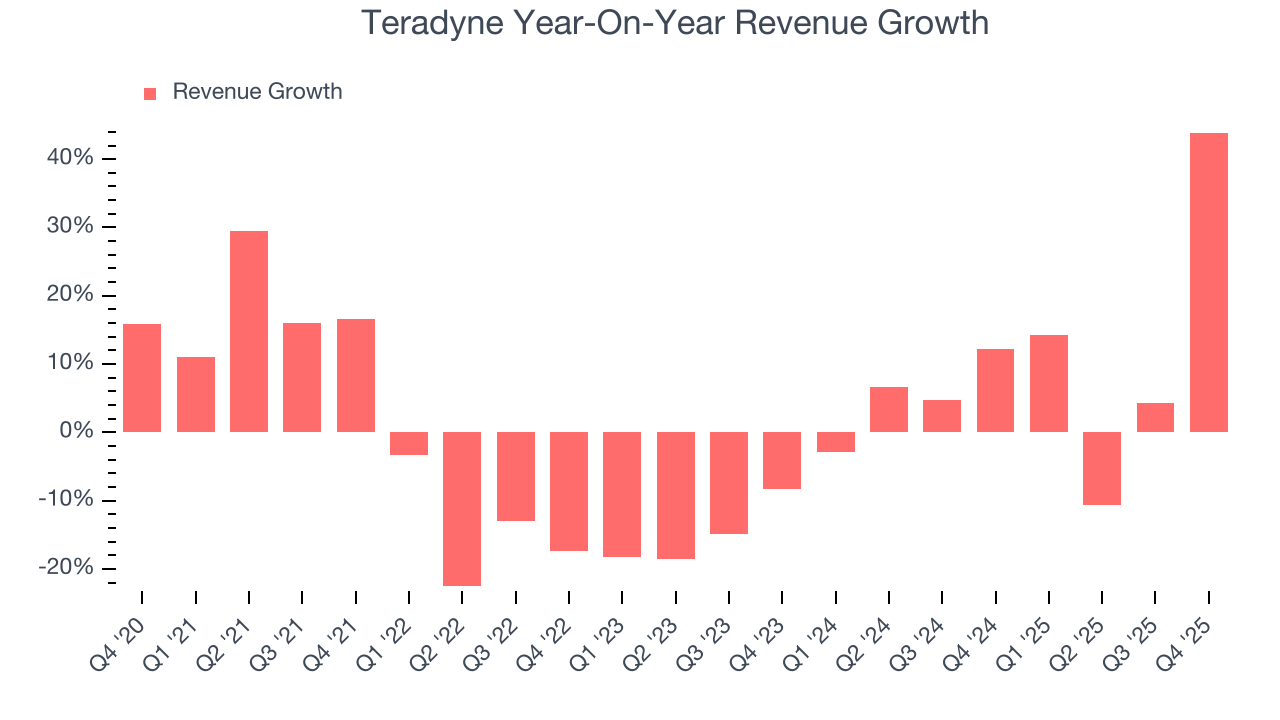
This quarter, Teradyne reported magnificent year-on-year revenue growth of 43.9%, and its $1.08 billion of revenue beat Wall Street’s estimates by 11%. Company management is currently guiding for a 75% year-on-year increase in sales next quarter.
Looking further ahead, sell-side analysts expect revenue to grow 21.8% over the next 12 months, an improvement versus the last two years. This projection is commendable and indicates its newer products and services will fuel better top-line performance.
5. Product Demand & Outstanding Inventory
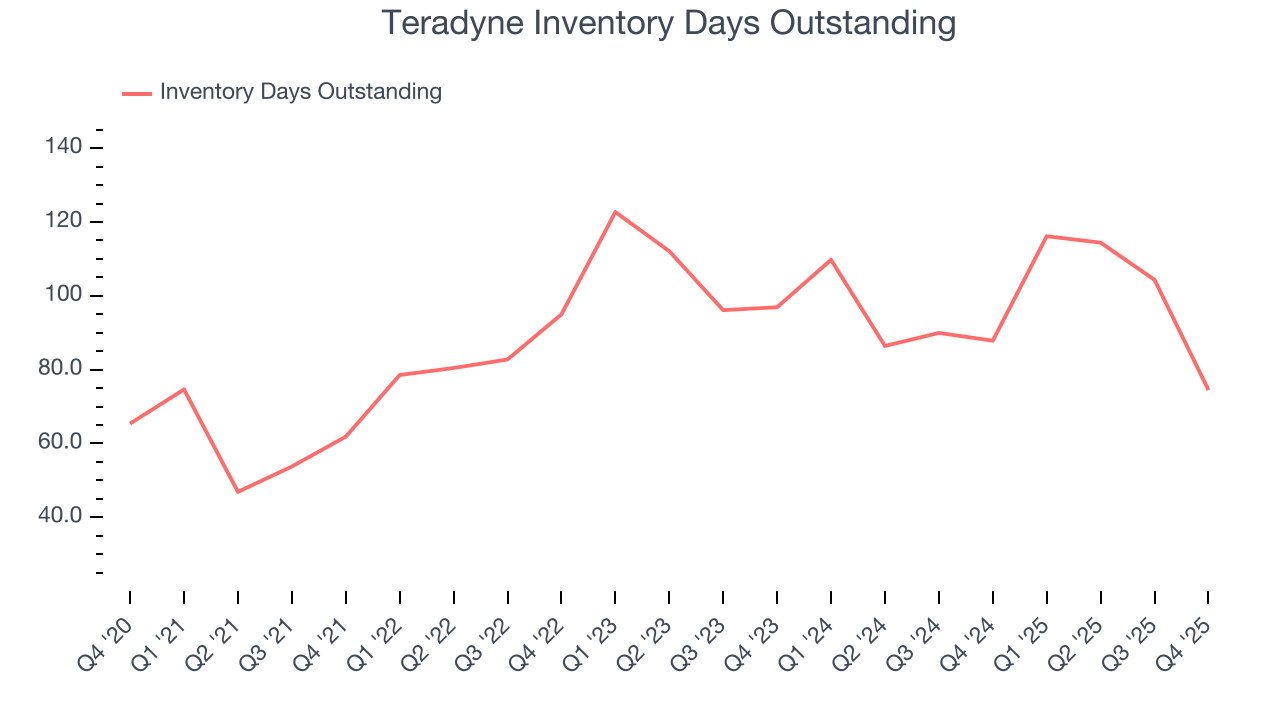
Days Inventory Outstanding (DIO) is an important metric for chipmakers, as it reflects a business’ capital intensity and the cyclical nature of semiconductor supply and demand. In a tight supply environment, inventories tend to be stable, allowing chipmakers to exert pricing power. Steadily increasing DIO can be a warning sign that demand is weak, and if inventories continue to rise, the company may have to downsize production.
This quarter, Teradyne’s DIO came in at 74, which is 15 days below its five-year average. At the moment, these numbers show no indication of an excessive inventory buildup.
6. Gross Margin & Pricing Power
Gross profit margin is a key metric to track because it shows how much money a semiconductor company gets to keep after paying for its raw materials, manufacturing, and other input costs.
Teradyne’s gross margin is well ahead of its semiconductor peers, and its strong pricing power is an output of its differentiated, value-add products. As you can see below, it averaged an excellent 58.3% gross margin over the last two years. That means Teradyne only paid its suppliers $41.72 for every $100 in revenue. 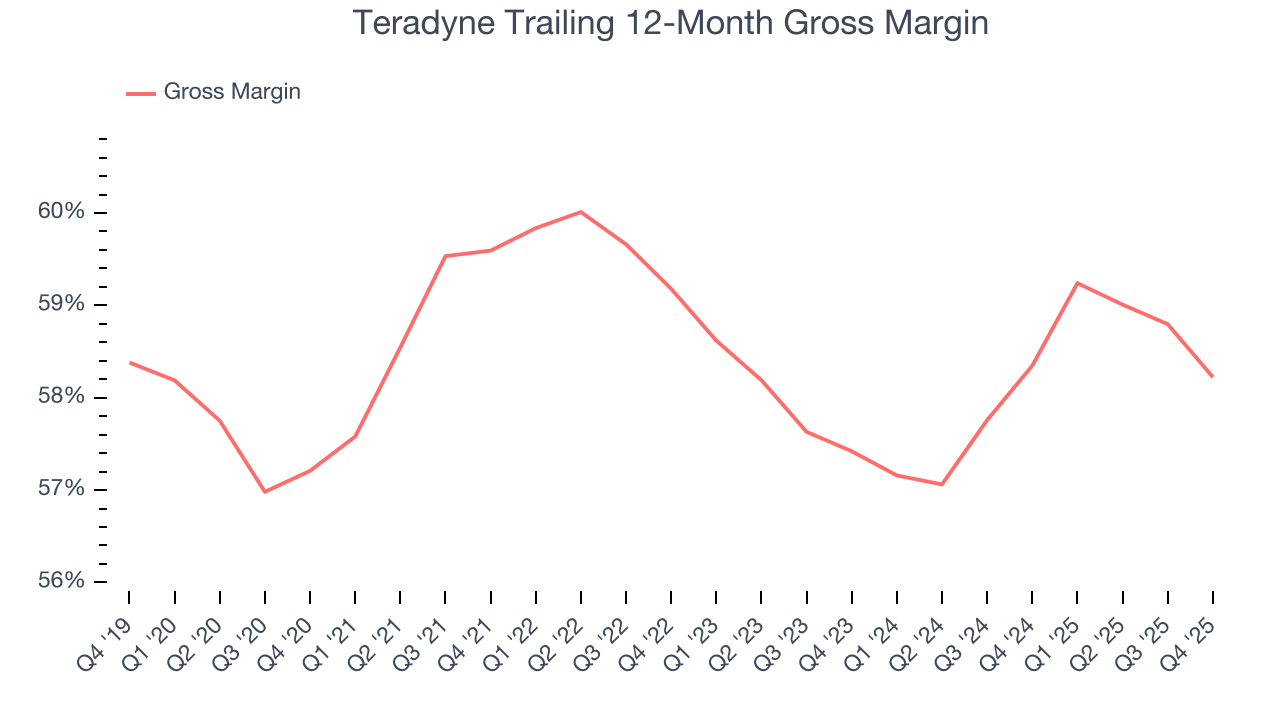
Teradyne produced a 57.2% gross profit margin in Q4, marking a 1.7 percentage point decrease from 58.9% in the same quarter last year. On a wider time horizon, the company’s full-year margin has remained steady over the past four quarters, suggesting its input costs (such as raw materials and manufacturing expenses) have been stable and it isn’t under pressure to lower prices.
7. Operating Margin
Teradyne has managed its cost base well over the last two years. It demonstrated solid profitability for a semiconductor business, producing an average operating margin of 20.7%. This result isn’t surprising as its high gross margin gives it a favorable starting point.
Looking at the trend in its profitability, Teradyne’s operating margin decreased by 12 percentage points over the last five years. Even though its historical margin was healthy, shareholders will want to see Teradyne become more profitable in the future.
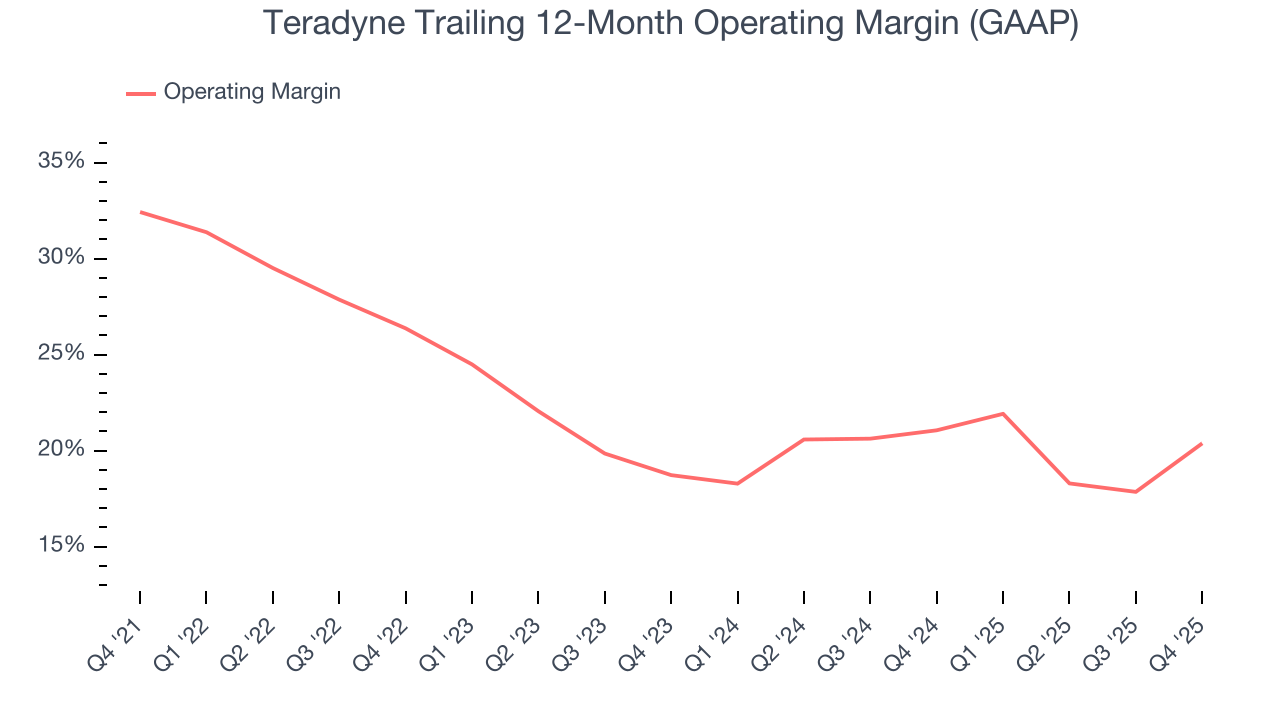
In Q4, Teradyne generated an operating margin profit margin of 27.1%, up 6.7 percentage points year on year. The increase was solid, and because its gross margin actually decreased, we can assume it was more efficient because its operating expenses like marketing, R&D, and administrative overhead grew slower than its revenue.
8. Earnings Per Share
Revenue trends explain a company’s historical growth, but the long-term change in earnings per share (EPS) points to the profitability of that growth – for example, a company could inflate its sales through excessive spending on advertising and promotions.
Sadly for Teradyne, its EPS declined by 2.9% annually over the last five years while its revenue was flat. This tells us the company struggled because its fixed cost base made it difficult to adjust to choppy demand.
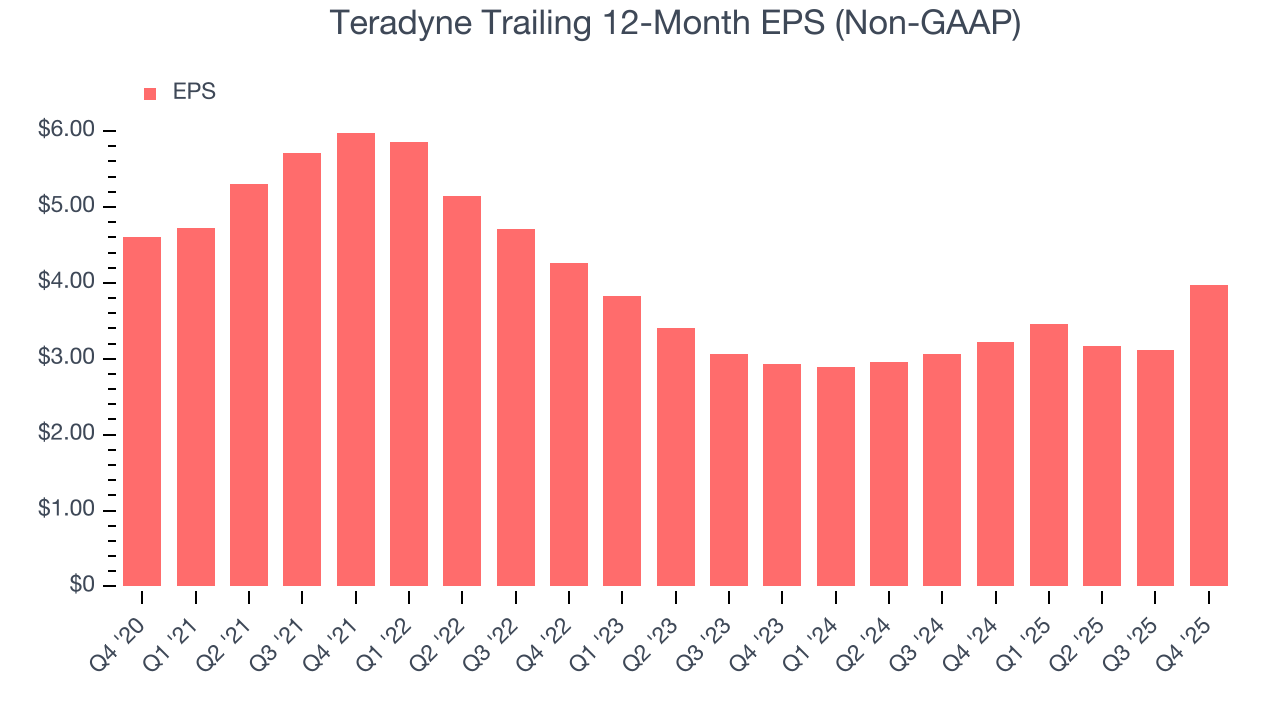
Diving into the nuances of Teradyne’s earnings can give us a better understanding of its performance. As we mentioned earlier, Teradyne’s operating margin expanded this quarter but declined by 12 percentage points over the last five years. This was the most relevant factor (aside from the revenue impact) behind its lower earnings; interest expenses and taxes can also affect EPS but don’t tell us as much about a company’s fundamentals.
In Q4, Teradyne reported adjusted EPS of $1.80, up from $0.95 in the same quarter last year. This print easily cleared analysts’ estimates, and shareholders should be content with the results. Over the next 12 months, Wall Street expects Teradyne’s full-year EPS of $3.97 to grow 33.5%.
9. Cash Is King
If you’ve followed StockStory for a while, you know we emphasize free cash flow. Why, you ask? We believe that in the end, cash is king, and you can’t use accounting profits to pay the bills.
Teradyne has shown mediocre cash profitability over the last two years, giving the company limited opportunities to return capital to shareholders. Its free cash flow margin averaged 15.4%, subpar for a semiconductor business.
Taking a step back, we can see that Teradyne’s margin dropped by 12 percentage points over the last five years. This along with its unexciting margin put the company in a tough spot, and shareholders are likely hoping it can reverse course. If the trend continues, it could signal it’s in the middle of a big investment cycle.
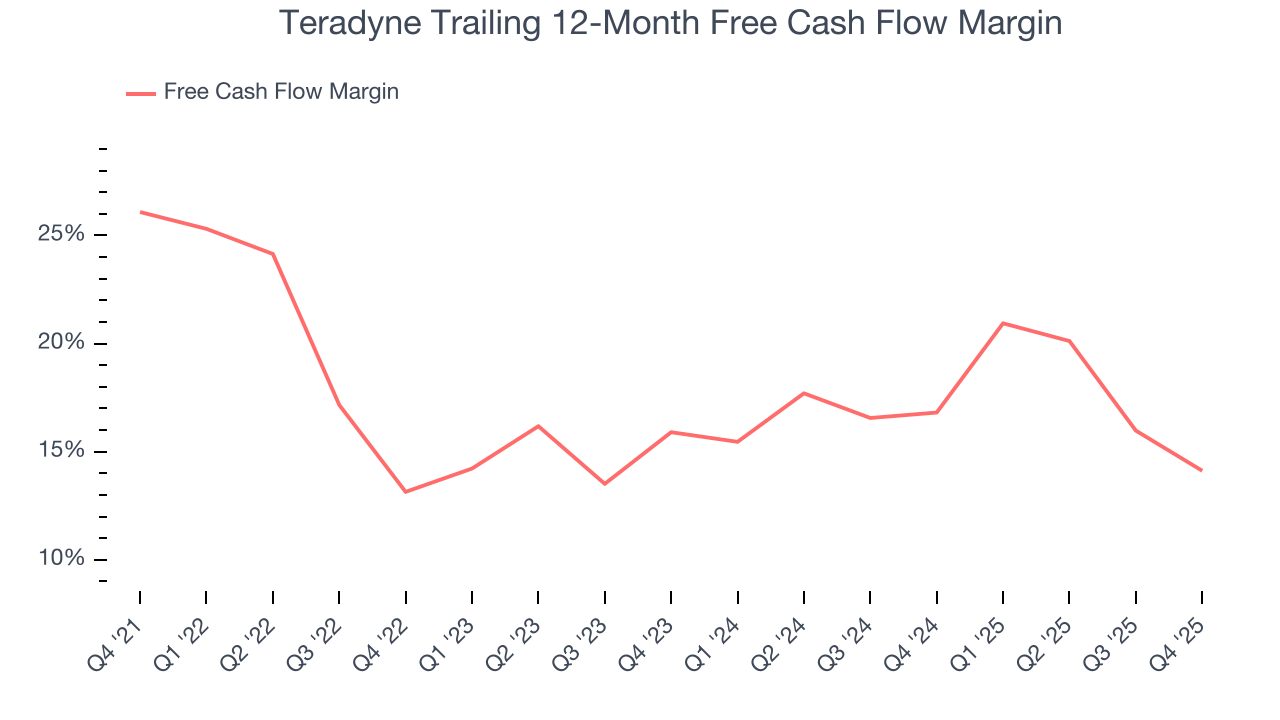
Teradyne’s free cash flow clocked in at $218.8 million in Q4, equivalent to a 20.2% margin. The company’s cash profitability regressed as it was 9.7 percentage points lower than in the same quarter last year, but it’s still above its two-year average. We wouldn’t put too much weight on this quarter’s decline because capital expenditures can be seasonal and companies often stockpile inventory in anticipation of higher demand, causing short-term swings. Long-term trends trump temporary fluctuations.
10. Return on Invested Capital (ROIC)
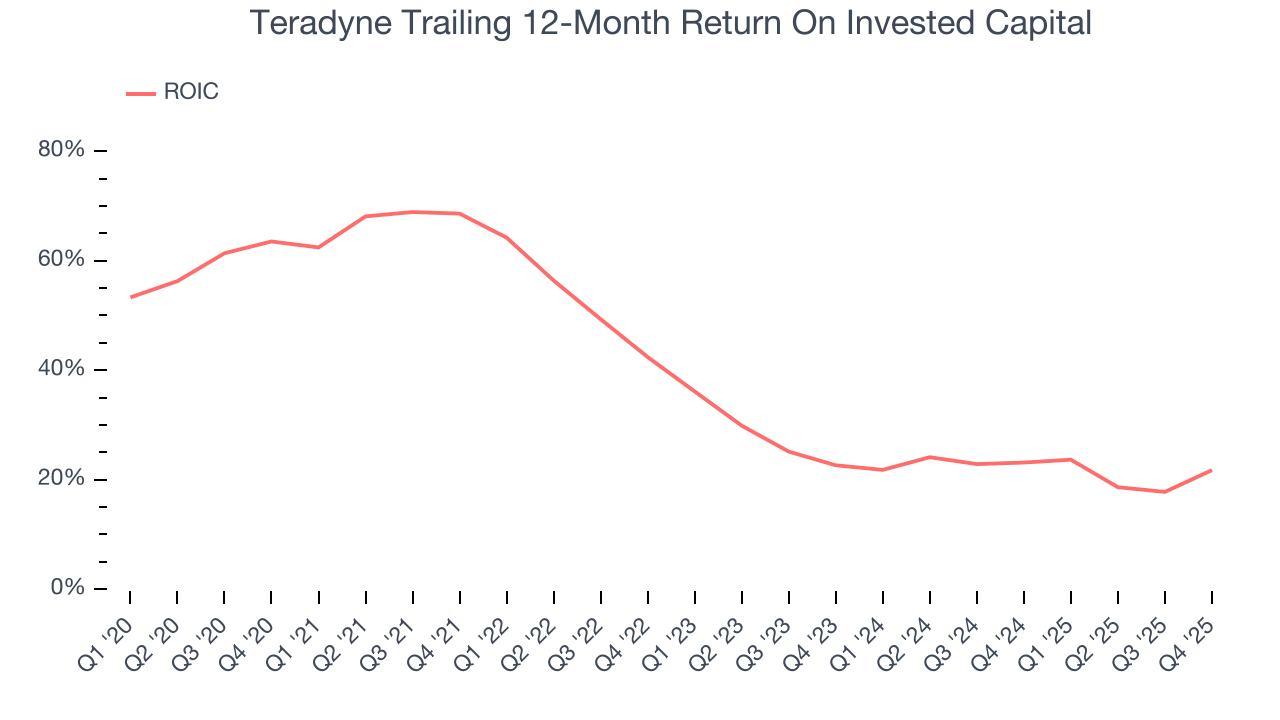
EPS and free cash flow tell us whether a company was profitable while growing its revenue. But was it capital-efficient? A company’s ROIC explains this by showing how much operating profit it makes compared to the money it has raised (debt and equity).
Although Teradyne hasn’t been the highest-quality company lately because of its poor revenue and EPS performance, it historically found a few growth initiatives that worked out well. Its five-year average ROIC was 35.7%, impressive for a semiconductor business.
11. Balance Sheet Assessment
Businesses that maintain a cash surplus face reduced bankruptcy risk.
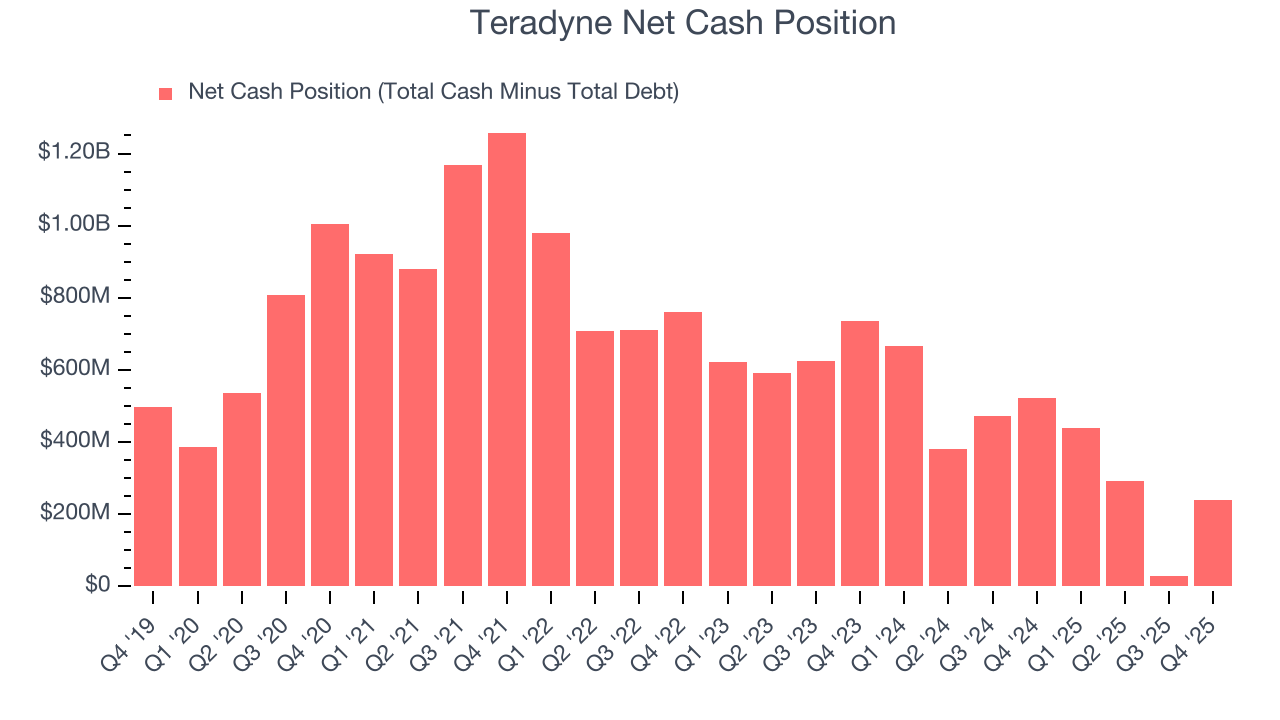
Teradyne is a profitable, well-capitalized company with $322 million of cash and $83.24 million of debt on its balance sheet. This $238.8 million net cash position gives it the freedom to borrow money, return capital to shareholders, or invest in growth initiatives. Leverage is not an issue here.
12. Key Takeaways from Teradyne’s Q4 Results
We were impressed by Teradyne’s strong improvement in inventory levels. We were also glad its EPS outperformed Wall Street’s estimates. Zooming out, we think this quarter featured some important positives. The stock traded up 10.2% to $275.31 immediately after reporting.
13. Is Now The Time To Buy Teradyne?
Updated: March 16, 2026 at 10:37 PM EDT
Before deciding whether to buy Teradyne or pass, we urge investors to consider business quality, valuation, and the latest quarterly results.
In our opinion, Teradyne is a good company. Although its revenue growth was weak over the last five years, its growth over the next 12 months is expected to be higher. And while Teradyne’s cash profitability fell over the last five years, its admirable gross margins indicate robust pricing power. On top of that, its market-beating ROIC suggests it has been a well-managed company historically.
Teradyne’s P/E ratio based on the next 12 months is 45.9x. Looking at the semiconductor space right now, Teradyne trades at a compelling valuation. If you trust the business and its direction, this is an ideal time to buy.
Wall Street analysts have a consensus one-year price target of $314.18 on the company (compared to the current share price of $297.37), implying they see 5.7% upside in buying Teradyne in the short term.