
TFS Financial (TFSL)
TFS Financial keeps us up at night. Its weak sales growth and low returns on capital show it struggled to generate demand and profits.― StockStory Analyst Team
1. News


2. Summary
Why We Think TFS Financial Will Underperform
Tracing its roots back to 1938 during the Great Depression era when savings and loans were vital to homeownership, TFS Financial (NASDAQ:TFSL) is a savings and loan holding company that provides mortgage lending, deposit services, and other retail banking products primarily in Ohio and Florida.
- Earnings growth underperformed the sector average over the last five years as its EPS grew by just 2% annually
- Loan losses and capital returns have eroded its tangible book value per share this cycle as its tangible book value per share declined by 1.1% annually over the last two years
- Net interest margin of 1.7% is well below other banks, signaling its loans aren’t very profitable


TFS Financial’s quality is inadequate. We believe there are better businesses elsewhere.
Why There Are Better Opportunities Than TFS Financial


At $13.48 per share, TFS Financial trades at 2x forward P/B. Not only is TFS Financial’s multiple richer than most banking peers, but it’s also expensive for its revenue characteristics.
There are stocks out there featuring similar valuation multiples with better fundamentals. We prefer to invest in those.
3. TFS Financial (TFSL) Research Report: Q3 CY2025 Update
Retail banking company TFS Financial (NASDAQ:TFSL) met Wall Streets revenue expectations in Q3 CY2025, with sales up 14% year on year to $84.48 million. Its non-GAAP profit of $0.09 per share was in line with analysts’ consensus estimates.
TFS Financial (TFSL) Q3 CY2025 Highlights:
Company Overview
Tracing its roots back to 1938 during the Great Depression era when savings and loans were vital to homeownership, TFS Financial (NASDAQ:TFSL) is a savings and loan holding company that provides mortgage lending, deposit services, and other retail banking products primarily in Ohio and Florida.
TFS Financial operates primarily through its main subsidiary, Third Federal Savings and Loan Association of Cleveland, offering a range of financial products to consumers. The company specializes in residential mortgage lending, including fixed-rate and adjustable-rate first mortgage loans with terms up to 30 years, home equity loans, home equity lines of credit, and construction loans for individuals building personal residences.
The company maintains a competitive position by offering mortgage and deposit products with interest rates that are competitive with similar offerings in its markets. Rather than pursuing the highest possible interest rates on loans or paying the lowest rates on deposits, TFS Financial focuses on building long-term customer relationships through balanced pricing and exceptional service.
TFS Financial serves customers through a network of full-service branches in Ohio and Florida, supplemented by loan production offices, a customer service call center, and its website. While its physical branch network is concentrated in these two states, the company has expanded its reach by offering savings products in all 50 states and lending products in up to 27 states and the District of Columbia.
When a homeowner applies for a mortgage with TFS Financial, the company evaluates the application based on the borrower's creditworthiness, income verification, and property value. Unlike many mortgage lenders that sell most of their originated loans to government-sponsored enterprises, TFS Financial retains a significant portion of its loans in its own portfolio, though it does sell some fixed-rate residential mortgages while maintaining the servicing rights to preserve customer relationships.
4. Thrifts & Mortgage Finance
Thrifts & Mortgage Finance institutions operate by accepting deposits and extending loans primarily for residential mortgages, earning revenue through interest rate spreads (difference between lending rates and borrowing costs) and origination fees. The industry benefits from demographic tailwinds as millennials enter prime homebuying age, technological advancements streamlining the loan approval process, and potential interest rate stabilization improving affordability. However, significant headwinds include net interest margin compression during rate volatility, increased competition from fintech disruptors offering digital-first experiences, mounting regulatory compliance costs, and potential housing market corrections that could impact loan portfolios and default rates.
TFS Financial competes with large national banks like JPMorgan Chase (NYSE:JPM) and Bank of America (NYSE:BAC), regional banks such as KeyCorp (NYSE:KEY) and Fifth Third Bancorp (NASDAQ:FITB), and other savings and loan institutions like New York Community Bancorp (NYSE:NYCB) and Washington Federal (NASDAQ:WAFD).
5. Sales Growth
From lending activities to service fees, most banks build their revenue model around two income sources. Interest rate spreads between loans and deposits create the first stream, with the second coming from charges on everything from basic bank accounts to complex investment banking transactions. Unfortunately, TFS Financial’s 1.7% annualized revenue growth over the last five years was weak. This was below our standards and is a tough starting point for our analysis.
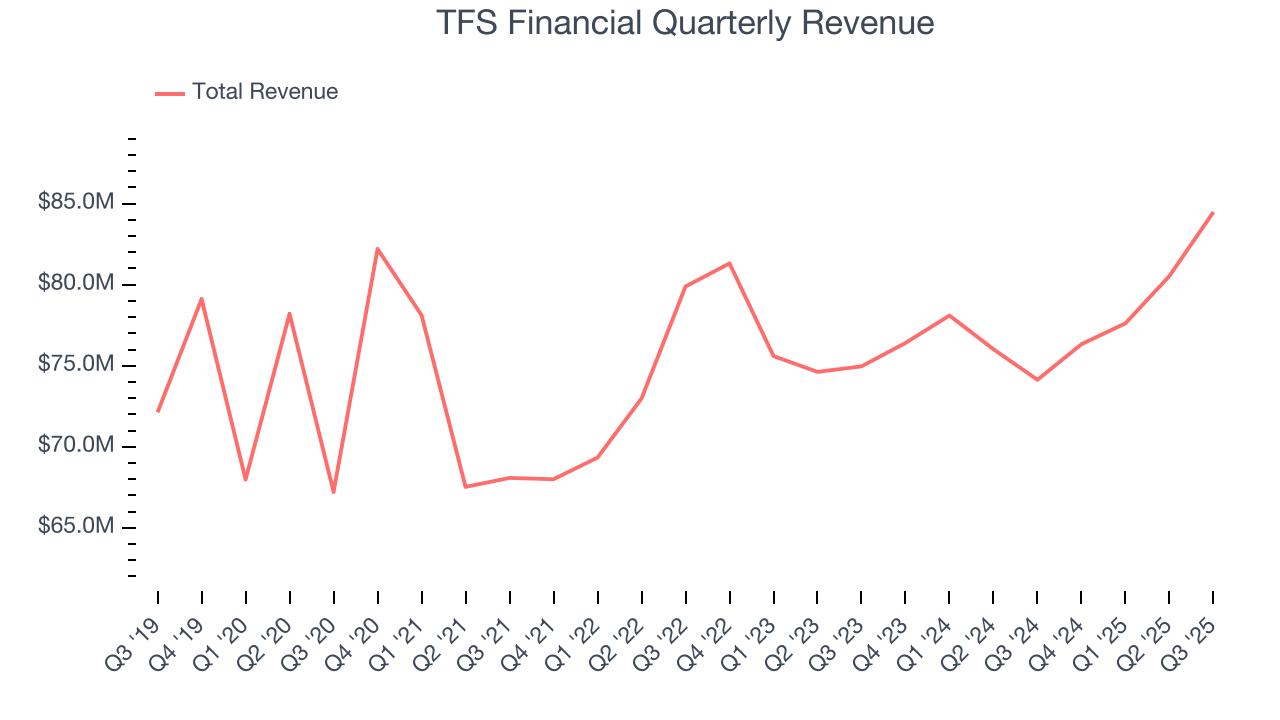
We at StockStory place the most emphasis on long-term growth, but within financials, a half-decade historical view may miss recent interest rate changes, market returns, and industry trends. TFS Financial’s annualized revenue growth of 2% over the last two years aligns with its five-year trend, suggesting its demand was consistently weak. 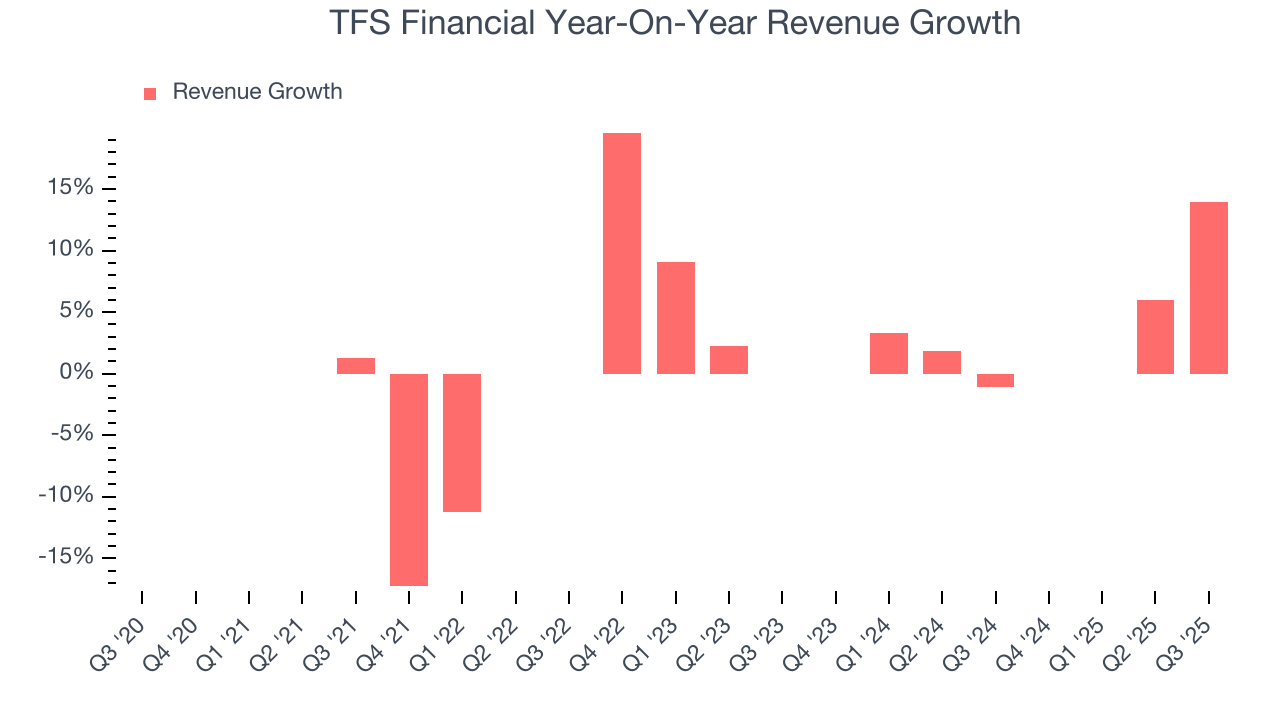 Note: Quarters not shown were determined to be outliers, impacted by outsized investment gains/losses that are not indicative of the recurring fundamentals of the business.
This quarter, TFS Financial’s year-on-year revenue growth was 14%, and its $84.48 million of revenue was in line with Wall Street’s estimates.
Net interest income made up 89.3% of the company’s total revenue during the last five years, meaning TFS Financial barely relies on non-interest income to drive its overall growth.
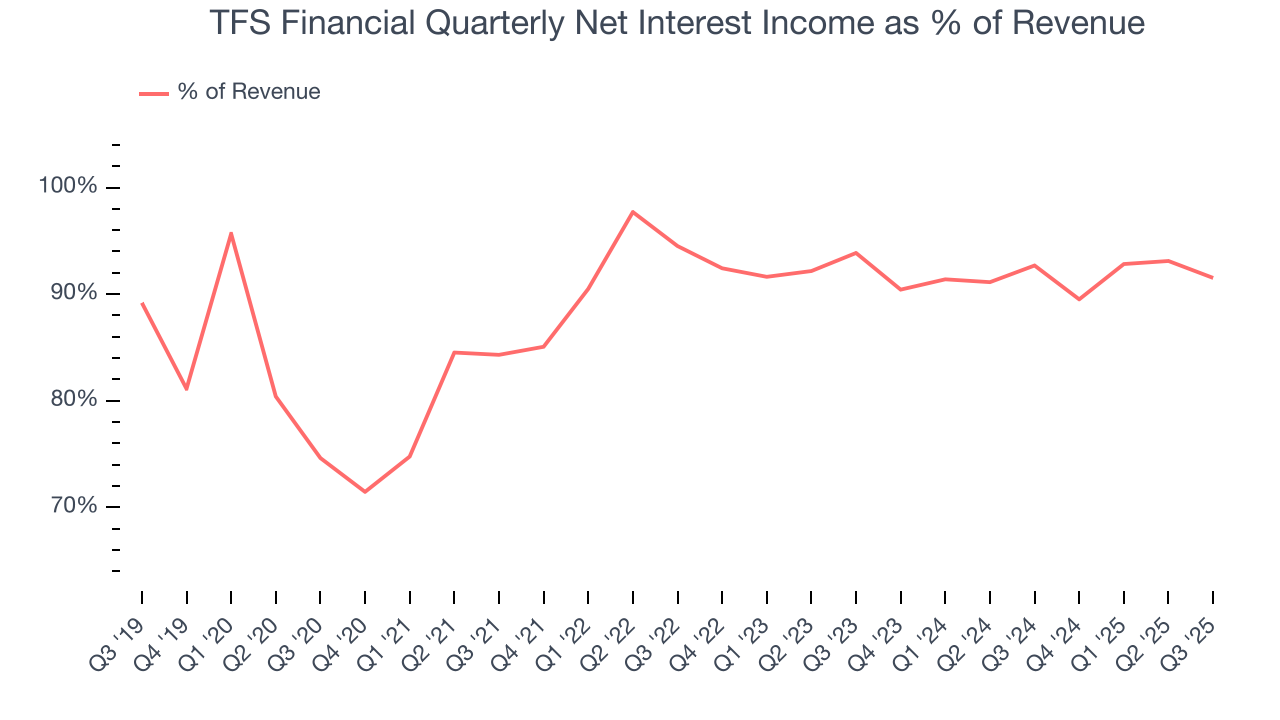
Markets consistently prioritize net interest income growth over fee-based revenue, recognizing its superior quality and recurring nature compared to the more unpredictable non-interest income streams.
6. Earnings Per Share
Revenue trends explain a company’s historical growth, but the long-term change in earnings per share (EPS) points to the profitability of that growth – for example, a company could inflate its sales through excessive spending on advertising and promotions.
TFS Financial’s weak 2% annual EPS growth over the last five years aligns with its revenue performance. This tells us it maintained its per-share profitability as it expanded.
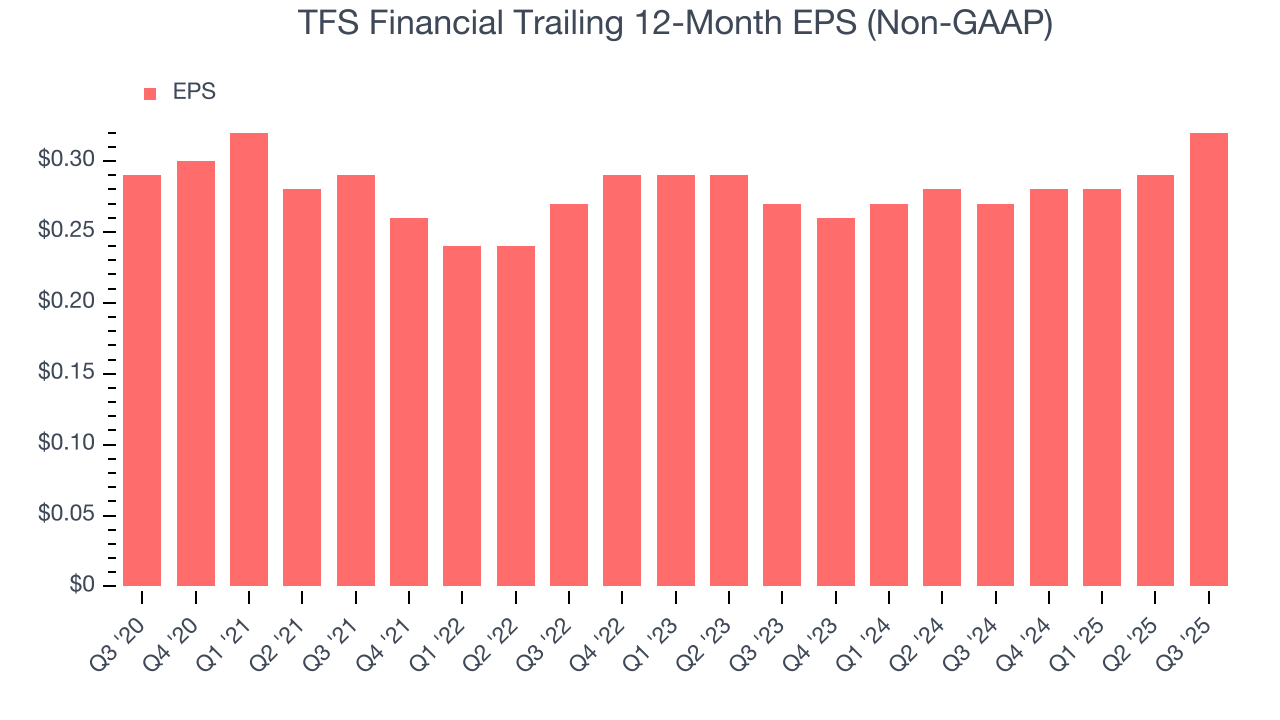
Like with revenue, we analyze EPS over a more recent period because it can provide insight into an emerging theme or development for the business.
For TFS Financial, its two-year annual EPS growth of 8.9% was higher than its five-year trend. Accelerating earnings growth is almost always an encouraging data point.
In Q3, TFS Financial reported adjusted EPS of $0.09, up from $0.06 in the same quarter last year. This print easily cleared analysts’ estimates, and shareholders should be content with the results. Over the next 12 months, Wall Street expects TFS Financial’s full-year EPS of $0.32 to grow 12.5%.
7. Tangible Book Value Per Share (TBVPS)
Banks profit by intermediating between depositors and borrowers, making them fundamentally balance sheet-driven enterprises. Market participants emphasize balance sheet quality and sustained book value growth when evaluating these institutions.
Because of this, tangible book value per share (TBVPS) emerges as the critical performance benchmark. By excluding intangible assets with uncertain liquidation values, this metric captures real, liquid net worth per share. On the other hand, EPS is often distorted by mergers and flexible loan loss accounting. TBVPS provides clearer performance insights.
TFS Financial’s TBVPS grew at a sluggish 2.5% annual clip over the last five years. TBVPS growth has also decelerated recently as it was flat over the last two years at roughly $6.79 per share.
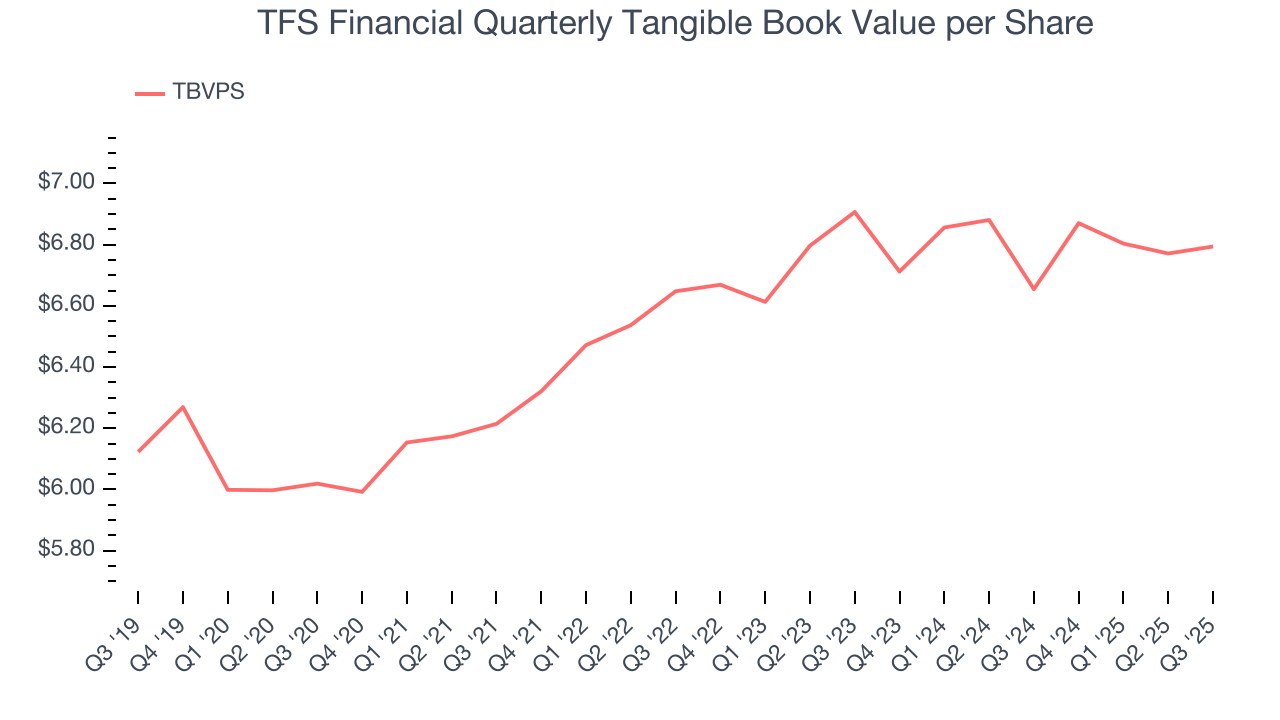
Over the next 12 months, Consensus estimates call for TFS Financial’s TBVPS to remain flat at roughly $6.86, a disappointing projection.
8. Balance Sheet Assessment
Leverage is core to a financial firm’s business model (loans funded by deposits). To ensure economic stability and avoid a repeat of the 2008 GFC, regulators require certain levels of capital and liquidity, focusing on the Tier 1 capital ratio.
Tier 1 capital is the highest-quality capital that a firm holds, consisting primarily of common stock and retained earnings, but also physical gold. It serves as the primary cushion against losses and is the first line of defense in times of financial distress.
This capital is divided by risk-weighted assets to derive the Tier 1 capital ratio. Risk-weighted means that cash and US treasury securities are assigned little risk while unsecured consumer loans and equity investments get much higher risk weights, for example.
New regulation after the 2008 financial crisis requires that all firms must maintain a Tier 1 capital ratio greater than 4.5%. On top of this, there are additional buffers based on scale, risk profile, and other regulatory classifications, so that at the end of the day, firms generally must maintain a 7-10% ratio at minimum.
Over the last two years, TFS Financial has averaged a Tier 1 capital ratio of 18.4%, which is considered safe and well capitalized in the event that macro or market conditions suddenly deteriorate.
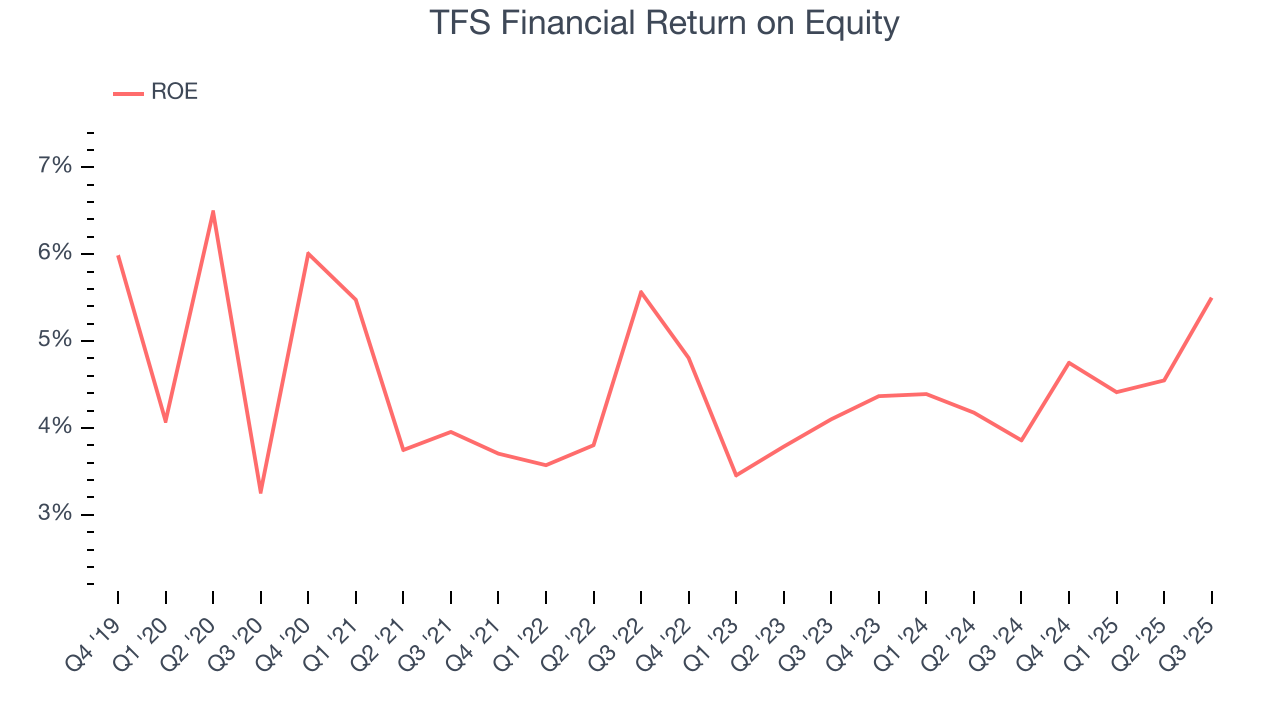
9. Return on Equity
Return on equity (ROE) reveals the profit generated per dollar of shareholder equity, which represents a key source of bank funding. Banks maintaining elevated ROE levels tend to accelerate wealth creation for shareholders via earnings retention, buybacks, and distributions.
Over the last five years, TFS Financial has averaged an ROE of 4.4%, uninspiring for a company operating in a sector where the average shakes out around 7.5%.
10. Key Takeaways from TFS Financial’s Q3 Results
It was encouraging to see TFS Financial meet analysts’ EPS expectations this quarter. We were also happy its tangible book value per share narrowly outperformed Wall Street’s estimates. Overall, this print had some key positives. The stock remained flat at $14.17 immediately following the results.
11. Is Now The Time To Buy TFS Financial?
Updated: March 21, 2026 at 12:53 AM EDT
A common mistake we notice when investors are deciding whether to buy a stock or not is that they simply look at the latest earnings results. Business quality and valuation matter more, so we urge you to understand these dynamics as well.
We see the value of companies driving economic growth, but in the case of TFS Financial, we’re out. For starters, its revenue growth was weak over the last five years. While its anticipated efficiency ratio over the next year signals it will gain leverage on its fixed costs, the downside is its weak EPS growth over the last five years shows it’s failed to produce meaningful profits for shareholders. On top of that, its net interest margin limits its operating profit potential compared to other banks that can earn more, all else equal..
TFS Financial’s P/B ratio based on the next 12 months is 2x. This multiple tells us a lot of good news is priced in - you can find more timely opportunities elsewhere.
Wall Street analysts have a consensus one-year price target of $14.50 on the company (compared to the current share price of $13.48).