
T. Rowe Price (TROW)
We aren’t fans of T. Rowe Price. Its revenue growth has been weak and its profitability has caved, showing it’s struggling to adapt.― StockStory Analyst Team
1. News


2. Summary
Why We Think T. Rowe Price Will Underperform
Founded in 1937 by Thomas Rowe Price Jr., who pioneered the growth stock investing approach, T. Rowe Price (NASDAQ:TROW) is an investment management firm that offers mutual funds, advisory services, and retirement planning solutions to individuals and institutions.
- Performance over the past five years shows its incremental sales were less profitable as its earnings per share were flat
- Sales trends were unexciting over the last five years as its 3.5% annual growth was below the typical financials company
- One positive is that its industry-leading 21% return on equity demonstrates management’s skill in finding high-return investments


T. Rowe Price’s quality doesn’t meet our hurdle. There are more promising prospects in the market.
Why There Are Better Opportunities Than T. Rowe Price


T. Rowe Price’s stock price of $88.15 implies a valuation ratio of 8.6x forward P/E. This certainly seems like a cheap stock, but we think there are valid reasons why it trades this way.
We’d rather pay up for companies with elite fundamentals than get a bargain on weak ones. Cheap stocks can be value traps, and as their performance deteriorates, they will stay cheap or get even cheaper.
3. T. Rowe Price (TROW) Research Report: Q4 CY2025 Update
Investment management firm T. Rowe Price (NASDAQ:TROW) fell short of the markets revenue expectations in Q4 CY2025 as sales rose 5% year on year to $1.93 billion. Its non-GAAP profit of $2.44 per share was 1% below analysts’ consensus estimates.
T. Rowe Price (TROW) Q4 CY2025 Highlights:
- Assets Under Management: $1.8 trillion vs analyst estimates of $1.79 trillion (12% year-on-year growth, 0.7% beat)
- Advisory and Services Fees: $1.74 billion vs analyst estimates of $1.74 billion (4.2% year-on-year growth, in line)
- Revenue: $1.93 billion vs analyst estimates of $1.95 billion (5% year-on-year growth, 0.7% miss)
- Pre-tax Profit: $613.1 million (31.7% margin)
- Adjusted EPS: $2.44 vs analyst expectations of $2.46 (1% miss)
- Market Capitalization: $22.4 billion
Company Overview
Founded in 1937 by Thomas Rowe Price Jr., who pioneered the growth stock investing approach, T. Rowe Price (NASDAQ:TROW) is an investment management firm that offers mutual funds, advisory services, and retirement planning solutions to individuals and institutions.
T. Rowe Price manages assets across equity, fixed income, and multi-asset strategies through a research-driven investment approach. The firm's investment professionals conduct fundamental analysis to identify companies with strong growth potential, solid management teams, and sustainable competitive advantages. This research forms the foundation for the hundreds of mutual funds and other investment vehicles the company offers to its diverse client base.
The company serves two main client segments: individual investors and institutional clients. Individual investors access T. Rowe Price's products through financial advisors, retirement plans, or directly through the company's platform. Institutional clients include corporations, public funds, foundations, and financial intermediaries who utilize the firm's investment strategies for their portfolios or offer them to their own clients.
For example, a university endowment might hire T. Rowe Price to manage a portion of its assets in a global equity strategy, while an individual investor might invest in a T. Rowe Price target-date retirement fund through their employer's 401(k) plan. The firm generates revenue primarily through management fees calculated as a percentage of assets under management, with fee rates varying based on investment strategy, asset class, and account size.
T. Rowe Price operates globally with offices across North America, Europe, Asia, and Australia, allowing the firm to provide investment expertise across different markets. The company has built its reputation on a culture of integrity, disciplined risk management, and collaborative decision-making, which has helped it navigate multiple market cycles while maintaining client trust.
4. Custody Bank
Custody banks safeguard financial assets and provide services like settlement, accounting, and regulatory compliance for institutional investors. Growth opportunities stem from increasing global assets under custody, demand for data analytics, and blockchain technology adoption for settlement efficiency. Challenges include fee pressure from large clients, substantial technology investment requirements, and competition from both traditional players and fintech firms entering the space.
T. Rowe Price competes with other major asset managers including BlackRock (NYSE:BLK), Vanguard Group, Fidelity Investments, Franklin Templeton (NYSE:BEN), and Invesco (NYSE:IVZ) in the increasingly competitive investment management industry.
5. Revenue Growth
A company’s long-term sales performance is one signal of its overall quality. Any business can have short-term success, but a top-tier one grows for years. Regrettably, T. Rowe Price’s revenue grew at a sluggish 3.5% compounded annual growth rate over the last five years. This was below our standard for the financials sector and is a rough starting point for our analysis.
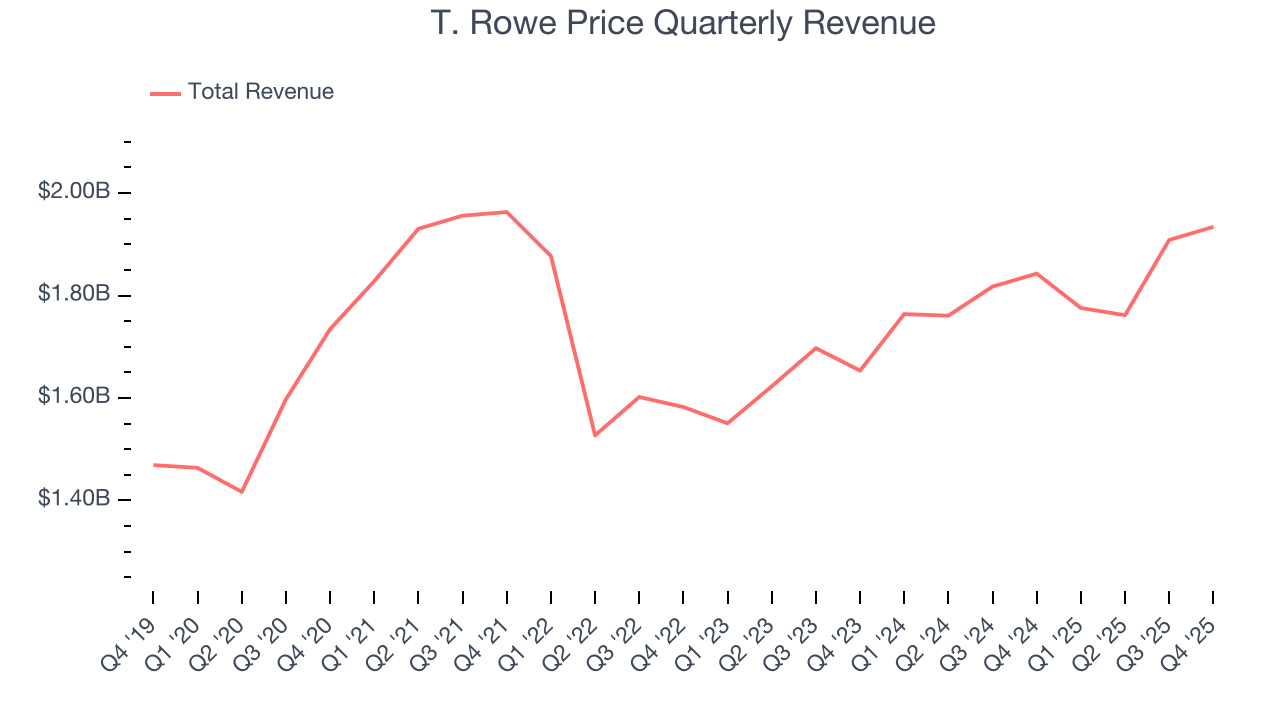
We at StockStory place the most emphasis on long-term growth, but within financials, a half-decade historical view may miss recent interest rate changes, market returns, and industry trends. T. Rowe Price’s annualized revenue growth of 6.4% over the last two years is above its five-year trend, but we were still disappointed by the results. 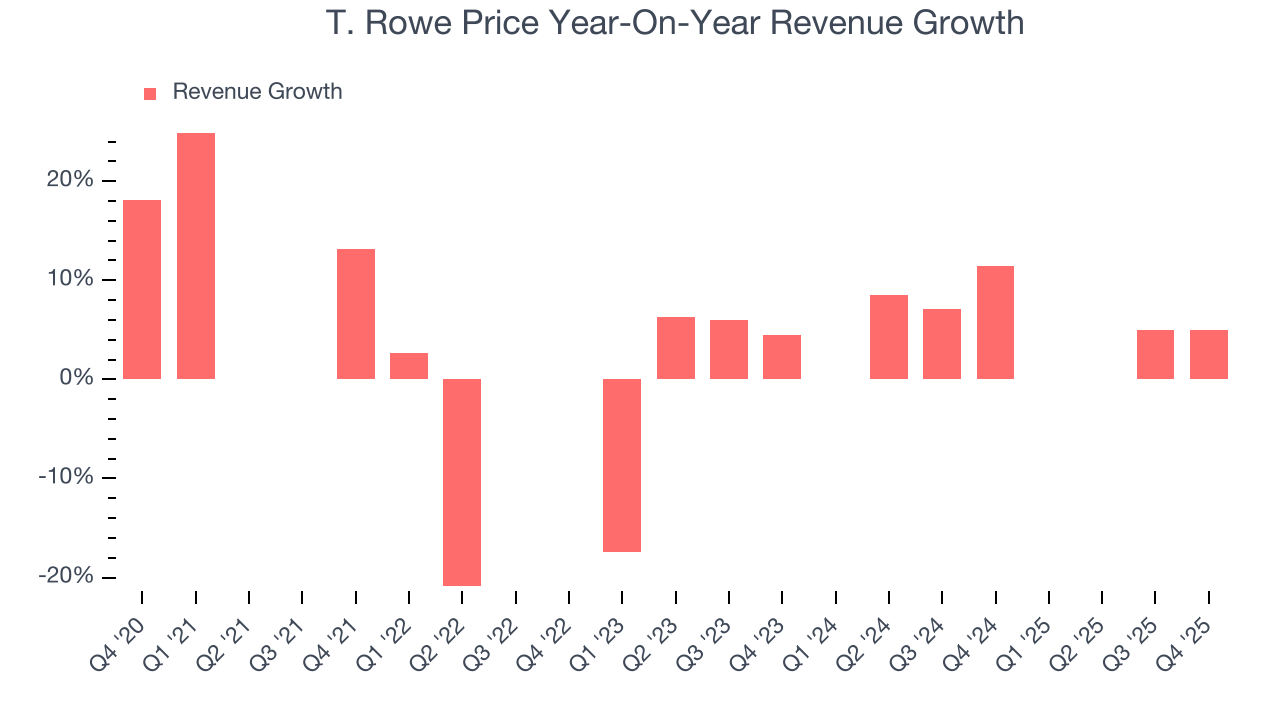 Note: Quarters not shown were determined to be outliers, impacted by outsized investment gains/losses that are not indicative of the recurring fundamentals of the business.
This quarter, T. Rowe Price’s revenue grew by 5% year on year to $1.93 billion, falling short of Wall Street’s estimates.
6. Assets Under Management (AUM)
Assets Under Management (AUM) encompasses all client funds under a firm's investment management umbrella. The recurring fee structure on these assets provides consistent revenue generation, offering financial stability even during periods of poor investment returns, though sustained underperformance can impact future asset flows.
T. Rowe Price’s AUM has grown at an annual rate of 6.3% over the last five years, slightly worse than the broader financials industry but faster than its total revenue. When analyzing T. Rowe Price’s AUM over the last two years, we can see that growth accelerated to 11% annually. Fundraising or short-term investment performance were net contributors for the company over this shorter period since assets grew faster than total revenue. Just remember that while assets are relevant to watch, we don't place too much emphasis on them because they ebb and flow with the market.
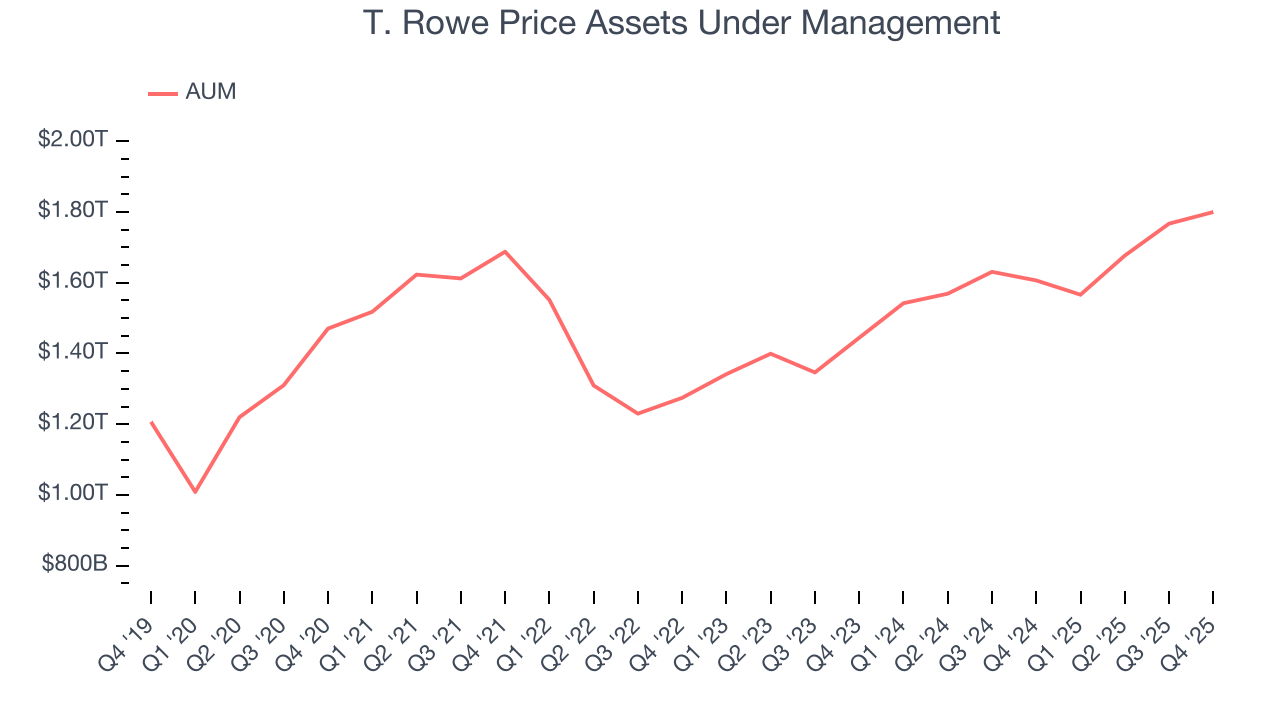
T. Rowe Price’s AUM punched in at $1.8 trillion this quarter, beating analysts’ expectations by 0.7%. This print was 12% higher than the same quarter last year.
7. Advisory, Servicing, and Other Fees
Financial institutions earn fee-based income through various services including M&A advisory work, capital raising activities, and comprehensive client relationship management.
Over the past five years, T. Rowe Price’s fees grew by a poor 3% per year and lagged its 6.3% annual growth in AUM. A two-year view reveals a more encouraging story as growth picked up to 7.4% annualized.
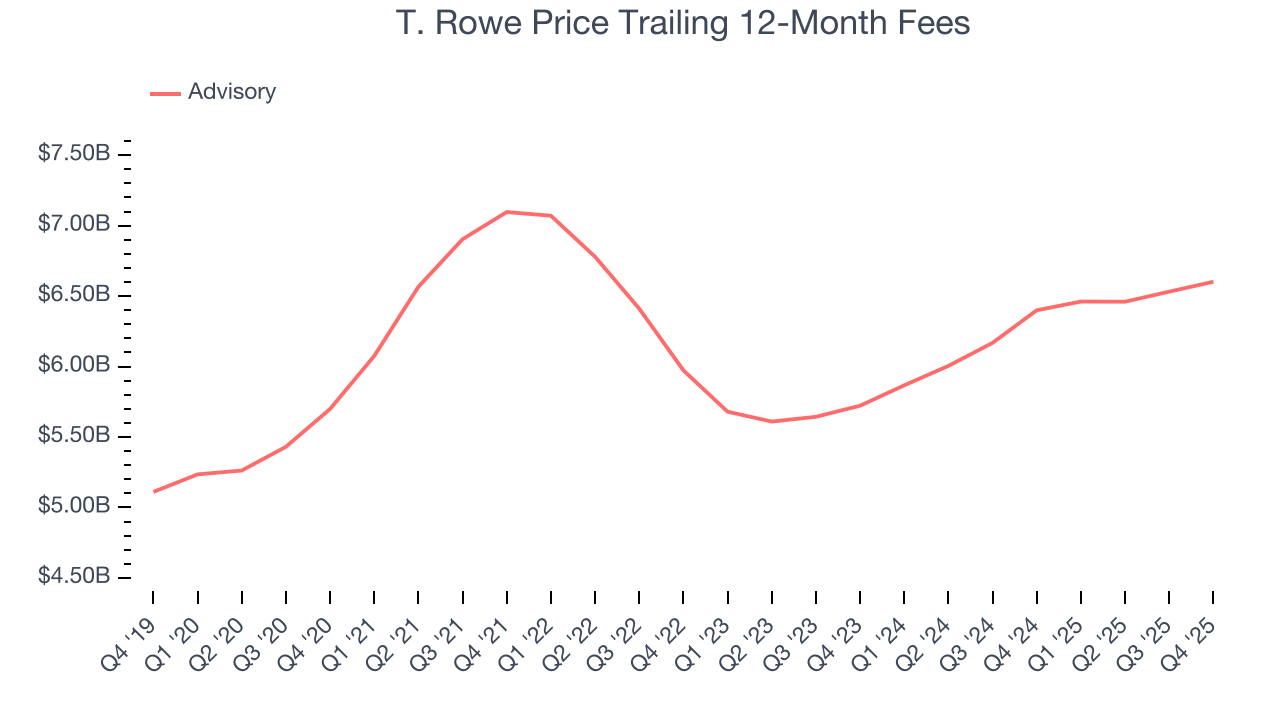
This quarter, T. Rowe Price’s fees were $1.74 billion, in line with Consensus estimates. Wall Street opinions aside, fees grew by 4.2% year on year.
8. Pre-Tax Profit Margin
Revenue growth is one major determinant of business quality, and the efficiency of operations is another. For Custody Bank companies, we look at pre-tax profit rather than the operating margin that defines sectors such as consumer, tech, and industrials.
Financials companies manage interest-bearing assets and liabilities, making the interest income and expenses included in pre-tax profit essential to their profit calculation. Taxes, being external factors beyond management control, are appropriately excluded from this alternative margin measure.
Over the last five years, T. Rowe Price’s pre-tax profit margin has risen by 13.2 percentage points, going from 52% to 39%. Expenses have stabilized more recently as the company’s pre-tax profit margin was flat on a two-year basis.
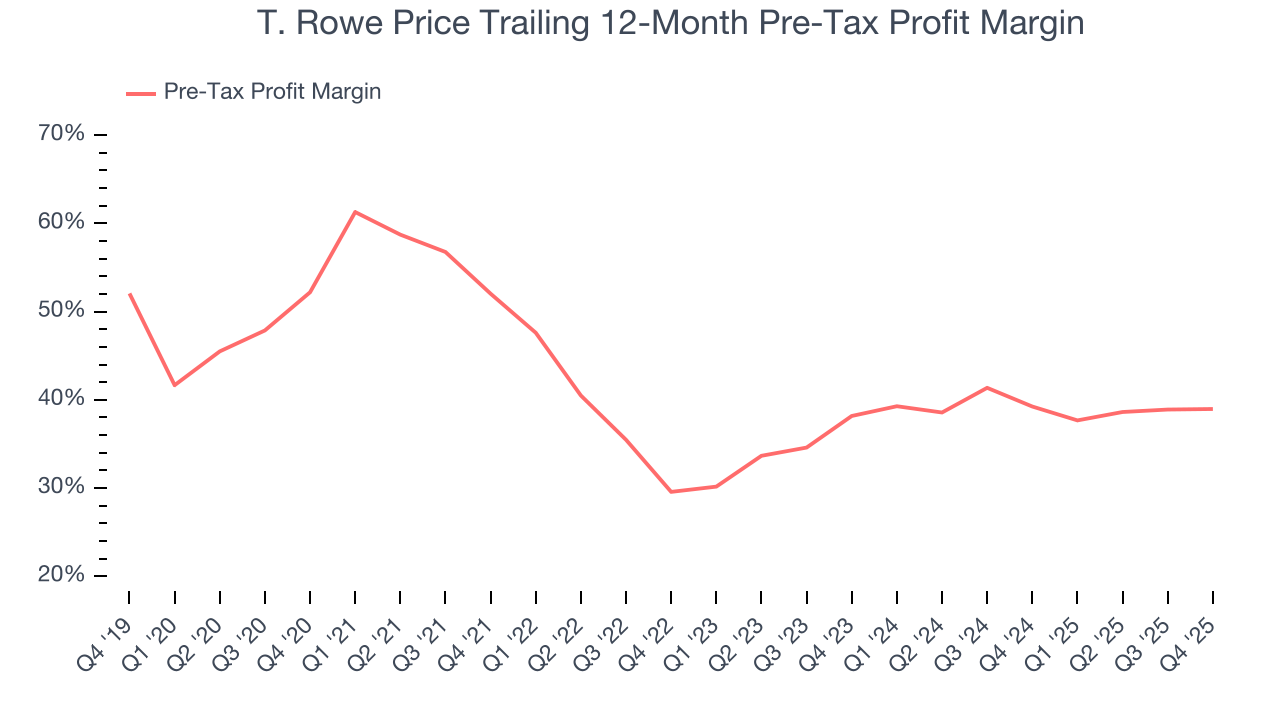
T. Rowe Price’s pre-tax profit margin came in at 31.7% this quarter. This result was in line with the same quarter last year.
9. Earnings Per Share
We track the long-term change in earnings per share (EPS) for the same reason as long-term revenue growth. Compared to revenue, however, EPS highlights whether a company’s growth is profitable.
T. Rowe Price’s flat EPS over the last five years was below its 3.5% annualized revenue growth. This tells us the company became less profitable on a per-share basis as it expanded due to factors such as interest expenses and taxes.
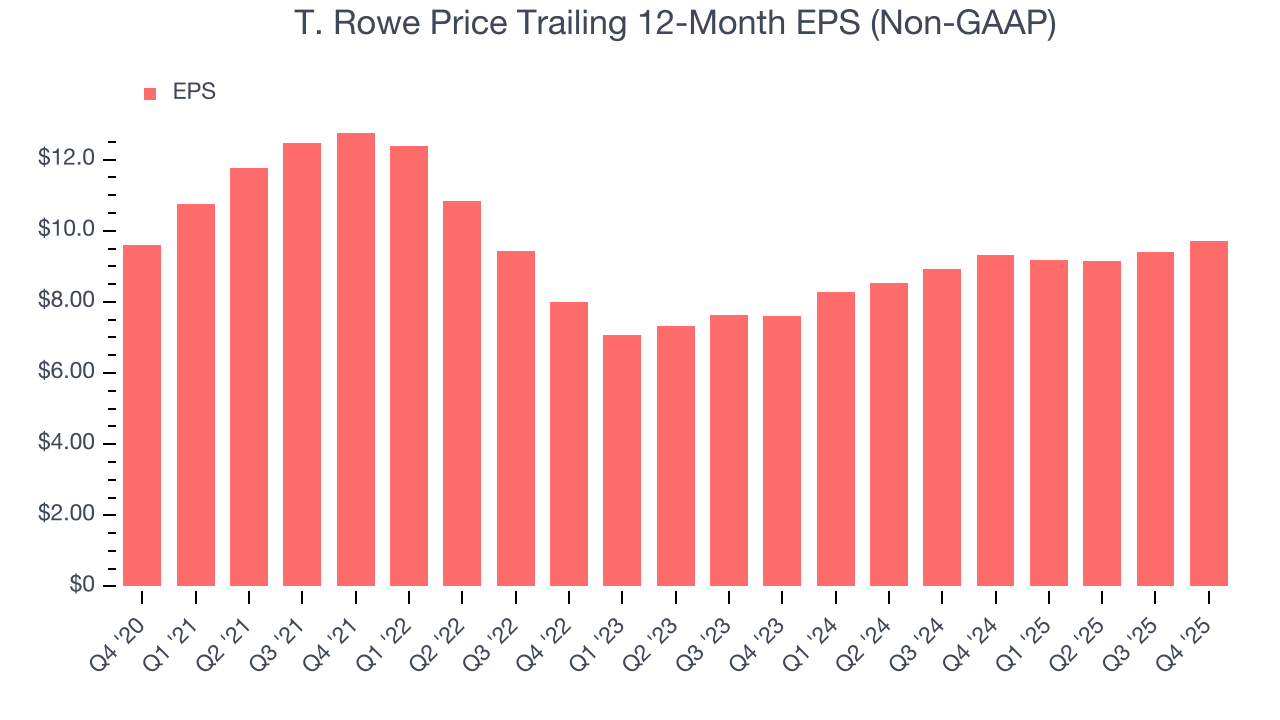
Like with revenue, we analyze EPS over a shorter period to see if we are missing a change in the business.
For T. Rowe Price, its two-year annual EPS growth of 13.1% was higher than its five-year trend. This acceleration made it one of the faster-growing financials companies in recent history.
In Q4, T. Rowe Price reported adjusted EPS of $2.44, up from $2.12 in the same quarter last year. This print was close to analysts’ estimates. Over the next 12 months, Wall Street expects T. Rowe Price’s full-year EPS of $9.72 to grow 6%.
10. Return on Equity
Return on equity (ROE) reveals the profit generated per dollar of shareholder equity, which represents a key source of bank funding. Banks maintaining elevated ROE levels tend to accelerate wealth creation for shareholders via earnings retention, buybacks, and distributions.
Over the last five years, T. Rowe Price has averaged an ROE of 21.3%, excellent for a company operating in a sector where the average shakes out around 10% and those putting up 25%+ are greatly admired. This is a bright spot for T. Rowe Price.
11. Balance Sheet Assessment
The debt-to-equity ratio is a widely used measure to assess a company's balance sheet health. A higher ratio means that a business aggressively financed its growth with debt. This can result in higher earnings (if the borrowed funds are invested profitably) but also increases risk.
If debt levels are too high, there could be difficulties in meeting obligations, especially during economic downturns or periods of rising interest rates if the debt has variable-rate payments.
T. Rowe Price has no debt, so leverage is not an issue here.
12. Key Takeaways from T. Rowe Price’s Q4 Results
It was good to see T. Rowe Price narrowly top analysts’ AUM expectations this quarter. On the other hand, its advisory and servicing fees was in line and its revenue fell slightly short of Wall Street’s estimates. Overall, this was a softer quarter. The stock traded down 1.4% to $101.27 immediately following the results.
13. Is Now The Time To Buy T. Rowe Price?
Updated: March 24, 2026 at 12:40 AM EDT
We think that the latest earnings result is only one piece of the bigger puzzle. If you’re deciding whether to own T. Rowe Price, you should also grasp the company’s longer-term business quality and valuation.
T. Rowe Price isn’t a terrible business, but it doesn’t pass our quality test. To begin with, its revenue growth was weak over the last five years, and analysts don’t see anything changing over the next 12 months. While its market-beating ROE suggests it has been a well-managed company historically, the downside is its declining pre-tax profit margin shows the business has become less efficient. On top of that, its weak EPS growth over the last five years shows it’s failed to produce meaningful profits for shareholders.
T. Rowe Price’s P/E ratio based on the next 12 months is 8.6x. While this valuation is optically cheap, the potential downside is big given its shaky fundamentals. We're fairly confident there are better investments elsewhere.
Wall Street analysts have a consensus one-year price target of $101.25 on the company (compared to the current share price of $88.15).