
Verisk (VRSK)
Verisk doesn’t impress us. Its sluggish sales growth shows demand is soft, a worrisome sign for investors in high-quality stocks.― StockStory Analyst Team
1. News


2. Summary
Why Verisk Is Not Exciting
Processing over 2.8 billion insurance transaction records annually through one of the world's largest private databases, Verisk Analytics (NASDAQ:VRSK) provides data, analytics, and technology solutions that help insurance companies assess risk, detect fraud, and make better business decisions.
- Annual revenue growth of 2% over the last five years was below our standards for the business services sector
- Earnings per share lagged its peers over the last five years as they only grew by 7.2% annually
- One positive is that its healthy adjusted operating margin shows it’s a well-run company with efficient processes


Verisk’s quality doesn’t meet our expectations. There are more rewarding stocks elsewhere.
Why There Are Better Opportunities Than Verisk


Verisk is trading at $179.62 per share, or 24.6x forward P/E. This multiple is higher than that of business services peers; it’s also rich for the top-line growth of the company. Not a great combination.
There are stocks out there similarly priced with better business quality. We prefer owning these.
3. Verisk (VRSK) Research Report: Q4 CY2025 Update
Insurance data analytics provider Verisk Analytics (NASDAQ:VRSK) reported Q4 CY2025 results topping the market’s revenue expectations, with sales up 5.9% year on year to $778.8 million. On the other hand, the company’s full-year revenue guidance of $3.22 billion at the midpoint came in 1.7% below analysts’ estimates. Its non-GAAP profit of $1.82 per share was 12.9% above analysts’ consensus estimates.
Verisk (VRSK) Q4 CY2025 Highlights:
- Revenue: $778.8 million vs analyst estimates of $773.5 million (5.9% year-on-year growth, 0.7% beat)
- Adjusted EPS: $1.82 vs analyst estimates of $1.61 (12.9% beat)
- Adjusted EBITDA: $437 million vs analyst estimates of $421.4 million (56.1% margin, 3.7% beat)
- Adjusted EPS guidance for the upcoming financial year 2026 is $7.60 at the midpoint, missing analyst estimates by 1.5%
- EBITDA guidance for the upcoming financial year 2026 is $1.81 billion at the midpoint, below analyst estimates of $1.84 billion
- Operating Margin: 40.3%, down from 43% in the same quarter last year
- Free Cash Flow Margin: 35.5%, up from 27.2% in the same quarter last year
- Constant Currency Revenue rose 5.2% year on year (8.6% in the same quarter last year)
- Market Capitalization: $24.71 billion
Company Overview
Processing over 2.8 billion insurance transaction records annually through one of the world's largest private databases, Verisk Analytics (NASDAQ:VRSK) provides data, analytics, and technology solutions that help insurance companies assess risk, detect fraud, and make better business decisions.
Verisk serves as the backbone of risk assessment for the insurance industry, offering solutions across the entire insurance lifecycle from underwriting to claims processing. The company maintains vast proprietary databases containing information on properties, vehicles, communities, and catastrophic events, which it analyzes using advanced technologies including artificial intelligence and machine learning to generate actionable insights.
For property and casualty insurers, Verisk provides standardized policy language, rating information, and loss cost data that help companies price coverage appropriately. Its field representatives physically visit hundreds of thousands of commercial properties annually to collect and verify building attributes. The company also evaluates community firefighting capabilities and building code enforcement that insurers use to determine premiums.
When a policyholder files a claim, Verisk's solutions help insurers estimate repair costs, detect potential fraud, and process claims efficiently. For example, an auto insurer might use Verisk's database to identify if a claimant has filed similar claims with other insurers, potentially flagging suspicious patterns. Similarly, a property insurer might use Verisk's building cost data to accurately estimate repair costs after storm damage.
Beyond traditional insurance, Verisk has expanded into catastrophe modeling, helping insurers and governments quantify and manage risks from hurricanes, earthquakes, wildfires, and other extreme events. The company has also moved into life insurance, specialty business solutions, and marketing analytics.
Verisk generates revenue primarily through annual subscriptions and long-term agreements, with approximately 80% of its revenue coming from these recurring sources. The company's client base includes all of the top 100 property and casualty insurance providers in the United States, as well as major insurers and reinsurers globally.
4. Data & Business Process Services
A combination of increasing reliance on data and analytics across various industries and the desire for cost efficiency through outsourcing could mean that companies in this space gain. As functions such as payroll, HR, and credit risk assessment rely on more digitization, key players in the data & business process services industry could be increased demand. On the other hand, the sector faces headwinds from growing regulatory scrutiny on data privacy and security, with laws like GDPR and evolving U.S. regulations potentially limiting data collection and monetization strategies. Additionally, rising cyber threats pose risks to firms handling sensitive personal and financial information, creating outsized headline risk when things go wrong in this area.
Verisk's competitors include S&P Global (NYSE:SPGI), Moody's Analytics (NYSE:MCO), CoreLogic, LexisNexis Risk Solutions (part of RELX Group, NYSE:RELX), and Guidewire Software (NYSE:GWRE), all of which provide various data analytics and risk assessment solutions to the insurance and financial services industries.
5. Revenue Growth
A company’s long-term sales performance can indicate its overall quality. Any business can put up a good quarter or two, but many enduring ones grow for years.
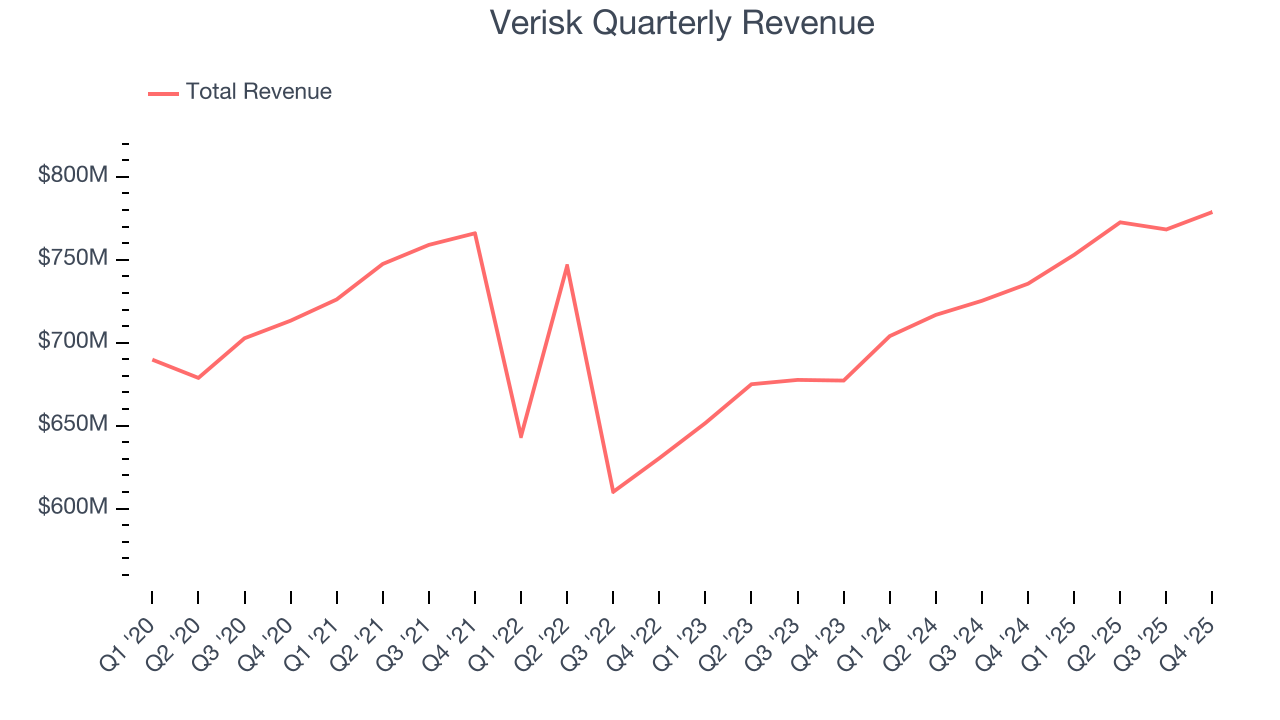
With $3.07 billion in revenue over the past 12 months, Verisk is a mid-sized business services company, which sometimes brings disadvantages compared to larger competitors benefiting from better economies of scale.
As you can see below, Verisk’s 2% annualized revenue growth over the last five years was sluggish. This shows it failed to generate demand in any major way and is a rough starting point for our analysis.
Long-term growth is the most important, but within business services, a half-decade historical view may miss new innovations or demand cycles. Verisk’s annualized revenue growth of 7% over the last two years is above its five-year trend, suggesting its demand recently accelerated. 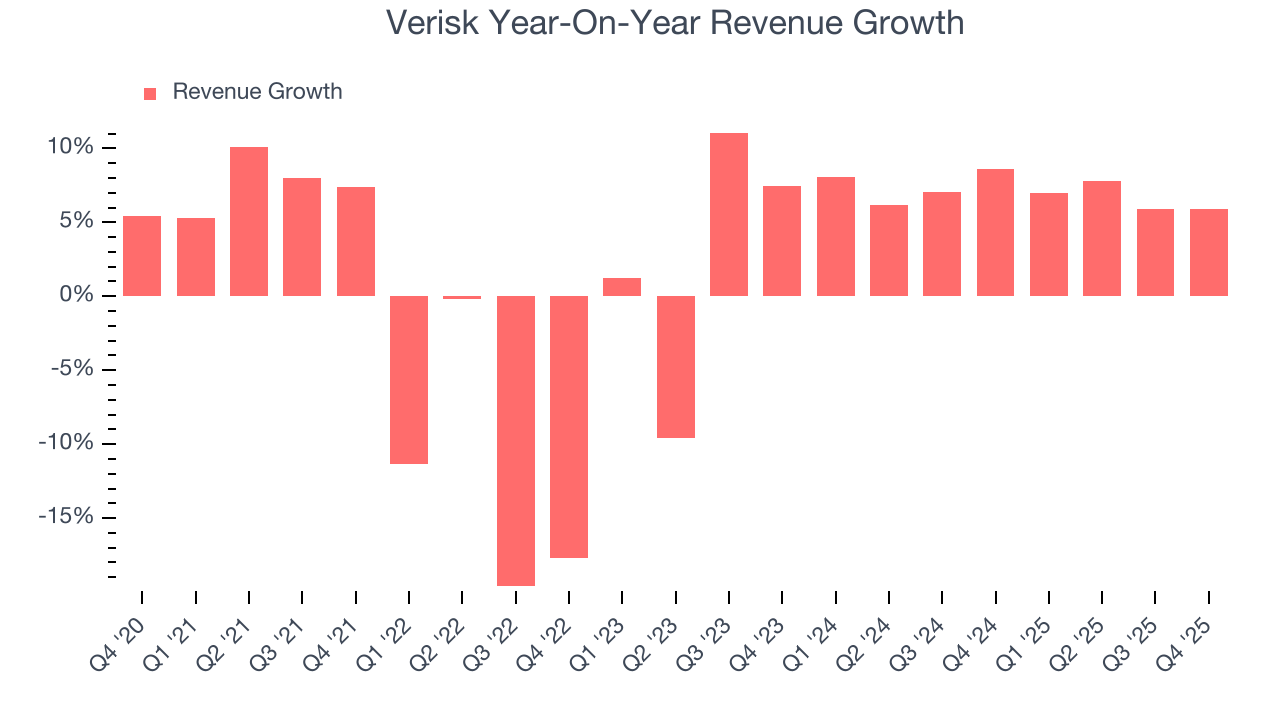
We can better understand the company’s sales dynamics by analyzing its constant currency revenue, which excludes currency movements that are outside their control and not indicative of demand. Over the last two years, its constant currency sales averaged 6.9% year-on-year growth. Because this number aligns with its normal revenue growth, we can see that Verisk has properly hedged its foreign currency exposure. 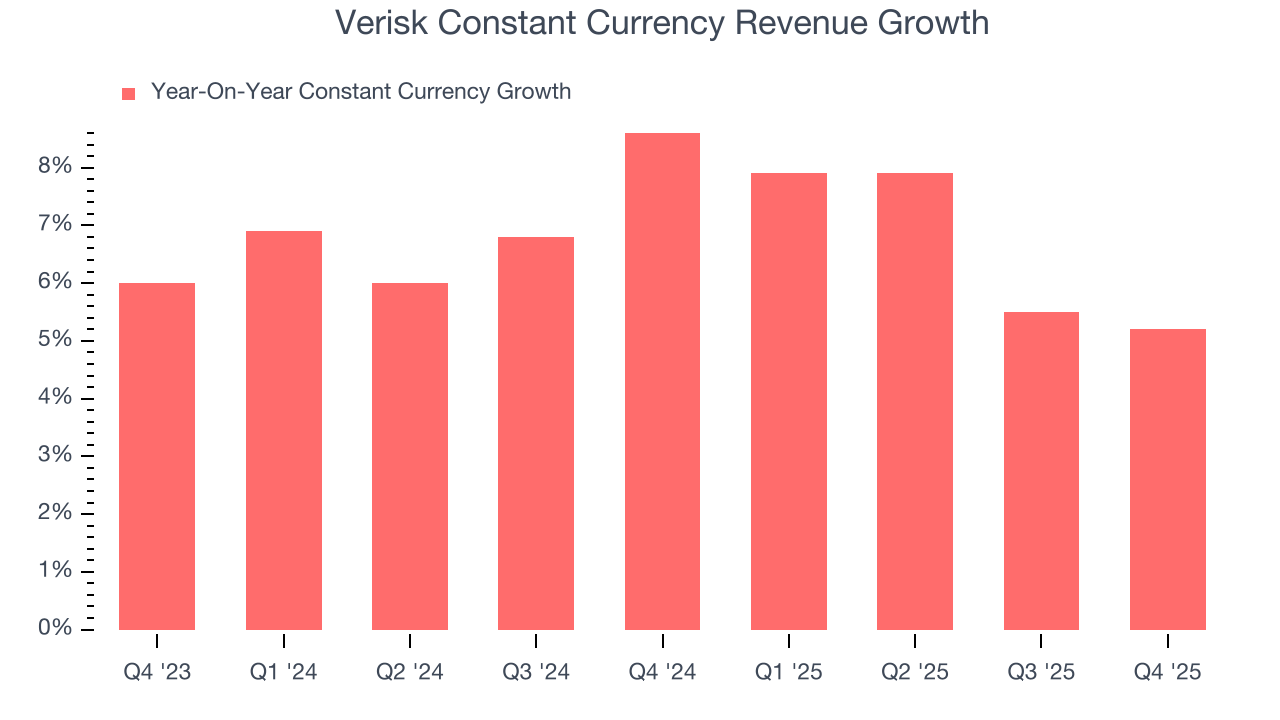
This quarter, Verisk reported year-on-year revenue growth of 5.9%, and its $778.8 million of revenue exceeded Wall Street’s estimates by 0.7%.
Looking ahead, sell-side analysts expect revenue to grow 6.1% over the next 12 months, similar to its two-year rate. This projection is above the sector average and implies its newer products and services will help maintain its recent top-line performance.
6. Operating Margin
Operating margin is an important measure of profitability as it shows the portion of revenue left after accounting for all core expenses – everything from the cost of goods sold to advertising and wages. It’s also useful for comparing profitability across companies with different levels of debt and tax rates because it excludes interest and taxes.
Verisk has been a well-oiled machine over the last five years. It demonstrated elite profitability for a business services business, boasting an average operating margin of 43.5%.
Analyzing the trend in its profitability, Verisk’s operating margin rose by 10.4 percentage points over the last five years, as its sales growth gave it operating leverage.
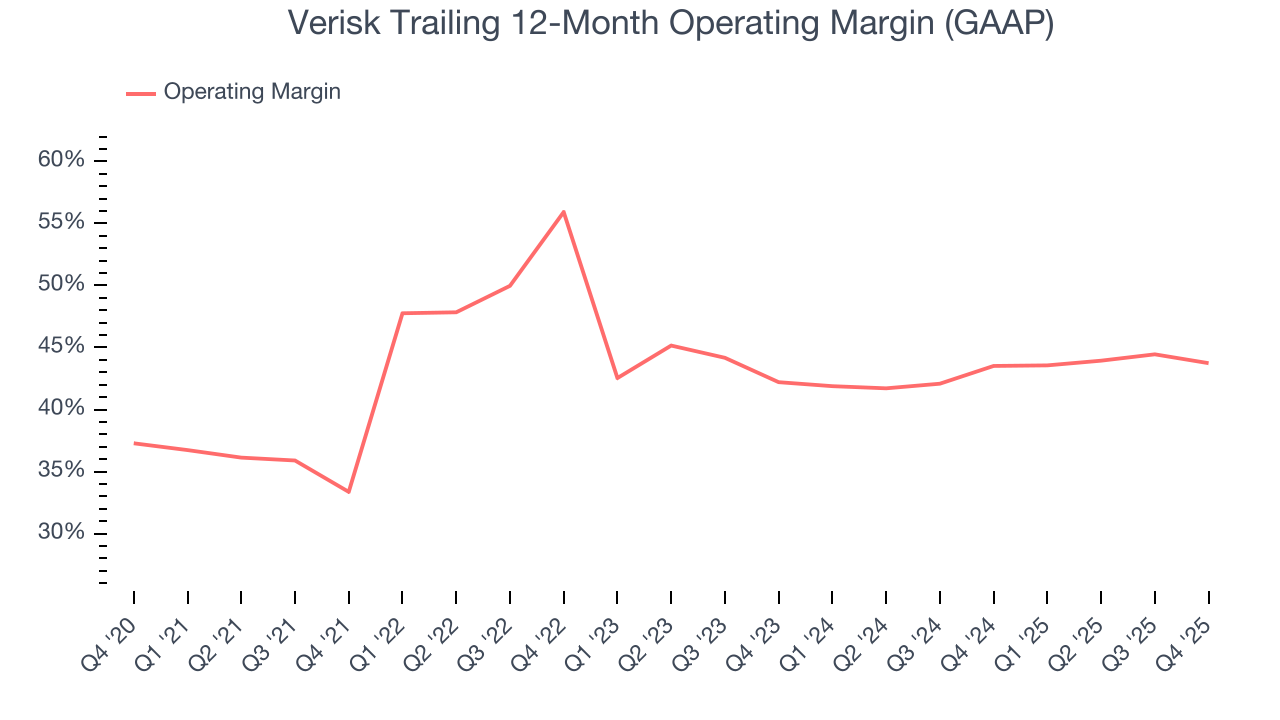
This quarter, Verisk generated an operating margin profit margin of 40.3%, down 2.7 percentage points year on year. This contraction shows it was less efficient because its expenses grew faster than its revenue.
7. Earnings Per Share
We track the long-term change in earnings per share (EPS) for the same reason as long-term revenue growth. Compared to revenue, however, EPS highlights whether a company’s growth is profitable.
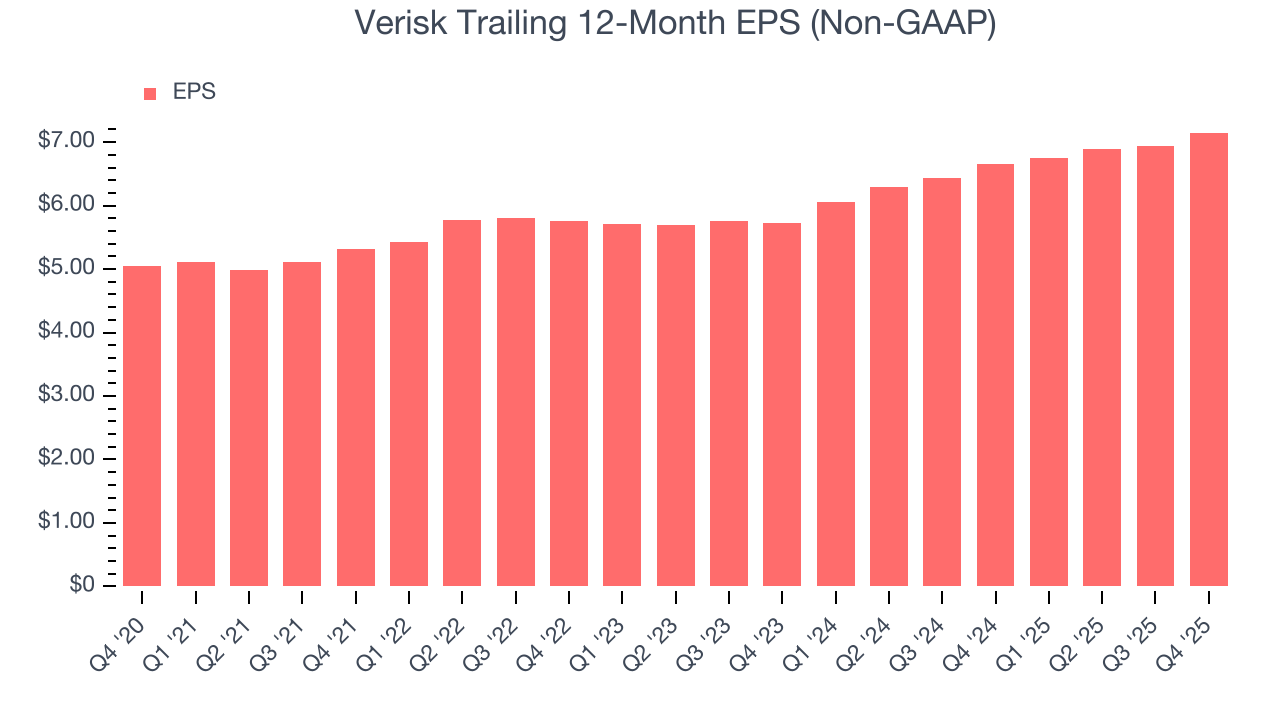
Verisk’s EPS grew at an unimpressive 7.2% compounded annual growth rate over the last five years. On the bright side, this performance was better than its 2% annualized revenue growth and tells us the company became more profitable on a per-share basis as it expanded.
We can take a deeper look into Verisk’s earnings to better understand the drivers of its performance. As we mentioned earlier, Verisk’s operating margin declined this quarter but expanded by 10.4 percentage points over the last five years. Its share count also shrank by 15.5%, and these factors together are positive signs for shareholders because improving profitability and share buybacks turbocharge EPS growth relative to revenue growth. 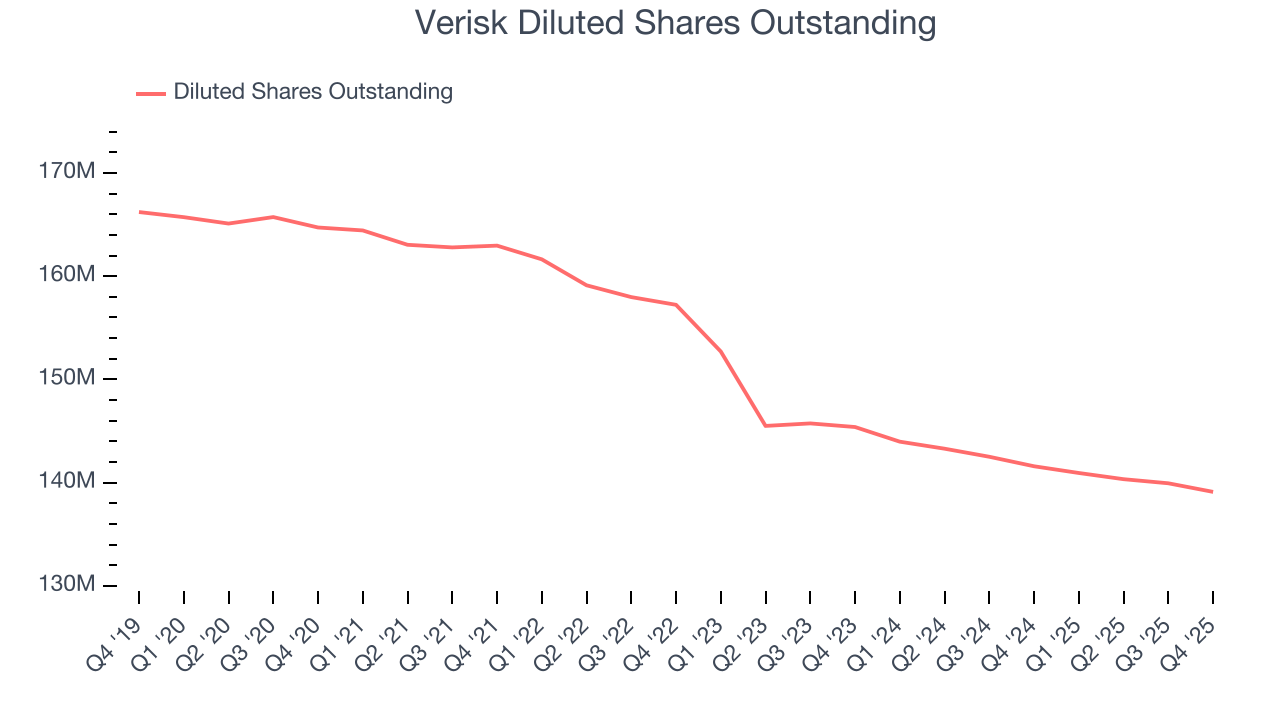
Like with revenue, we analyze EPS over a more recent period because it can provide insight into an emerging theme or development for the business.
For Verisk, its two-year annual EPS growth of 11.8% was higher than its five-year trend. Accelerating earnings growth is almost always an encouraging data point.
In Q4, Verisk reported adjusted EPS of $1.82, up from $1.61 in the same quarter last year. This print easily cleared analysts’ estimates, and shareholders should be content with the results. Over the next 12 months, Wall Street expects Verisk’s full-year EPS of $7.15 to grow 7.6%.
8. Cash Is King
If you’ve followed StockStory for a while, you know we emphasize free cash flow. Why, you ask? We believe that in the end, cash is king, and you can’t use accounting profits to pay the bills.
Verisk has shown terrific cash profitability, enabling it to reinvest, return capital to investors, and stay ahead of the competition while maintaining an ample cushion. The company’s free cash flow margin was among the best in the business services sector, averaging an eye-popping 32.3% over the last five years.
Taking a step back, we can see that Verisk’s margin expanded by 9.2 percentage points during that time. This is encouraging because it gives the company more optionality.
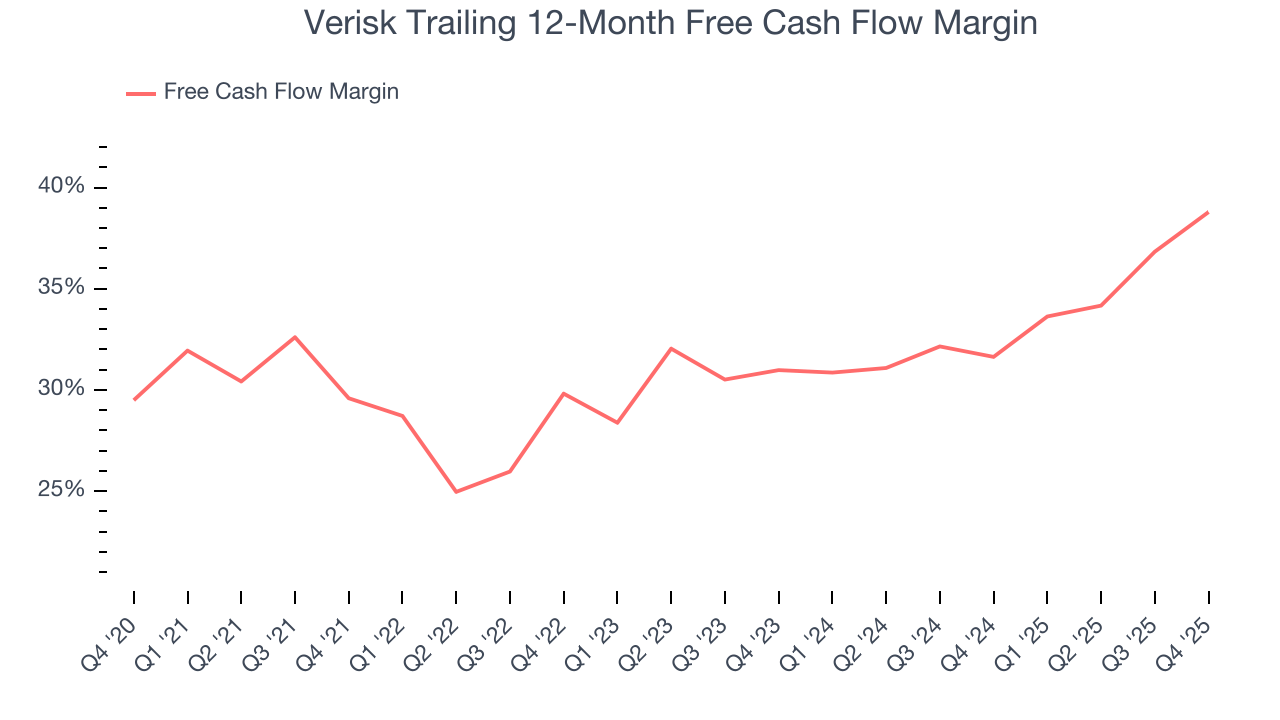
Verisk’s free cash flow clocked in at $276.1 million in Q4, equivalent to a 35.5% margin. This result was good as its margin was 8.3 percentage points higher than in the same quarter last year, building on its favorable historical trend.
9. Return on Invested Capital (ROIC)
EPS and free cash flow tell us whether a company was profitable while growing its revenue. But was it capital-efficient? A company’s ROIC explains this by showing how much operating profit it makes compared to the money it has raised (debt and equity).
Although Verisk hasn’t been the highest-quality company lately because of its poor top-line performance, it found a few growth initiatives in the past that worked out wonderfully. Its five-year average ROIC was 29%, splendid for a business services business.
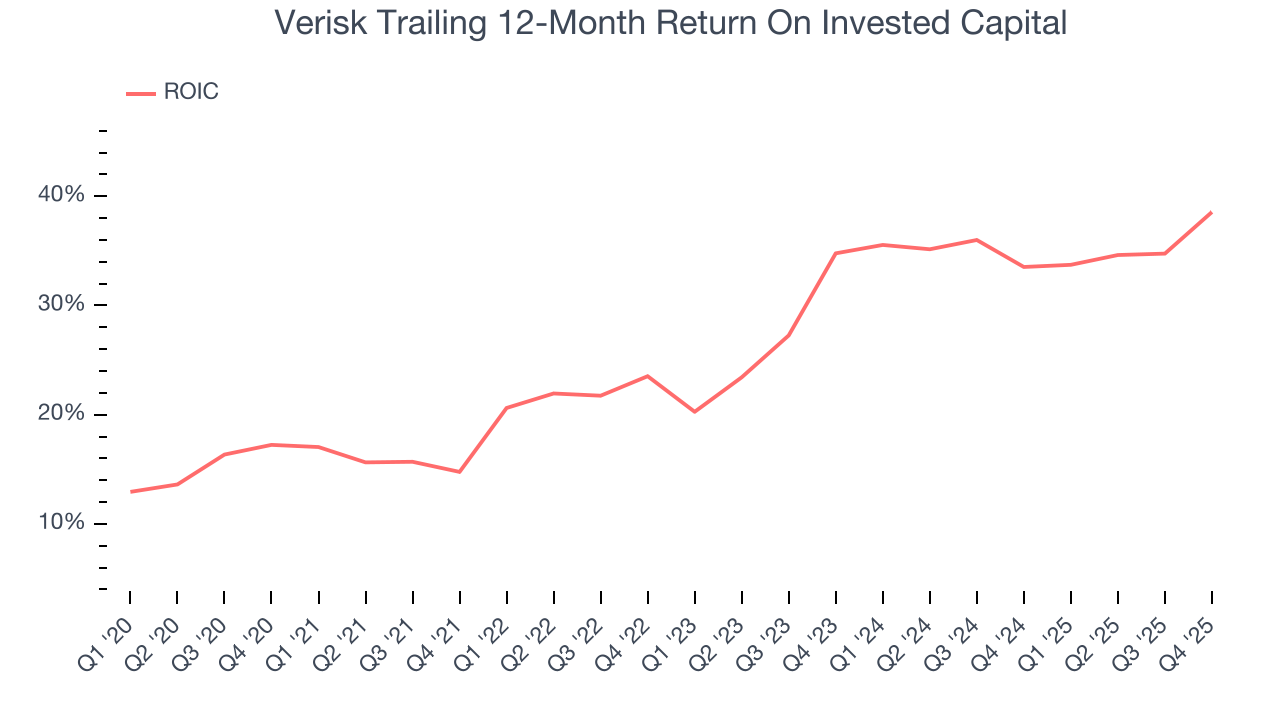
We like to invest in businesses with high returns, but the trend in a company’s ROIC is what often surprises the market and moves the stock price. Fortunately, Verisk’s ROIC has increased significantly over the last few years. This is a good sign, and if its returns keep rising, there’s a chance it could evolve into an investable business.
10. Balance Sheet Assessment
Verisk reported $2.18 billion of cash and $4.9 billion of debt on its balance sheet in the most recent quarter. As investors in high-quality companies, we primarily focus on two things: 1) that a company’s debt level isn’t too high and 2) that its interest payments are not excessively burdening the business.
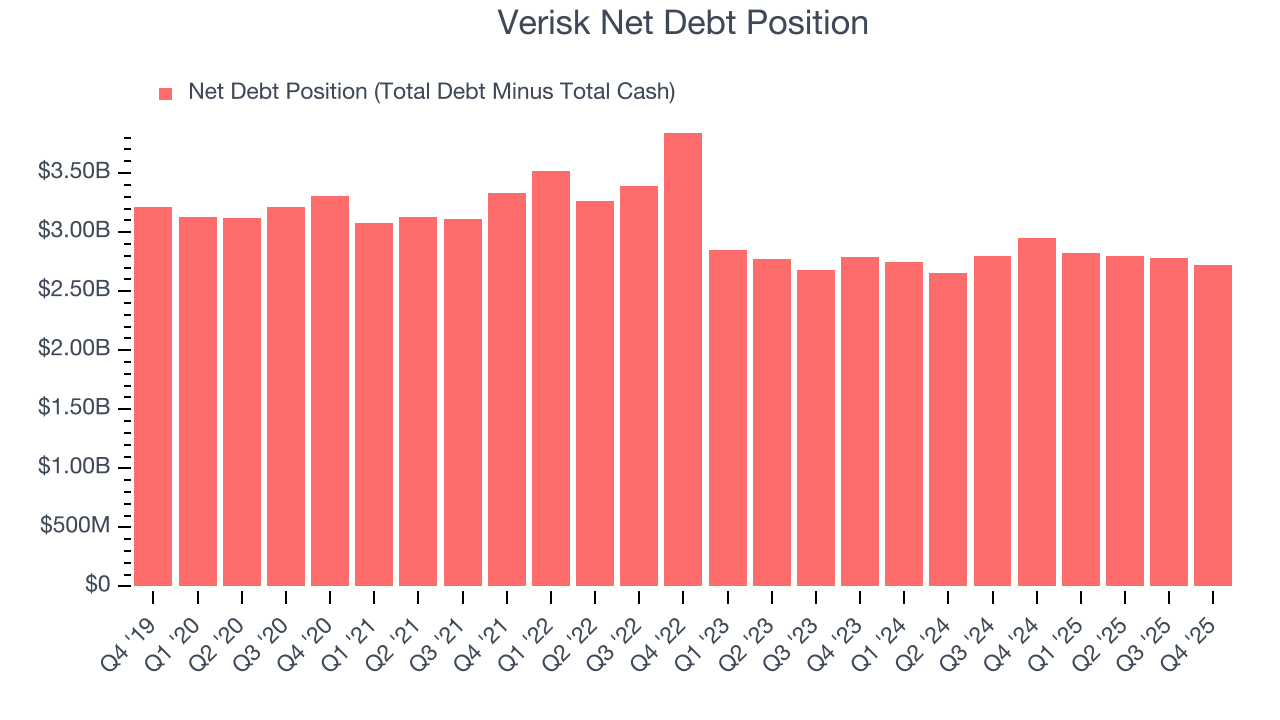
With $1.73 billion of EBITDA over the last 12 months, we view Verisk’s 1.6× net-debt-to-EBITDA ratio as safe. We also see its $159.2 million of annual interest expenses as appropriate. The company’s profits give it plenty of breathing room, allowing it to continue investing in growth initiatives.
11. Key Takeaways from Verisk’s Q4 Results
It was good to see Verisk beat analysts’ EPS expectations this quarter. We were also happy its revenue narrowly outperformed Wall Street’s estimates. On the other hand, its full-year revenue guidance missed and its full-year EPS guidance fell short of Wall Street’s estimates. Overall, this quarter could have been better. The stock traded up 9.1% to $193.37 immediately after reporting.
12. Is Now The Time To Buy Verisk?
Updated: February 18, 2026 at 7:40 AM EST
Are you wondering whether to buy Verisk or pass? We urge investors to not only consider the latest earnings results but also longer-term business quality and valuation as well.
When it comes to Verisk’s business quality, there are some positives, but it ultimately falls short. Although its revenue growth was weak over the last five years, its growth over the next 12 months is expected to be higher. Plus, Verisk’s powerful free cash flow generation enables it to stay ahead of the competition through consistent reinvestment of profits.
Verisk’s P/E ratio based on the next 12 months is 23.1x. Beauty is in the eye of the beholder, but our analysis shows the upside isn’t great compared to the potential downside. We're fairly confident there are better investments elsewhere.
Wall Street analysts have a consensus one-year price target of $238.41 on the company (compared to the current share price of $193.37).