
Warner Bros. Discovery (WBD)
Warner Bros. Discovery is in for a bumpy ride. Its poor sales growth shows demand is soft and its negative returns on capital suggest it destroyed value.― StockStory Analyst Team
1. News


2. Summary
Why We Think Warner Bros. Discovery Will Underperform
Formed from the merger of WarnerMedia and Discovery, Warner Bros. Discovery (NASDAQ:WBD) is a multinational media and entertainment company, offering television networks, streaming services, and film and television production.
- Products and services have few die-hard fans as sales have declined by 5% annually over the last two years
- Incremental sales over the last five years were much less profitable as its earnings per share fell by 38.2% annually while its revenue grew
- Poor expense management has led to operating margin losses


Warner Bros. Discovery’s quality isn’t up to par. We believe there are better opportunities elsewhere.
Why There Are Better Opportunities Than Warner Bros. Discovery


At $27.50 per share, Warner Bros. Discovery trades at 11.2x forward EV-to-EBITDA. This multiple is higher than most consumer discretionary companies, and we think it’s quite expensive for the weaker revenue growth you get.
There are stocks out there featuring similar valuation multiples with better fundamentals. We prefer to invest in those.
3. Warner Bros. Discovery (WBD) Research Report: Q4 CY2025 Update
Global entertainment and media company Warner Bros. Discovery (NASDAQ:WBD) reported revenue ahead of Wall Street’s expectations in Q4 CY2025, but sales fell by 5.7% year on year to $9.46 billion. Its GAAP loss of $0.10 per share was significantly below analysts’ consensus estimates.
Warner Bros. Discovery (WBD) Q4 CY2025 Highlights:
- Revenue: $9.46 billion vs analyst estimates of $9.38 billion (5.7% year-on-year decline, 0.8% beat)
- EPS (GAAP): -$0.10 vs analyst estimates of $0 (significant miss)
- Adjusted EBITDA: $2.22 billion vs analyst estimates of $2.15 billion (23.4% margin, 3% beat)
- Operating Margin: 3.7%, up from 1.6% in the same quarter last year
- Free Cash Flow Margin: 14.6%, down from 24.2% in the same quarter last year
- Market Capitalization: $71.67 billion
Company Overview
Formed from the merger of WarnerMedia and Discovery, Warner Bros. Discovery (NASDAQ:WBD) is a multinational media and entertainment company, offering television networks, streaming services, and film and television production.
The creation of Warner Bros. Discovery brought together WarnerMedia's extensive entertainment, sports, and news assets with Discovery's expertise in non-fiction and international entertainment. This merger was aimed to build a comprehensive media portfolio, ready to meet the changing consumption patterns and demand for diverse content across various platforms.
The company offers a wide range of entertainment options, including numerous TV networks, a collection of direct-to-consumer streaming services, and widespread film and TV production capabilities. Warner Bros. Discovery caters to the need for quality content across different genres and formats, ensuring a position in the global entertainment sector.
Warner Bros. Discovery's revenue is generated through content distribution, advertising, subscription services, and licensing. Its business model focuses on leveraging its extensive content library and global reach to deliver content to audiences worldwide.
4. Consumer Discretionary - Media
The Consumer Discretionary sector, by definition, is made up of companies selling non-essential goods and services. When economic conditions deteriorate or tastes shift, consumers can easily cut back or eliminate these purchases. For long-term investors with five-year holding periods, this creates a structural challenge: the sector is inherently hit-driven, with low switching costs and fickle customers. As a result, only a handful of companies can reliably grow demand and compound earnings over long periods, which is why our bar is high and High Quality ratings are rare.
Media companies create, aggregate, and distribute content—including news, entertainment, and advertising—across television, print, digital, and out-of-home channels. Tailwinds include growing digital advertising budgets, content licensing opportunities, and global audience expansion through streaming and social platforms. Headwinds are substantial: traditional advertising revenue from print and linear TV continues its structural decline as audiences migrate to digital alternatives. Content creation costs are escalating amid intense competition for talent and intellectual property. Media fragmentation makes it difficult to build sustainable audience scale, while AI-generated content threatens to commoditize production and disrupt established business models.
Competitors in the local media and digital marketing industry include iHeartMedia (NASDAQ:IHRT), Cumulus Media (NASDAQ:CMLS), and Beasley Broadcast (NASDAQ:BBGI).
5. Revenue Growth
A company’s long-term sales performance can indicate its overall quality. Any business can experience short-term success, but top-performing ones enjoy sustained growth for years. Over the last five years, Warner Bros. Discovery grew its sales at a 28.4% annual rate. Though this growth is acceptable on an absolute basis, we need to see more than just topline growth for the consumer discretionary sector, which can display significant earnings volatility. This means our bar for the sector is particularly high, reflecting the non-essential and hit-driven nature of the products and services offered. Additionally, five-year CAGR starts around Covid, when revenue was depressed then rebounded.
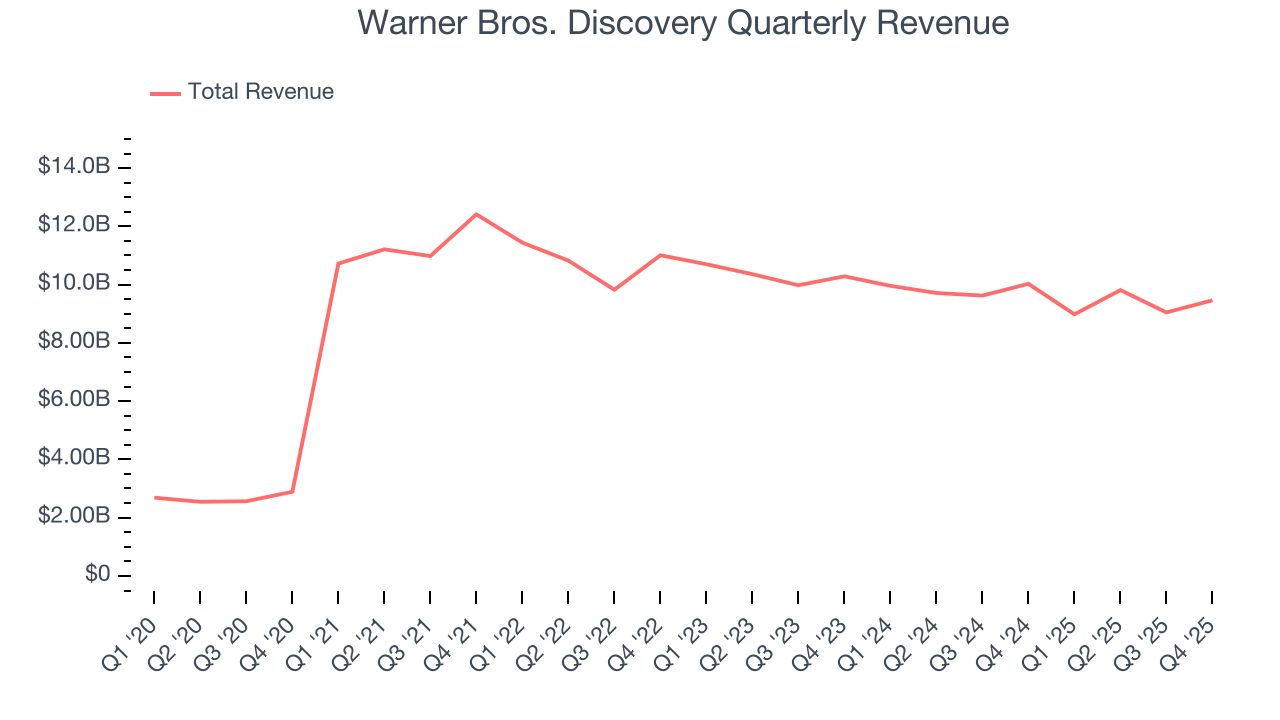
We at StockStory place the most emphasis on long-term growth, but within consumer discretionary, a stretched historical view may miss a company riding a successful new product or trend. Warner Bros. Discovery’s performance shows it grew in the past but relinquished its gains over the last two years, as its revenue fell by 5% annually. 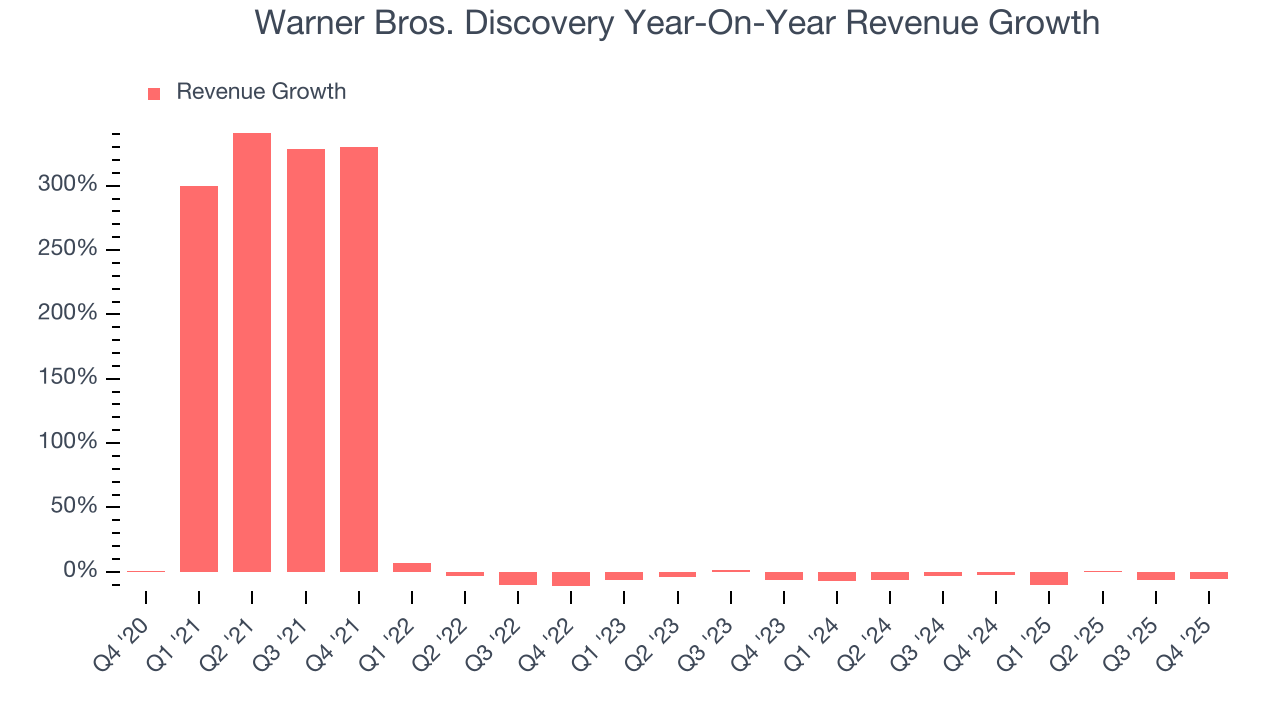
Warner Bros. Discovery also breaks out the revenue for its three most important segments: Distribution, Advertising, and Content, which are 50.6%, 18%, and 28.1% of revenue. Over the last two years, Warner Bros. Discovery’s revenues in all three segments declined. Its Distribution revenue (licensing fees) averaged year-on-year decreases of 1.8% while its Advertising (marketing services) and Content (films, streaming, games) revenues averaged drops of 10.4% and 4.6%. 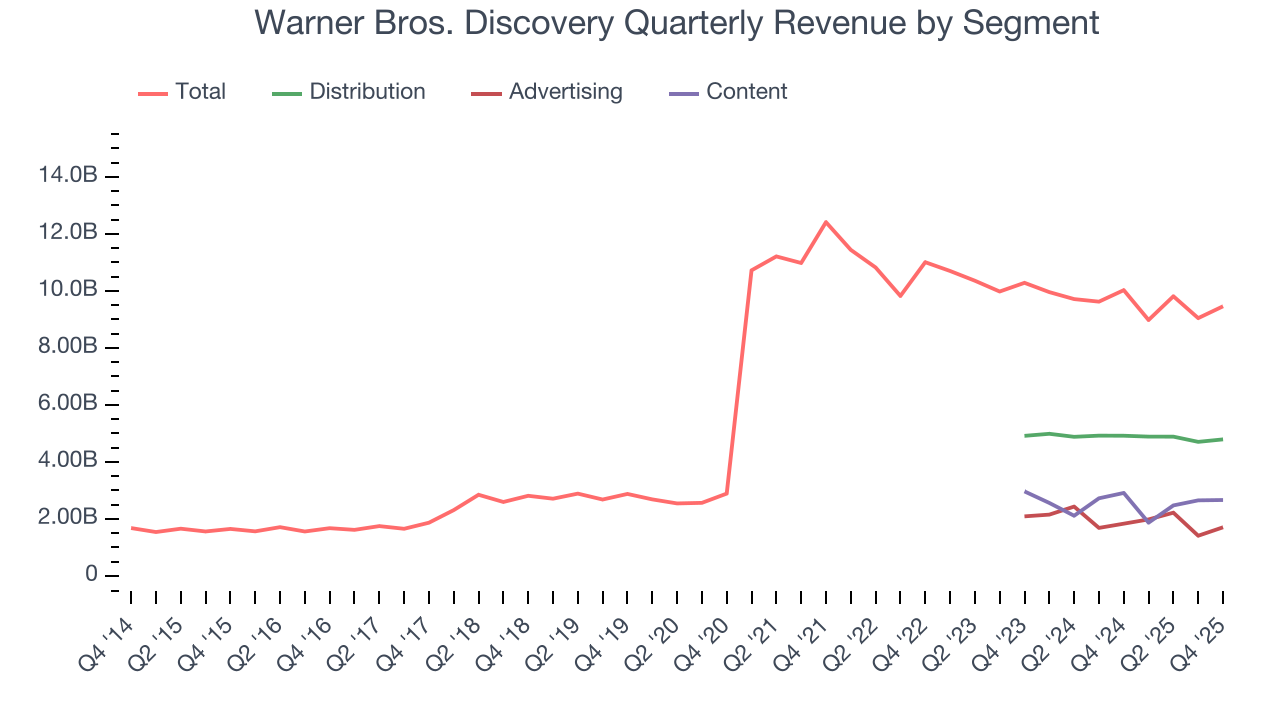
This quarter, Warner Bros. Discovery’s revenue fell by 5.7% year on year to $9.46 billion but beat Wall Street’s estimates by 0.8%.
Looking ahead, sell-side analysts expect revenue to remain flat over the next 12 months. Although this projection suggests its newer products and services will fuel better top-line performance, it is still below average for the sector.
6. Operating Margin
Warner Bros. Discovery’s operating margin has been trending up over the last 12 months, but it still averaged negative 12.1% over the last two years. This is due to its large expense base and inefficient cost structure.
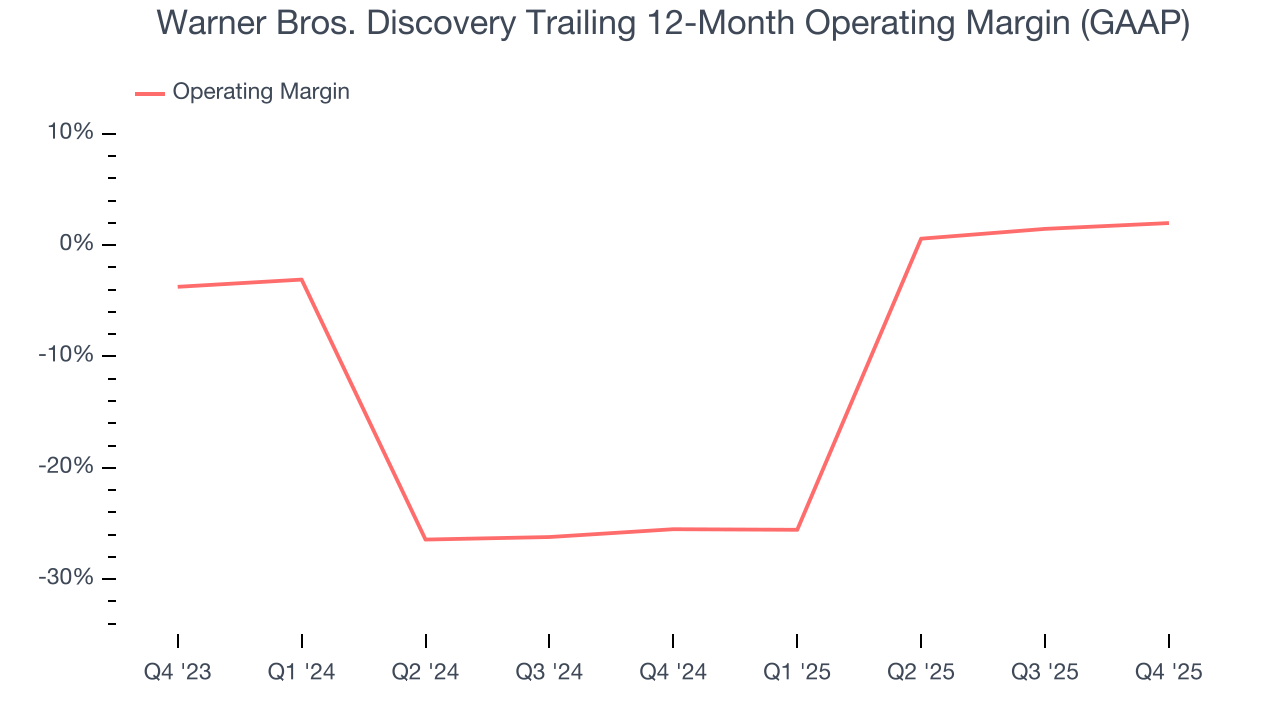
This quarter, Warner Bros. Discovery generated an operating margin profit margin of 3.7%, up 2.1 percentage points year on year. This increase was a welcome development, especially since its revenue fell, showing it was more efficient because it scaled down its expenses.
7. Earnings Per Share
We track the long-term change in earnings per share (EPS) for the same reason as long-term revenue growth. Compared to revenue, however, EPS highlights whether a company’s growth is profitable.
Sadly for Warner Bros. Discovery, its EPS declined by 30.7% annually over the last five years while its revenue grew by 28.4%. This tells us the company became less profitable on a per-share basis as it expanded.
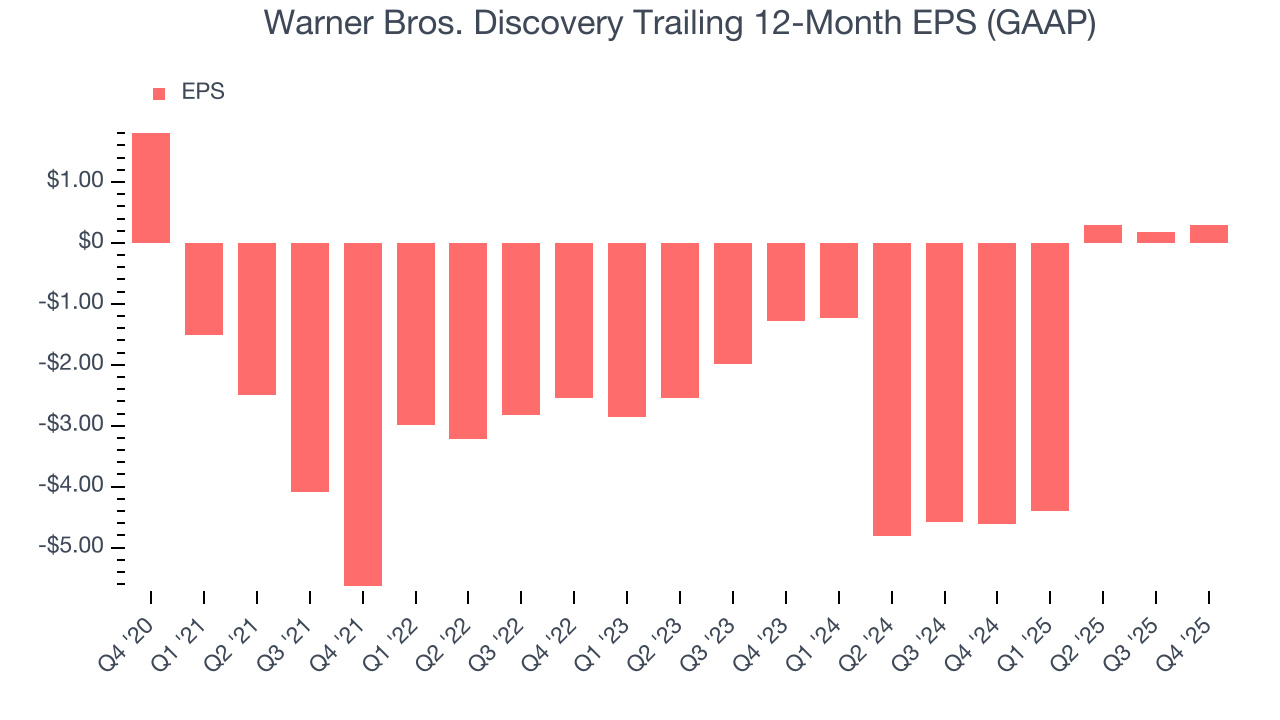
In Q4, Warner Bros. Discovery reported EPS of negative $0.10, up from negative $0.20 in the same quarter last year. Despite growing year on year, this print missed analysts’ estimates. Over the next 12 months, Wall Street expects Warner Bros. Discovery to perform poorly. Analysts forecast its full-year EPS of $0.29 will invert to negative negative $0.16.
8. Cash Is King
Free cash flow isn't a prominently featured metric in company financials and earnings releases, but we think it's telling because it accounts for all operating and capital expenses, making it tough to manipulate. Cash is king.
Warner Bros. Discovery has shown poor cash profitability over the last two years, giving the company limited opportunities to return capital to shareholders. Its free cash flow margin averaged 9.8%, lousy for a consumer discretionary business.
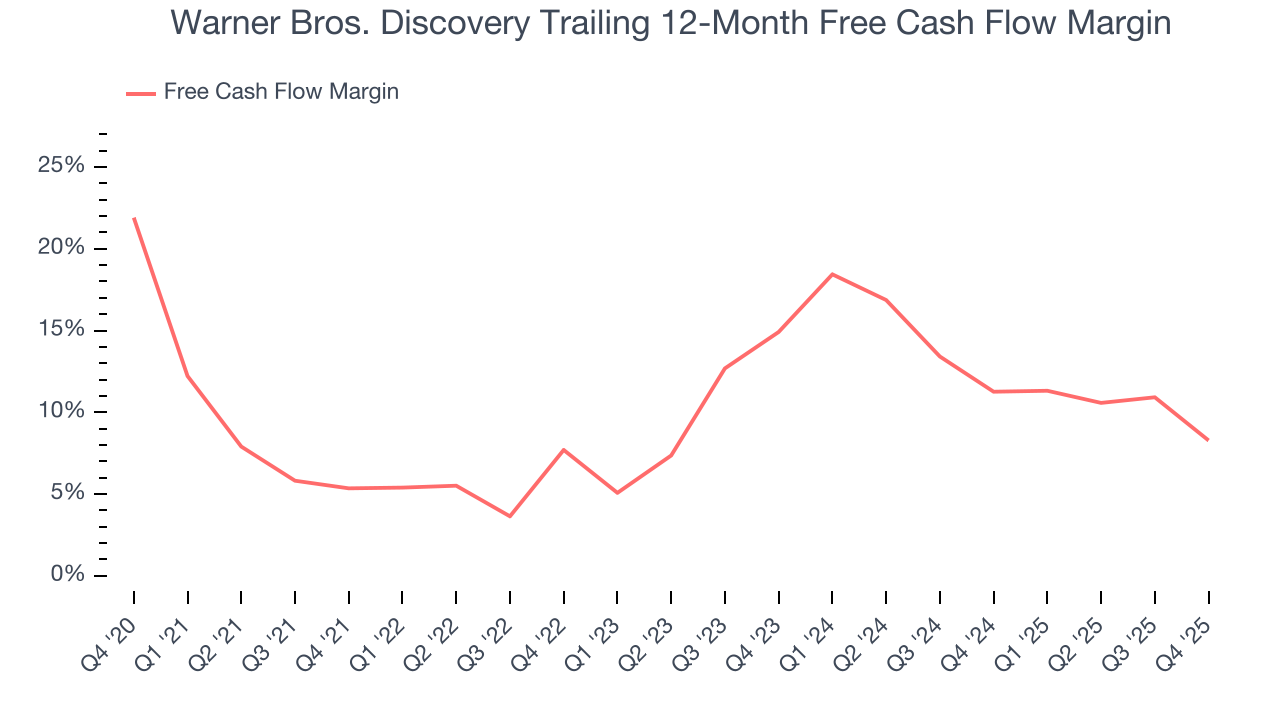
Warner Bros. Discovery’s free cash flow clocked in at $1.38 billion in Q4, equivalent to a 14.6% margin. The company’s cash profitability regressed as it was 9.6 percentage points lower than in the same quarter last year, but it’s still above its two-year average. We wouldn’t put too much weight on this quarter’s decline because investment needs can be seasonal, causing short-term swings. Long-term trends carry greater meaning.
Over the next year, analysts predict Warner Bros. Discovery’s cash conversion will slightly improve. Their consensus estimates imply its free cash flow margin of 8.3% for the last 12 months will increase to 9.5%, it options for capital deployment (investments, share buybacks, etc.).
9. Return on Invested Capital (ROIC)
EPS and free cash flow tell us whether a company was profitable while growing its revenue. But was it capital-efficient? Enter ROIC, a metric showing how much operating profit a company generates relative to the money it has raised (debt and equity).
Warner Bros. Discovery’s five-year average ROIC was negative 5.2%, meaning management lost money while trying to expand the business. Its returns were among the worst in the consumer discretionary sector.
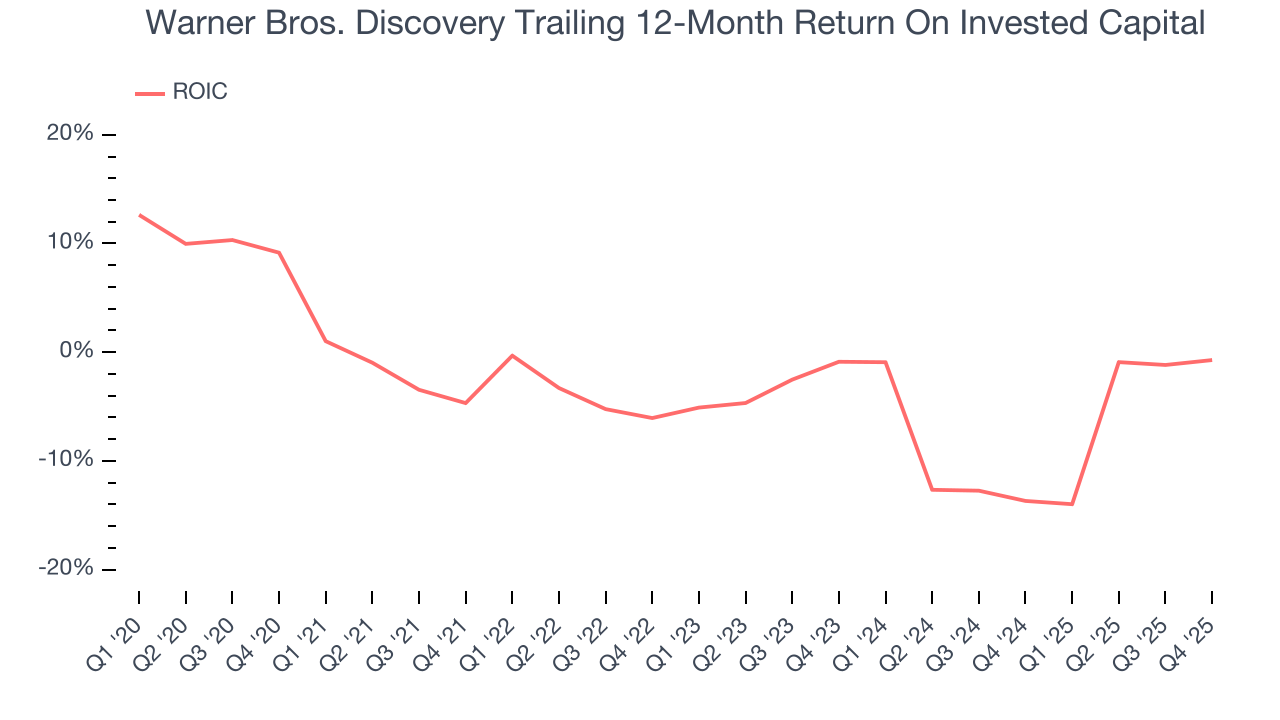
We like to invest in businesses with high returns, but the trend in a company’s ROIC is what often surprises the market and moves the stock price. Over the last few years, Warner Bros. Discovery’s ROIC averaged 1.8 percentage point decreases each year. Paired with its already low returns, these declines suggest its profitable growth opportunities are few and far between.
10. Balance Sheet Assessment
Warner Bros. Discovery reported $4.57 billion of cash and $32.57 billion of debt on its balance sheet in the most recent quarter. As investors in high-quality companies, we primarily focus on two things: 1) that a company’s debt level isn’t too high and 2) that its interest payments are not excessively burdening the business.
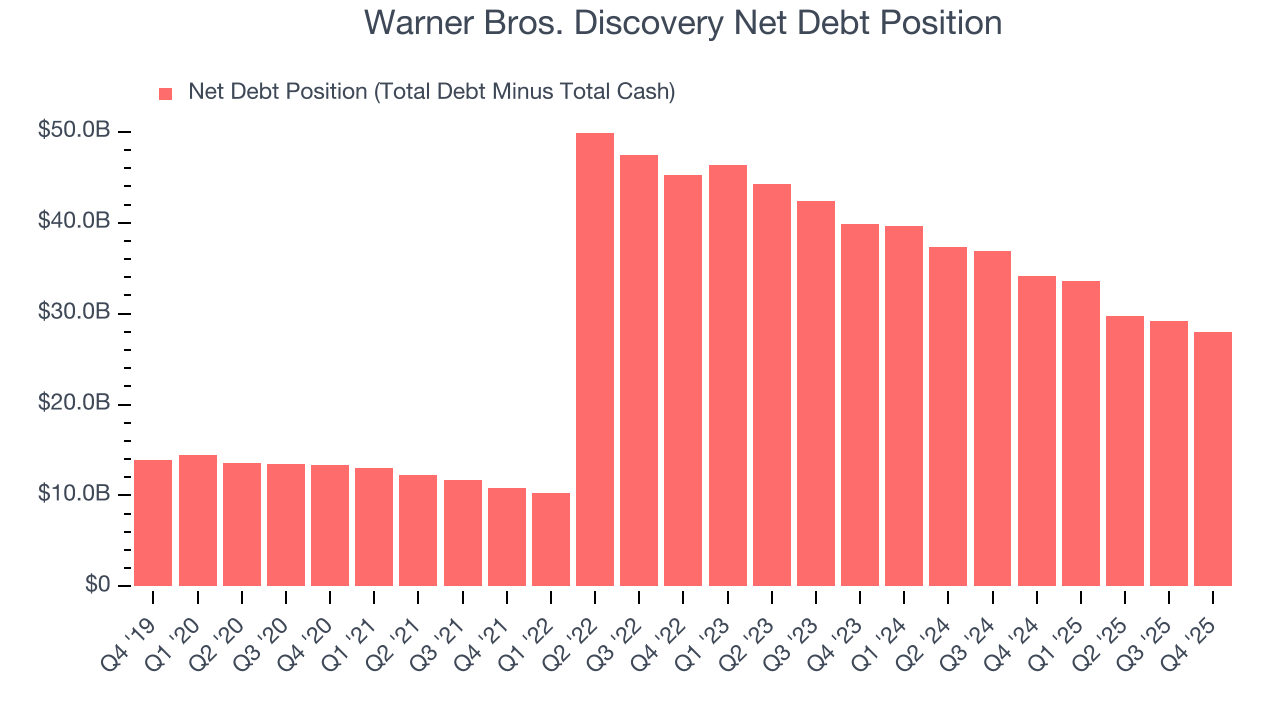
With $8.74 billion of EBITDA over the last 12 months, we view Warner Bros. Discovery’s 3.2× net-debt-to-EBITDA ratio as safe. We also see its $1.92 billion of annual interest expenses as appropriate. The company’s profits give it plenty of breathing room, allowing it to continue investing in growth initiatives.
11. Key Takeaways from Warner Bros. Discovery’s Q4 Results
It was encouraging to see Warner Bros. Discovery beat analysts’ EBITDA expectations this quarter. We were also happy its revenue narrowly outperformed Wall Street’s estimates. On the other hand, its EPS missed. Overall, this was a weaker quarter. The stock remained flat at $28.92 immediately after reporting.
12. Is Now The Time To Buy Warner Bros. Discovery?
Updated: March 19, 2026 at 11:10 PM EDT
The latest quarterly earnings matters, sure, but we actually think longer-term fundamentals and valuation matter more. Investors should consider all these pieces before deciding whether or not to invest in Warner Bros. Discovery.
We cheer for all companies serving everyday consumers, but in the case of Warner Bros. Discovery, we’ll be cheering from the sidelines. On top of that, Warner Bros. Discovery’s Forecasted free cash flow margin suggests the company will have more capital to invest or return to shareholders next year, and its declining EPS over the last five years makes it a less attractive asset to the public markets.
Warner Bros. Discovery’s EV-to-EBITDA ratio based on the next 12 months is 11.2x. This valuation tells us a lot of optimism is priced in - we think there are better stocks to buy right now.
Wall Street analysts have a consensus one-year price target of $29.60 on the company (compared to the current share price of $27.50).