
American Eagle (AEO)
We’re wary of American Eagle. Its weak sales growth and low returns on capital show it struggled to generate demand and profits.― StockStory Analyst Team
1. News


2. Summary
Why We Think American Eagle Will Underperform
With a heavy focus on denim, American Eagle Outfitters (NYSE:AEO) is a specialty retailer offering an assortment of apparel and accessories to young adults.
- Underwhelming 8.8% return on capital reflects management’s difficulties in finding profitable growth opportunities, and its falling returns suggest its earlier profit pools are drying up
- Lackluster 3.3% annual revenue growth over the last three years indicates the company is losing ground to competitors
- On the plus side, its comparable store sales rose by 3.1% on average over the past two years, demonstrating its ability to drive increased spending at existing locations


American Eagle doesn’t satisfy our quality benchmarks. Our attention is focused on better businesses.
Why There Are Better Opportunities Than American Eagle


American Eagle is trading at $17.23 per share, or 9.9x forward P/E. American Eagle’s valuation may seem like a great deal, but we think there are valid reasons why it’s so cheap.
Our advice is to pay up for elite businesses whose advantages are tailwinds to earnings growth. Don’t get sucked into lower-quality businesses just because they seem like bargains. These mediocre businesses often never achieve a higher multiple as hoped, a phenomenon known as a “value trap”.
3. American Eagle (AEO) Research Report: Q4 CY2025 Update
Young adult apparel retailer American Eagle Outfitters (NYSE:AEO) announced better-than-expected revenue in Q4 CY2025, with sales up 9.7% year on year to $1.76 billion. Its non-GAAP profit of $0.84 per share was 17.8% above analysts’ consensus estimates.
American Eagle (AEO) Q4 CY2025 Highlights:
- Revenue: $1.76 billion vs analyst estimates of $1.74 billion (9.7% year-on-year growth, 1.2% beat)
- Adjusted EPS: $0.84 vs analyst estimates of $0.71 (17.8% beat)
- Adjusted EBITDA: $148.4 million vs analyst estimates of $225.5 million (8.4% margin, 34.2% miss)
- Operating Margin: 5.4%, down from 8.9% in the same quarter last year
- Locations: 1,168 at quarter end, down from 1,172 in the same quarter last year
- Same-Store Sales rose 8% year on year (3% in the same quarter last year)
- Market Capitalization: $3.77 billion
Company Overview
With a heavy focus on denim, American Eagle Outfitters (NYSE:AEO) is a specialty retailer offering an assortment of apparel and accessories to young adults.
In addition to denim in various styles and washes, shoppers can find other casual clothing such as t-shirts, sweatshirts, and dresses. The American Eagle aesthetic is youthful, with a colorful palette. The core customer is the 15 to 25 set (male and female) who favors a relaxed, Americana look. American Eagle’s prices are mid-tier, neither approaching the stratosphere of luxury brands but also not as affordable as fast fashion.
Stores are roughly 6,000 square feet and located in malls or shopping centers along with other retailers. There is usually a male side of the store and a female one, with the center featuring displays of new releases or promoted items. In addition to physical stores, American Eagle has an ecommerce presence that gives customers options such as pure online shopping or buying online and picking up in store.
In addition to the core American Eagle brand, the company also operates Aerie, which offers lingerie, loungewear, and swimwear for women. The company acquired Todd Snyder, a men's fashion brand, in 2021.
4. Apparel Retailer
Apparel sales are not driven so much by personal needs but by seasons, trends, and innovation, and over the last few decades, the category has shifted meaningfully online. Retailers that once only had brick-and-mortar stores are responding with omnichannel presences. The online shopping experience continues to improve and retail foot traffic in places like shopping malls continues to stall, so the evolution of clothing sellers marches on.
Retailers offering youth-focused apparel and accessories include Abercrombie & Fitch (NYSE:ANF), Urban Outfitters (NASDAQ:URBN), and The Gap (NYSE:GPS).
5. Revenue Growth
A company’s long-term sales performance is one signal of its overall quality. Any business can have short-term success, but a top-tier one grows for years.
With $5.50 billion in revenue over the past 12 months, American Eagle is a mid-sized retailer, which sometimes brings disadvantages compared to larger competitors benefiting from better economies of scale.
As you can see below, American Eagle’s sales grew at a sluggish 3.3% compounded annual growth rate over the last three years as its store footprint remained unchanged.
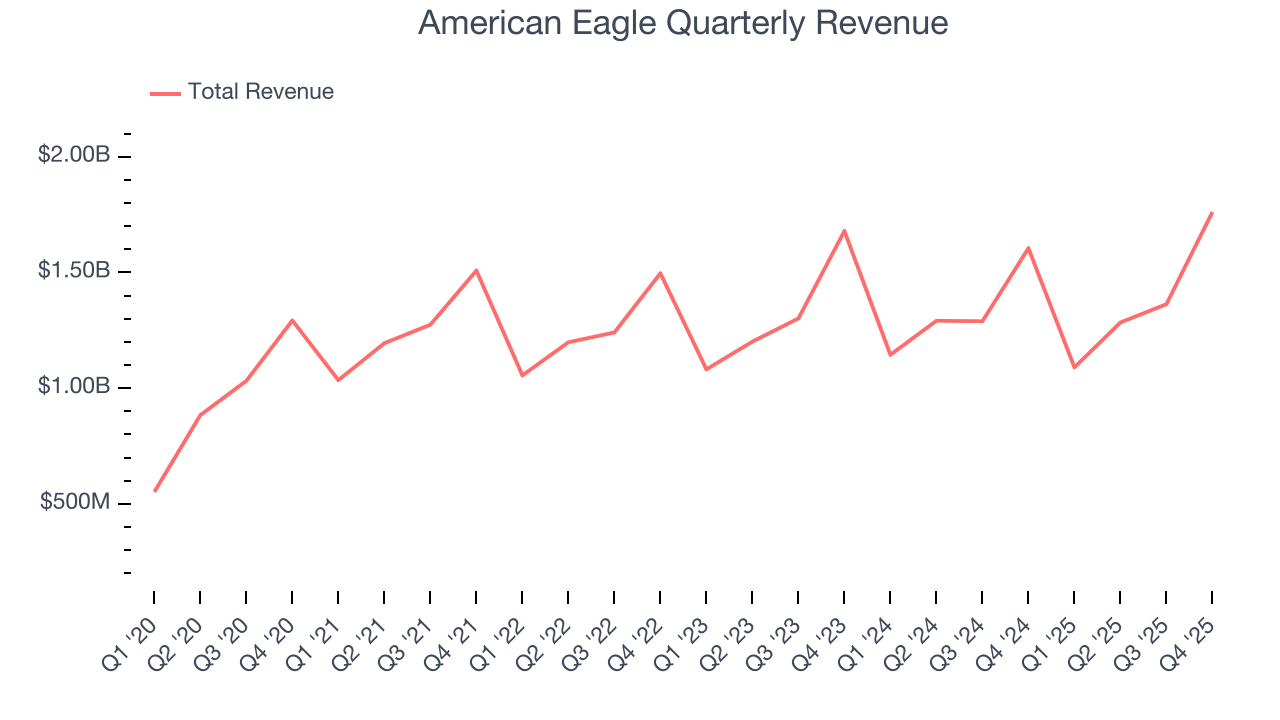
This quarter, American Eagle reported year-on-year revenue growth of 9.7%, and its $1.76 billion of revenue exceeded Wall Street’s estimates by 1.2%.
Looking ahead, sell-side analysts expect revenue to grow 3.2% over the next 12 months, similar to its three-year rate. This projection is above the sector average and indicates its newer products will help sustain its historical top-line performance.
6. Store Performance
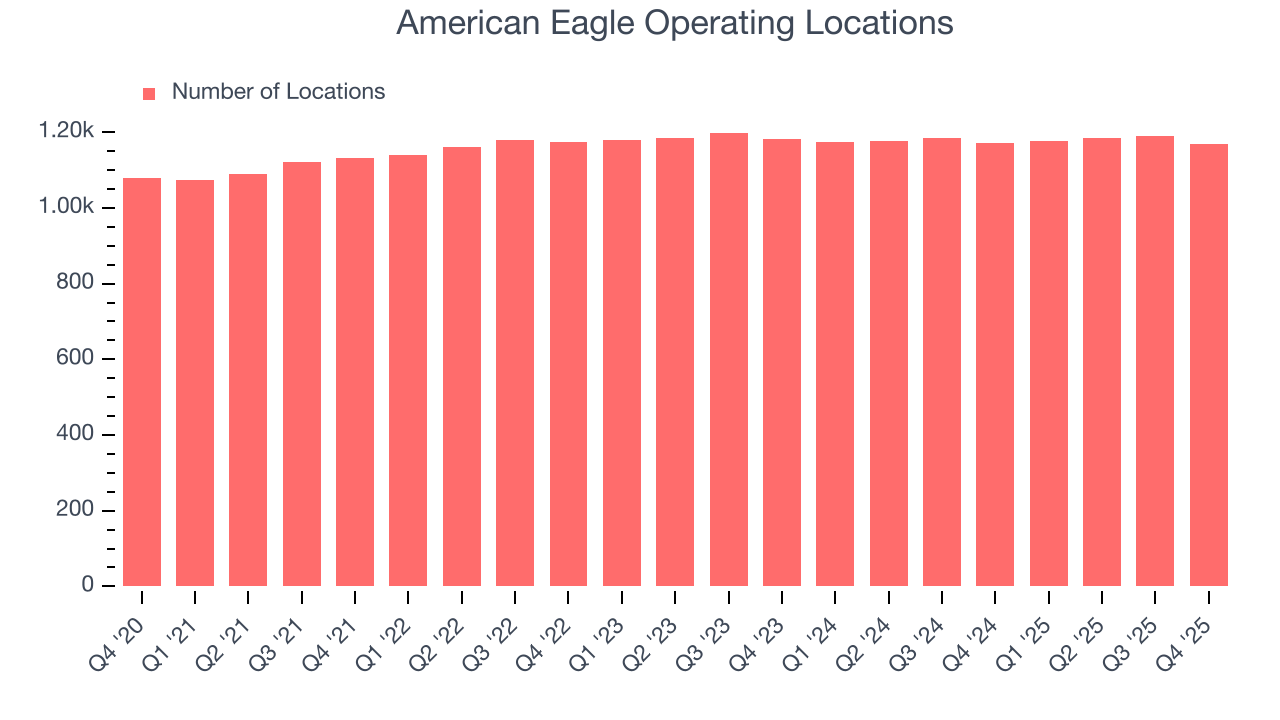
Number of Stores
The number of stores a retailer operates is a critical driver of how quickly company-level sales can grow.
American Eagle operated 1,168 locations in the latest quarter, and over the last two years, has kept its store count flat while other consumer retail businesses have opted for growth.
When a retailer keeps its store footprint steady, it usually means demand is stable and it’s focusing on operational efficiency to increase profitability.
Same-Store Sales
The change in a company's store base only tells one side of the story. The other is the performance of its existing locations and e-commerce sales, which informs management teams whether they should expand or downsize their physical footprints. Same-store sales is an industry measure of whether revenue is growing at those existing stores and is driven by customer visits (often called traffic) and the average spending per customer (ticket).
American Eagle’s demand has been healthy for a retailer over the last two years. On average, the company has grown its same-store sales by a robust 3.1% per year. Given its flat store base over the same period, this performance stems from not only increased foot traffic at existing locations but also higher e-commerce sales as demand shifts from in-store to online.
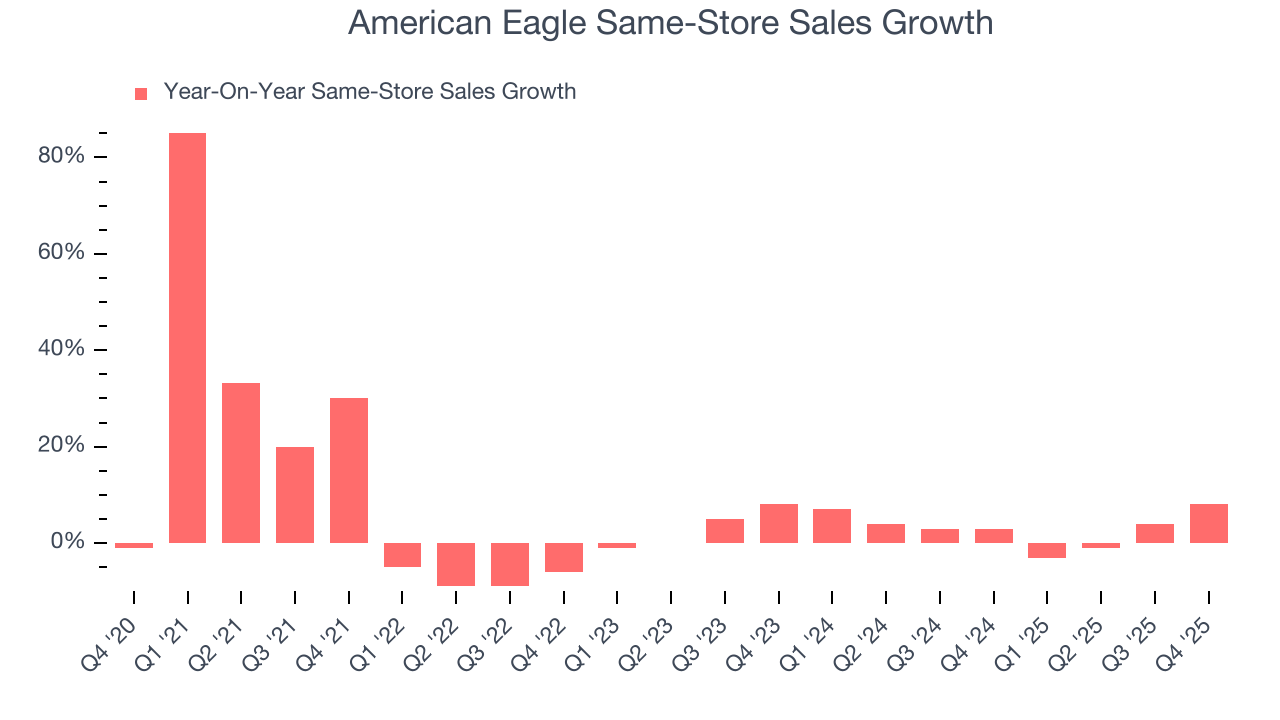
In the latest quarter, American Eagle’s same-store sales rose 8% year on year. This growth was an acceleration from its historical levels, which is always an encouraging sign.
7. Gross Margin & Pricing Power
American Eagle’s gross margin is slightly below the average retailer, giving it less room to invest in areas such as marketing and talent to grow its brand. As you can see below, it averaged a 38% gross margin over the last two years. Said differently, American Eagle had to pay a chunky $61.99 to its suppliers for every $100 in revenue. 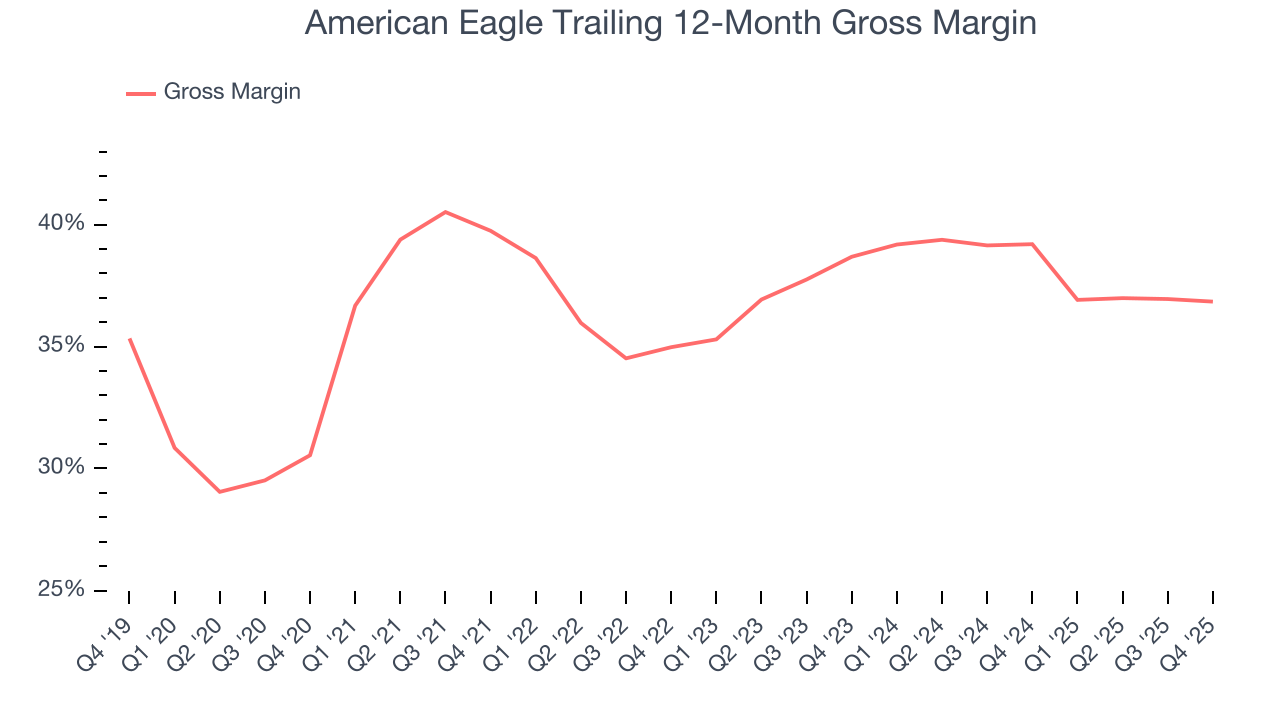
American Eagle produced a 37% gross profit margin in Q4, in line with the same quarter last year. On a wider time horizon, American Eagle’s full-year margin has been trending down over the past 12 months, decreasing by 2.4 percentage points. If this move continues, it could suggest a more competitive environment with some pressure to discount products and higher input costs (such as labor and freight expenses to transport goods).
8. Operating Margin
American Eagle was profitable over the last two years but held back by its large cost base. Its average operating margin of 6% was weak for a consumer retail business. This result isn’t too surprising given its low gross margin as a starting point.
Analyzing the trend in its profitability, American Eagle’s operating margin decreased by 3.9 percentage points over the last year. This raises questions about the company’s expense base because its revenue growth should have given it leverage on its fixed costs, resulting in better economies of scale and profitability. American Eagle’s performance was poor no matter how you look at it - it shows that costs were rising and it couldn’t pass them onto its customers.
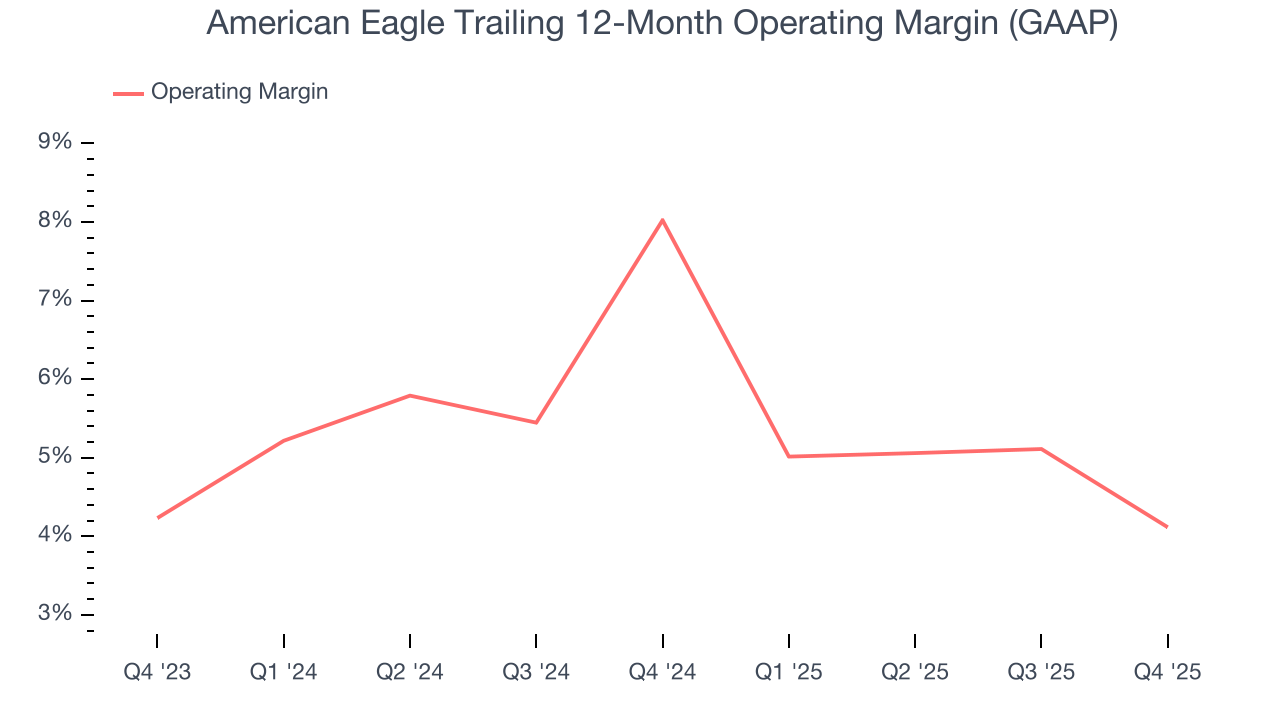
In Q4, American Eagle generated an operating margin profit margin of 5.4%, down 3.4 percentage points year on year. Since American Eagle’s operating margin decreased more than its gross margin, we can assume it was less efficient because expenses such as marketing, and administrative overhead increased.
9. Earnings Per Share
We track the long-term change in earnings per share (EPS) for the same reason as long-term revenue growth. Compared to revenue, however, EPS highlights whether a company’s growth is profitable.
American Eagle’s EPS grew at 13.8% compounded annual growth rate over the last three years, higher than its 3.3% annualized revenue growth. However, this alone doesn’t tell us much about its business quality because its operating margin didn’t improve.
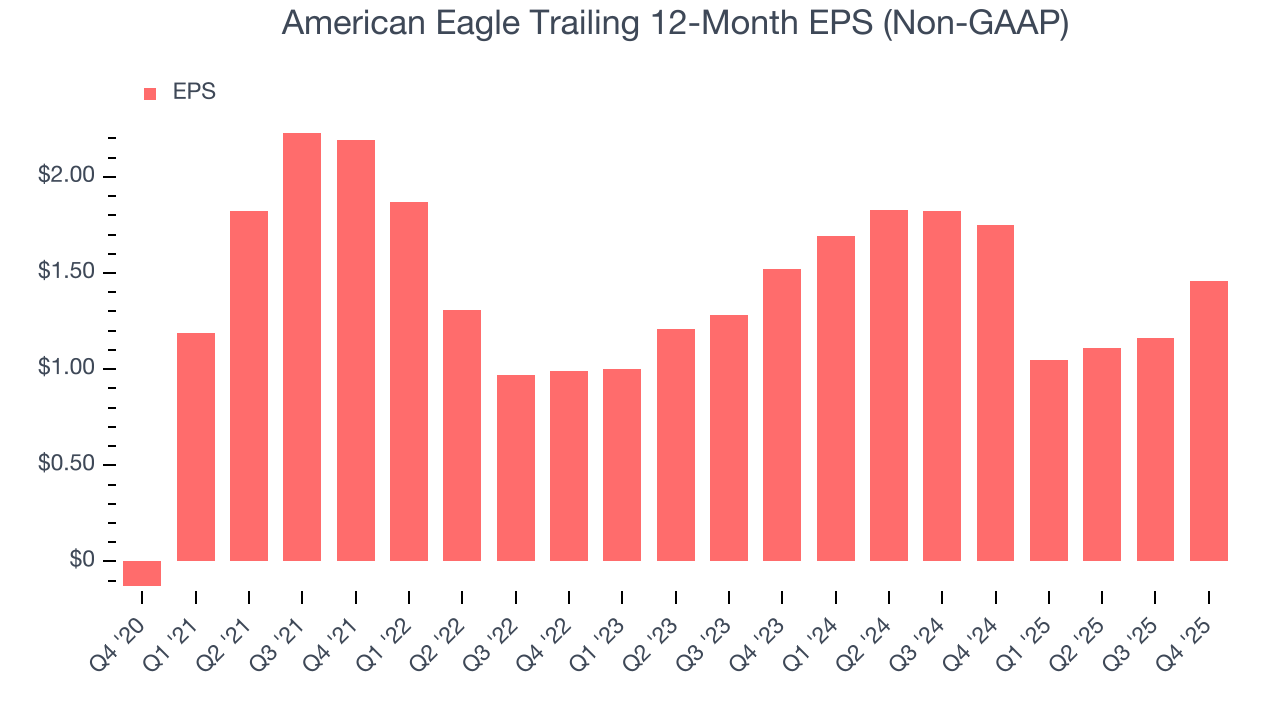
In Q4, American Eagle reported adjusted EPS of $0.84, up from $0.54 in the same quarter last year. This print easily cleared analysts’ estimates, and shareholders should be content with the results. Over the next 12 months, Wall Street expects American Eagle’s full-year EPS of $1.46 to grow 17.3%.
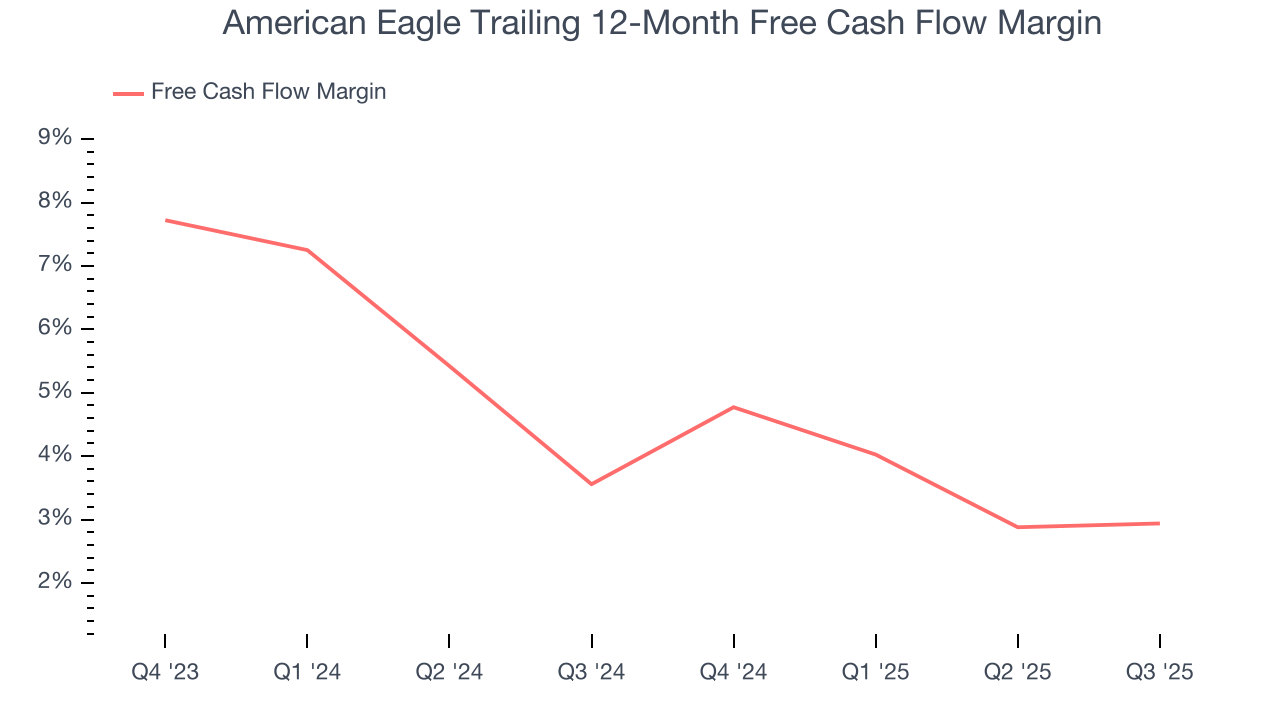
10. Cash Is King
Although earnings are undoubtedly valuable for assessing company performance, we believe cash is king because you can’t use accounting profits to pay the bills.
American Eagle has shown mediocre cash profitability relative to peers over the last two years, giving the company fewer opportunities to return capital to shareholders. Its free cash flow margin averaged 1%, below what we’d expect for a consumer retail business.
11. Return on Invested Capital (ROIC)
EPS and free cash flow tell us whether a company was profitable while growing its revenue. But was it capital-efficient? Enter ROIC, a metric showing how much operating profit a company generates relative to the money it has raised (debt and equity).
American Eagle historically did a mediocre job investing in profitable growth initiatives. Its five-year average ROIC was 9%, somewhat low compared to the best consumer retail companies that consistently pump out 25%+.
12. Balance Sheet Assessment
American Eagle reported $238.9 million of cash and $1.73 billion of debt on its balance sheet in the most recent quarter. As investors in high-quality companies, we primarily focus on two things: 1) that a company’s debt level isn’t too high and 2) that its interest payments are not excessively burdening the business.
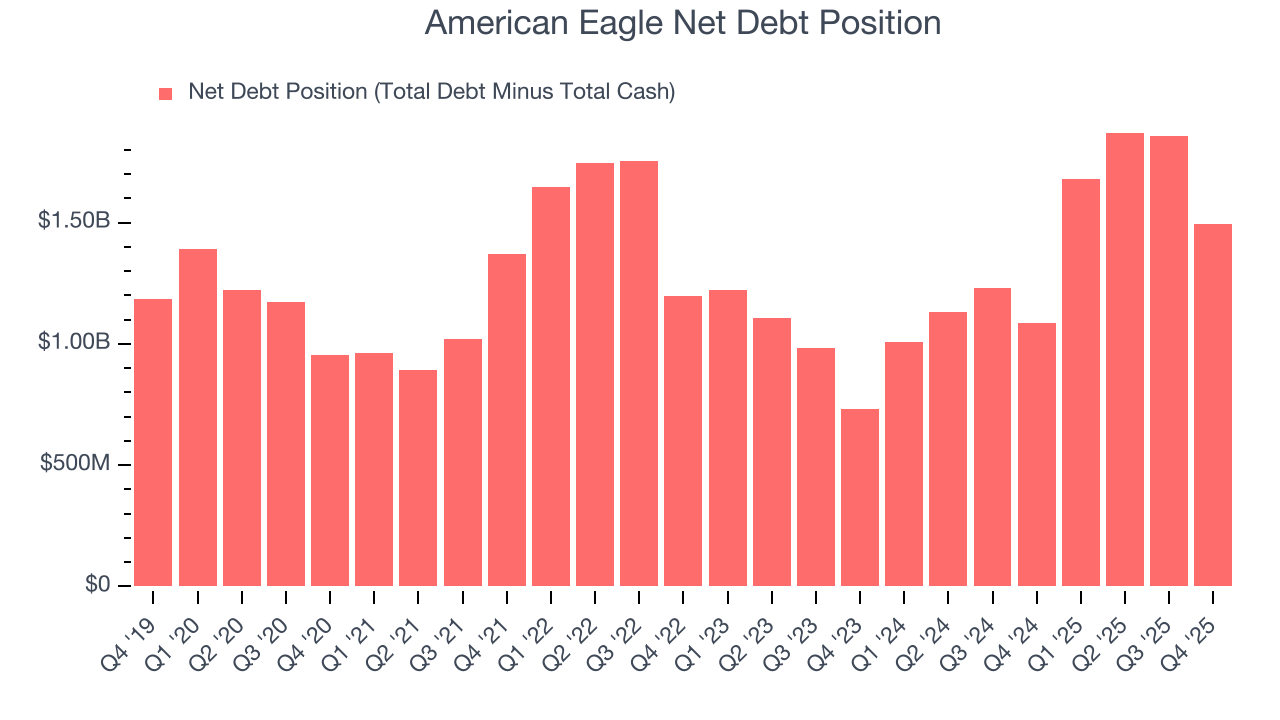
With $455.3 million of EBITDA over the last 12 months, we view American Eagle’s 3.3× net-debt-to-EBITDA ratio as safe. We also see its $3.58 million of annual interest expenses as appropriate. The company’s profits give it plenty of breathing room, allowing it to continue investing in growth initiatives.
13. Key Takeaways from American Eagle’s Q4 Results
It was good to see American Eagle beat analysts’ EPS expectations this quarter. We were also happy its revenue narrowly outperformed Wall Street’s estimates. On the other hand, its EBITDA missed. Overall, this was a softer quarter. The stock remained flat at $22.78 immediately following the results.
14. Is Now The Time To Buy American Eagle?
Updated: March 20, 2026 at 10:42 PM EDT
The latest quarterly earnings matters, sure, but we actually think longer-term fundamentals and valuation matter more. Investors should consider all these pieces before deciding whether or not to invest in American Eagle.
American Eagle isn’t a terrible business, but it doesn’t pass our quality test. To begin with, its revenue growth was uninspiring over the last three years. While its projected EPS for the next year implies the company’s fundamentals will improve, the downside is its relatively low ROIC suggests management has struggled to find compelling investment opportunities. On top of that, its low growth in new store openings show it’s focused on existing locations.
American Eagle’s P/E ratio based on the next 12 months is 9.9x. While this valuation is optically cheap, the potential downside is big given its shaky fundamentals. We're fairly confident there are better investments elsewhere.
Wall Street analysts have a consensus one-year price target of $23.89 on the company (compared to the current share price of $17.23).
Although the price target is bullish, readers should exercise caution because analysts tend to be overly optimistic. The firms they work for, often big banks, have relationships with companies that extend into fundraising, M&A advisory, and other rewarding business lines. As a result, they typically hesitate to say bad things for fear they will lose out. We at StockStory do not suffer from such conflicts of interest, so we’ll always tell it like it is.