
American Eagle (AEO)
We’re skeptical of American Eagle. Its sales have underperformed and its low returns on capital show it has few growth opportunities.― StockStory Analyst Team
1. News


2. Summary
Why We Think American Eagle Will Underperform
With a heavy focus on denim, American Eagle Outfitters (NYSE:AEO) is a specialty retailer offering an assortment of apparel and accessories to young adults.
- ROIC of 9% reflects management’s challenges in identifying attractive investment opportunities, and its falling returns suggest its earlier profit pools are drying up
- Responsiveness to unforeseen market trends is restricted due to its substandard operating margin profitability
- The good news is that its locations open for at least a year are seeing increased demand as same-store sales have averaged 3.1% growth over the past two years


American Eagle doesn’t measure up to our expectations. More profitable opportunities exist elsewhere.
Why There Are Better Opportunities Than American Eagle


American Eagle is trading at $24.15 per share, or 15.3x forward P/E. This multiple is high given its weaker fundamentals.
It’s better to pay up for high-quality businesses with strong long-term earnings potential rather than to buy lower-quality companies with open questions and big downside risks.
3. American Eagle (AEO) Research Report: Q3 CY2025 Update
Young adult apparel retailer American Eagle Outfitters (NYSE:AEO) announced better-than-expected revenue in Q3 CY2025, with sales up 5.7% year on year to $1.36 billion. Its GAAP profit of $0.53 per share was 24% above analysts’ consensus estimates.
American Eagle (AEO) Q3 CY2025 Highlights:
- Revenue: $1.36 billion vs analyst estimates of $1.32 billion (5.7% year-on-year growth, 3.1% beat)
- EPS (GAAP): $0.53 vs analyst estimates of $0.43 (24% beat)
- Adjusted EBITDA: $165.5 million vs analyst estimates of $154.1 million (12.1% margin, 7.4% beat)
- Operating Margin: 8.3%, in line with the same quarter last year
- Locations: 1,190 at quarter end, up from 1,186 in the same quarter last year
- Same-Store Sales rose 4% year on year (3% in the same quarter last year)
- Market Capitalization: $3.60 billion
Company Overview
With a heavy focus on denim, American Eagle Outfitters (NYSE:AEO) is a specialty retailer offering an assortment of apparel and accessories to young adults.
In addition to denim in various styles and washes, shoppers can find other casual clothing such as t-shirts, sweatshirts, and dresses. The American Eagle aesthetic is youthful, with a colorful palette. The core customer is the 15 to 25 set (male and female) who favors a relaxed, Americana look. American Eagle’s prices are mid-tier, neither approaching the stratosphere of luxury brands but also not as affordable as fast fashion.
Stores are roughly 6,000 square feet and located in malls or shopping centers along with other retailers. There is usually a male side of the store and a female one, with the center featuring displays of new releases or promoted items. In addition to physical stores, American Eagle has an ecommerce presence that gives customers options such as pure online shopping or buying online and picking up in store.
In addition to the core American Eagle brand, the company also operates Aerie, which offers lingerie, loungewear, and swimwear for women. The company acquired Todd Snyder, a men's fashion brand, in 2021.
4. Apparel Retailer
Apparel sales are not driven so much by personal needs but by seasons, trends, and innovation, and over the last few decades, the category has shifted meaningfully online. Retailers that once only had brick-and-mortar stores are responding with omnichannel presences. The online shopping experience continues to improve and retail foot traffic in places like shopping malls continues to stall, so the evolution of clothing sellers marches on.
Retailers offering youth-focused apparel and accessories include Abercrombie & Fitch (NYSE:ANF), Urban Outfitters (NASDAQ:URBN), and The Gap (NYSE:GPS).
5. Revenue Growth
Examining a company’s long-term performance can provide clues about its quality. Any business can put up a good quarter or two, but many enduring ones grow for years.
With $5.34 billion in revenue over the past 12 months, American Eagle is a mid-sized retailer, which sometimes brings disadvantages compared to larger competitors benefiting from better economies of scale.
As you can see below, American Eagle grew its sales at a sluggish 2.2% compounded annual growth rate over the last three years (we compare to 2019 to normalize for COVID-19 impacts) as its store footprint remained unchanged.
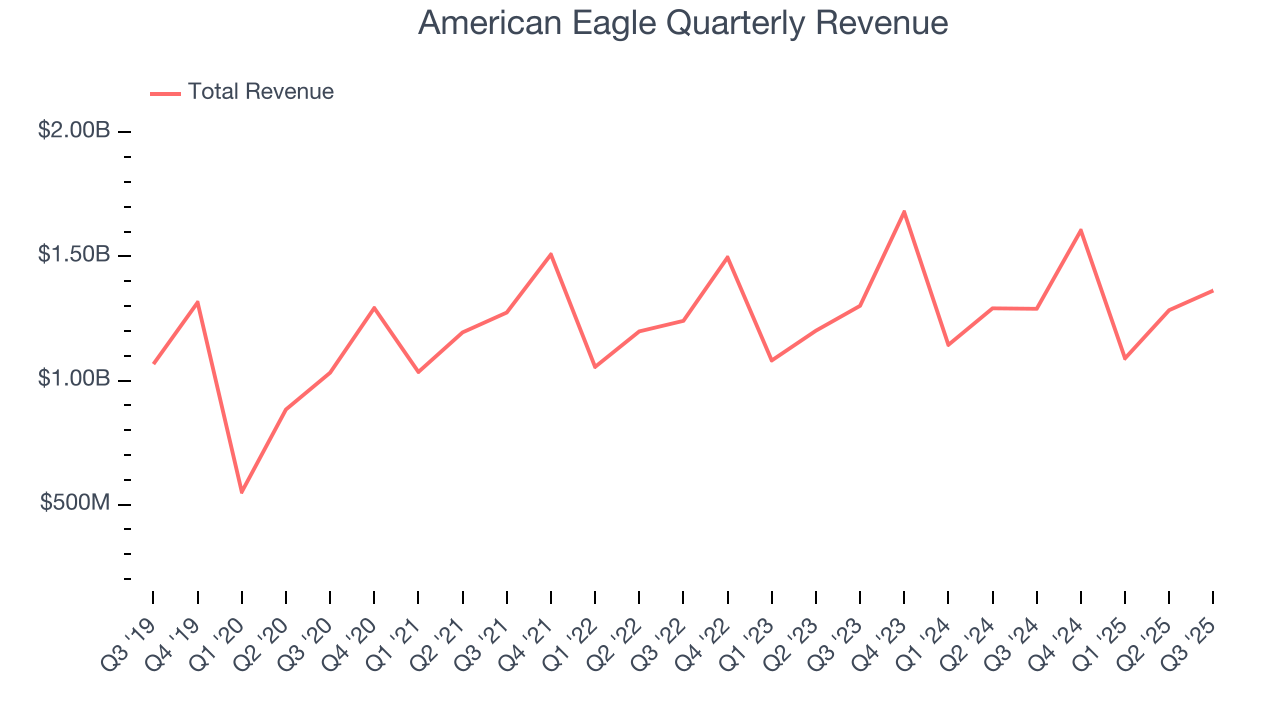
This quarter, American Eagle reported year-on-year revenue growth of 5.7%, and its $1.36 billion of revenue exceeded Wall Street’s estimates by 3.1%.
Looking ahead, sell-side analysts expect revenue to grow 1.5% over the next 12 months, similar to its three-year rate. This projection is underwhelming and implies its newer products will not catalyze better top-line performance yet.
6. Store Performance
Number of Stores
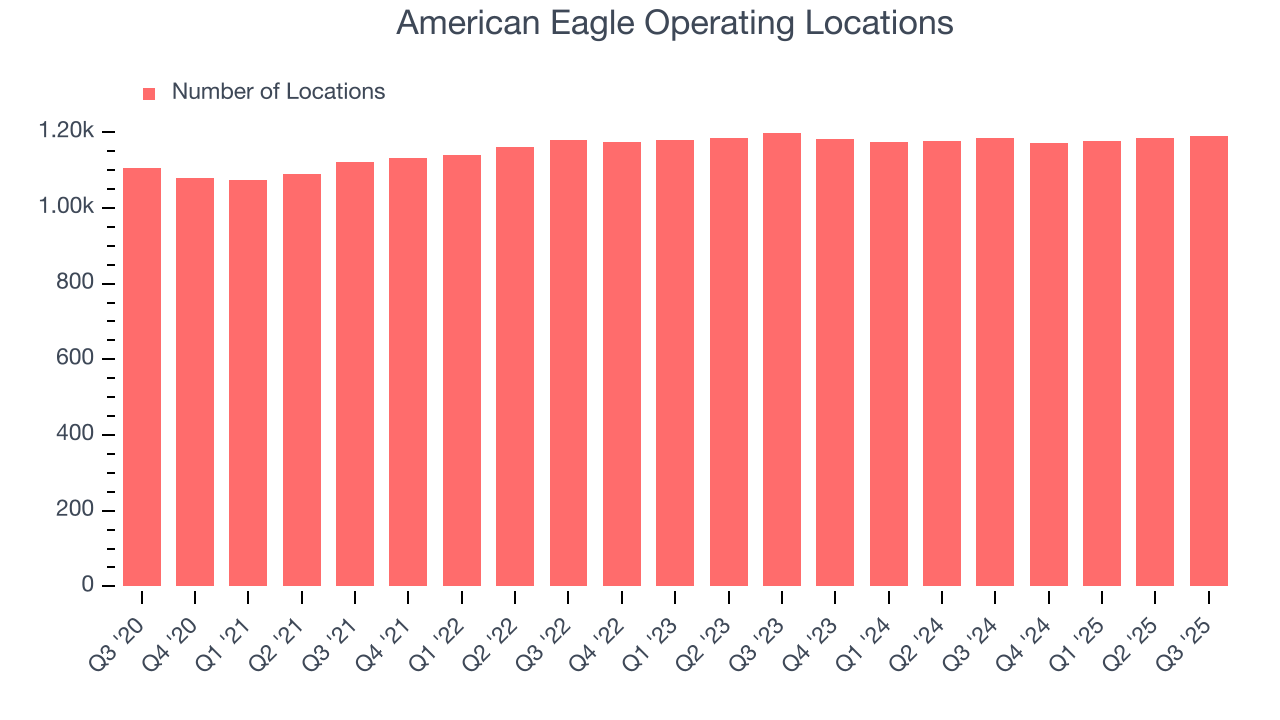
The number of stores a retailer operates is a critical driver of how quickly company-level sales can grow.
American Eagle operated 1,190 locations in the latest quarter, and over the last two years, has kept its store count flat while other consumer retail businesses have opted for growth.
When a retailer keeps its store footprint steady, it usually means demand is stable and it’s focusing on operational efficiency to increase profitability.
Same-Store Sales
A company's store base only paints one part of the picture. When demand is high, it makes sense to open more. But when demand is low, it’s prudent to close some locations and use the money in other ways. Same-store sales is an industry measure of whether revenue is growing at those existing stores and is driven by customer visits (often called traffic) and the average spending per customer (ticket).
American Eagle’s demand has been healthy for a retailer over the last two years. On average, the company has grown its same-store sales by a robust 3.1% per year. Given its flat store base over the same period, this performance stems from not only increased foot traffic at existing locations but also higher e-commerce sales as demand shifts from in-store to online.
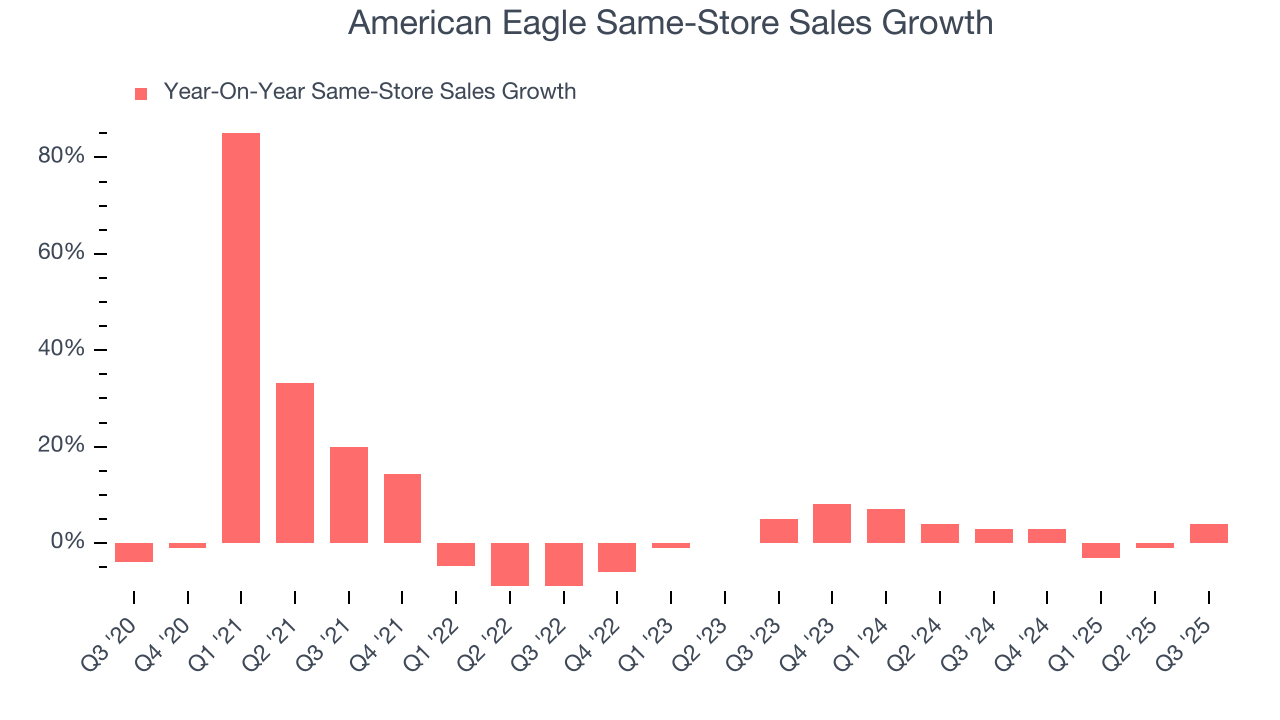
In the latest quarter, American Eagle’s same-store sales rose 4% year on year. This performance was more or less in line with its historical levels.
7. Gross Margin & Pricing Power
We prefer higher gross margins because they not only make it easier to generate more operating profits but also indicate product differentiation, negotiating leverage, and pricing power.
American Eagle’s gross margin is slightly below the average retailer, giving it less room to invest in areas such as marketing and talent to grow its brand. As you can see below, it averaged a 38.1% gross margin over the last two years. Said differently, American Eagle had to pay a chunky $61.94 to its suppliers for every $100 in revenue. 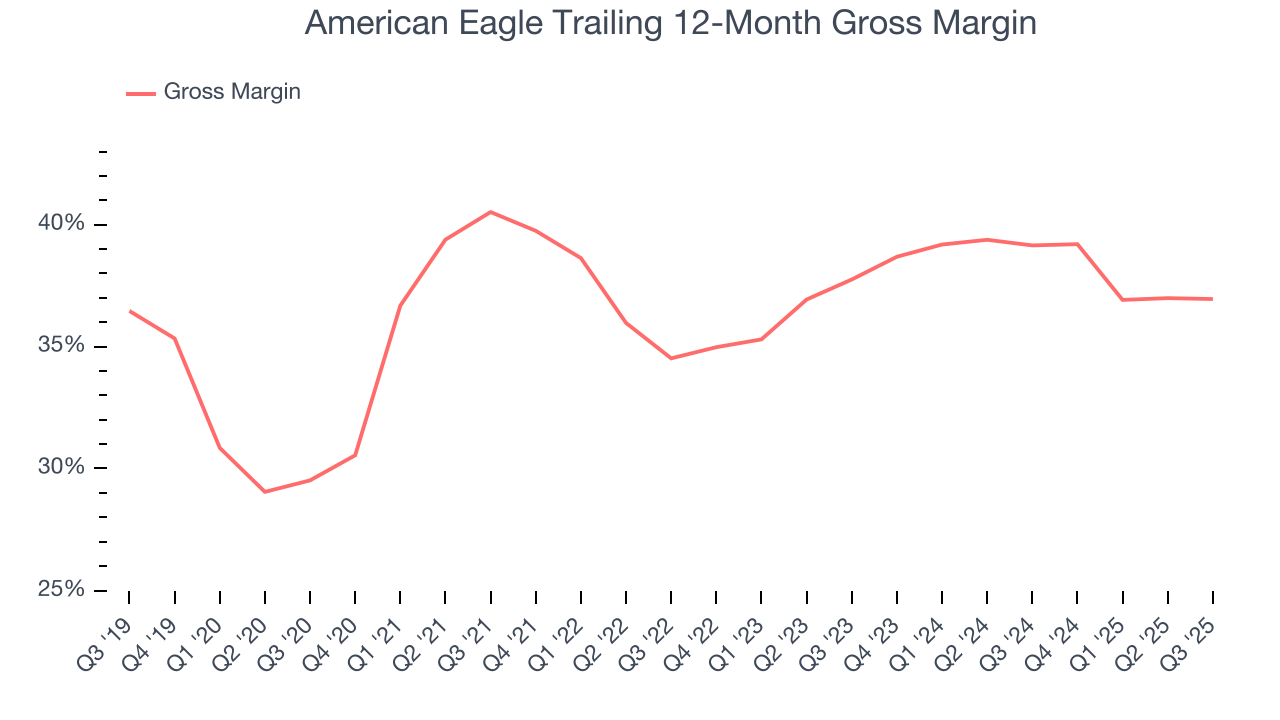
In Q3, American Eagle produced a 40.5% gross profit margin, in line with the same quarter last year. On a wider time horizon, American Eagle’s full-year margin has been trending down over the past 12 months, decreasing by 2.2 percentage points. If this move continues, it could suggest a more competitive environment with some pressure to discount products and higher input costs (such as labor and freight expenses to transport goods).
8. Operating Margin
Operating margin is a key measure of profitability. Think of it as net income - the bottom line - excluding the impact of taxes and interest on debt, which are less connected to business fundamentals.
American Eagle’s operating margin might fluctuated slightly over the last 12 months but has remained more or less the same, averaging 5.3% over the last two years. This profitability was paltry for a consumer retail business and caused by its suboptimal cost structureand low gross margin.
Analyzing the trend in its profitability, American Eagle’s operating margin might fluctuated slightly but has generally stayed the same over the last year. This raises questions about the company’s expense base because its revenue growth should have given it leverage on its fixed costs, resulting in better economies of scale and profitability.
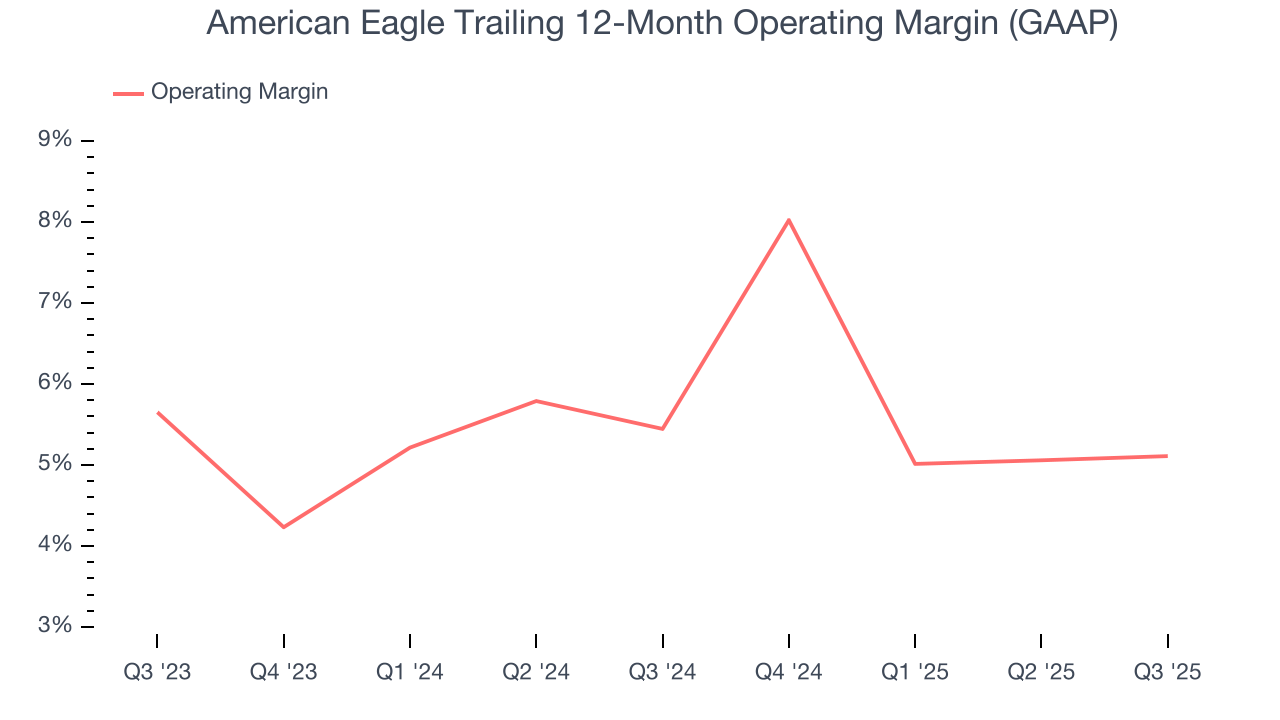
This quarter, American Eagle generated an operating margin profit margin of 8.3%, in line with the same quarter last year. This indicates the company’s cost structure has recently been stable.
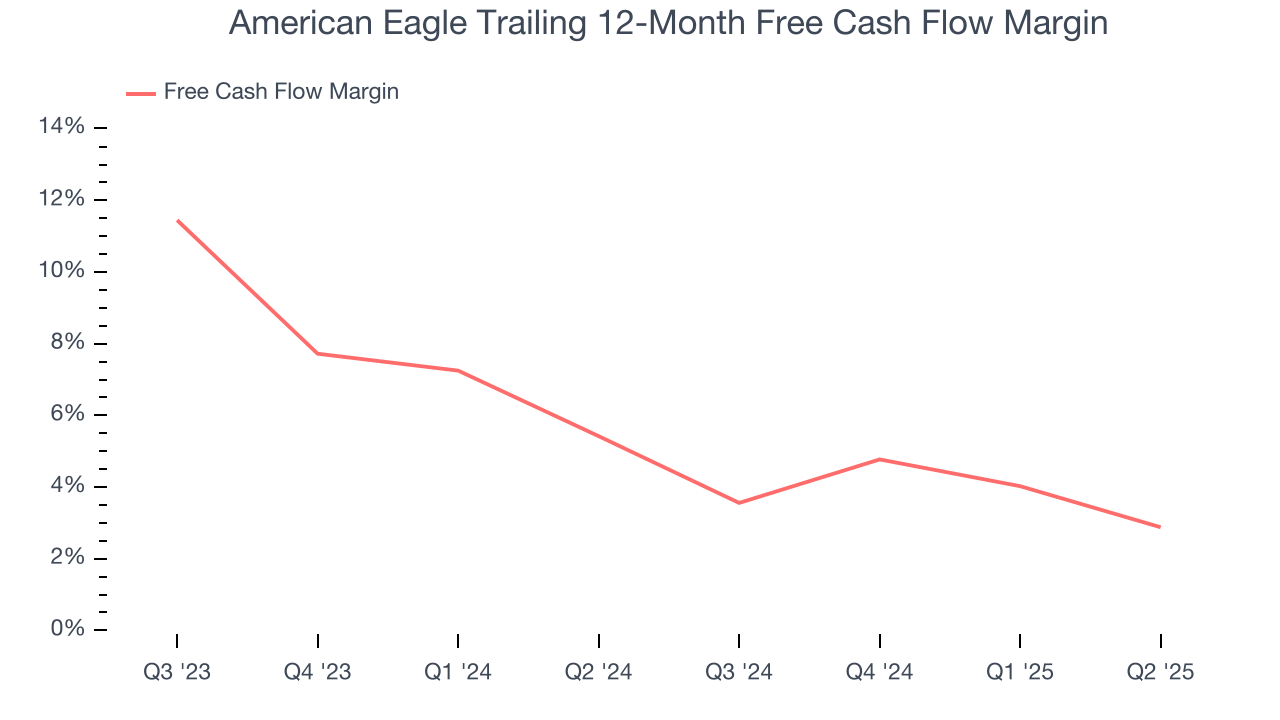
9. Cash Is King
Free cash flow isn't a prominently featured metric in company financials and earnings releases, but we think it's telling because it accounts for all operating and capital expenses, making it tough to manipulate. Cash is king.
American Eagle has shown decent cash profitability, giving it some flexibility to reinvest or return capital to investors. The company’s free cash flow margin averaged 3.7% over the last two years, slightly better than the broader consumer retail sector.
10. Return on Invested Capital (ROIC)
EPS and free cash flow tell us whether a company was profitable while growing its revenue. But was it capital-efficient? A company’s ROIC explains this by showing how much operating profit it makes compared to the money it has raised (debt and equity).
American Eagle historically did a mediocre job investing in profitable growth initiatives. Its five-year average ROIC was 9%, somewhat low compared to the best consumer retail companies that consistently pump out 25%+.
11. Balance Sheet Assessment
American Eagle reported $112.8 million of cash and $1.97 billion of debt on its balance sheet in the most recent quarter. As investors in high-quality companies, we primarily focus on two things: 1) that a company’s debt level isn’t too high and 2) that its interest payments are not excessively burdening the business.
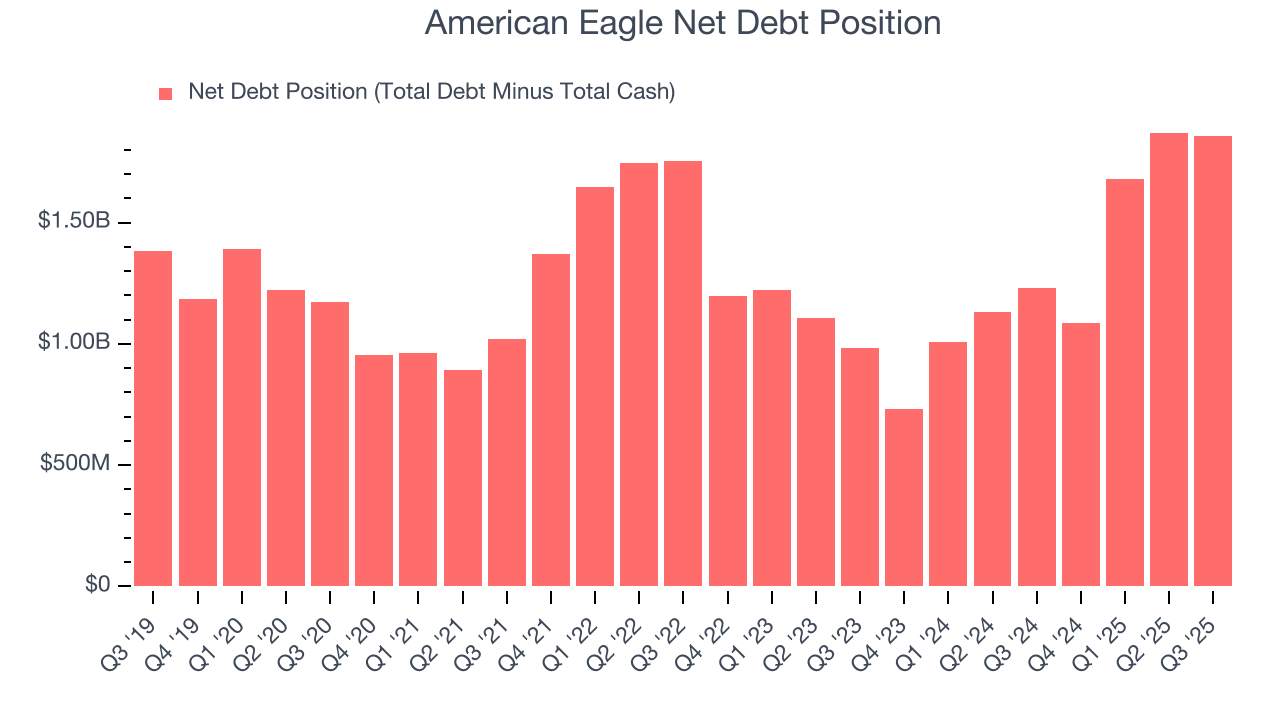
With $504.5 million of EBITDA over the last 12 months, we view American Eagle’s 3.7× net-debt-to-EBITDA ratio as safe. We also see its $2.80 million of annual interest expenses as appropriate. The company’s profits give it plenty of breathing room, allowing it to continue investing in growth initiatives.
12. Key Takeaways from American Eagle’s Q3 Results
We enjoyed seeing American Eagle beat analysts’ EBITDA expectations this quarter. We were also glad its EPS outperformed Wall Street’s estimates. Zooming out, we think this quarter featured some important positives. The stock traded up 9.3% to $22.98 immediately following the results.
13. Is Now The Time To Buy American Eagle?
Updated: January 24, 2026 at 9:37 PM EST
Before deciding whether to buy American Eagle or pass, we urge investors to consider business quality, valuation, and the latest quarterly results.
American Eagle’s business quality ultimately falls short of our standards. To begin with, its revenue growth was uninspiring over the last three years. And while its projected EPS for the next year implies the company’s fundamentals will improve, the downside is its relatively low ROIC suggests management has struggled to find compelling investment opportunities. On top of that, its operating margins are low compared to other retailers.
American Eagle’s P/E ratio based on the next 12 months is 15.3x. Beauty is in the eye of the beholder, but our analysis shows the upside isn’t great compared to the potential downside. We're fairly confident there are better stocks to buy right now.
Wall Street analysts have a consensus one-year price target of $25.78 on the company (compared to the current share price of $24.15).