
American Financial Group (AFG)
We wouldn’t recommend American Financial Group. Its decelerating revenue growth and even worse EPS performance give us little confidence it can beat the market.― StockStory Analyst Team
1. News


2. Summary
Why We Think American Financial Group Will Underperform
With roots dating back to 1872 and a business model that empowers local decision-making, American Financial Group (NYSE:AFG) is an insurance holding company that specializes in commercial property and casualty insurance products for businesses through its Great American Insurance Group.
- Incremental sales over the last two years were much less profitable as its earnings per share fell by 1.3% annually while its revenue grew
- Products and services are facing significant credit quality challenges during this cycle as book value per share has declined by 6% annually over the last five years
- 3.4% annual revenue growth over the last two years was slower than its insurance peers


American Financial Group’s quality doesn’t meet our expectations. There are more profitable opportunities elsewhere.
Why There Are Better Opportunities Than American Financial Group


At $127.34 per share, American Financial Group trades at 2x forward P/B. This multiple is higher than most insurance companies, and we think it’s quite expensive for the quality you get.
We’d rather invest in similarly-priced but higher-quality companies with more reliable earnings growth.
3. American Financial Group (AFG) Research Report: Q4 CY2025 Update
Insurance holding company American Financial Group (NYSE:AFG) reported revenue ahead of Wall Streets expectations in Q4 CY2025, with sales up 1.8% year on year to $2.06 billion. Its non-GAAP profit of $3.65 per share was 10.1% above analysts’ consensus estimates.
American Financial Group (AFG) Q4 CY2025 Highlights:
- Net Premiums Earned: $1.81 billion vs analyst estimates of $1.83 billion (2.4% year-on-year decline, 1.3% miss)
- Revenue: $2.06 billion vs analyst estimates of $2.02 billion (1.8% year-on-year growth, 2.2% beat)
- Pre-tax Profit: $379 million (18.4% margin)
- Adjusted EPS: $3.65 vs analyst estimates of $3.32 (10.1% beat)
- Book Value per Share: $57.78 vs analyst estimates of $57.44 (8.6% year-on-year growth, 0.6% beat)
- Market Capitalization: $10.85 billion
Company Overview
With roots dating back to 1872 and a business model that empowers local decision-making, American Financial Group (NYSE:AFG) is an insurance holding company that specializes in commercial property and casualty insurance products for businesses through its Great American Insurance Group.
AFG operates through approximately 35 distinct insurance businesses that collectively form the Great American Insurance Group. The company employs a decentralized approach, allowing each business unit to operate autonomously while maintaining central controls for investment and administrative functions. This entrepreneurial model enables local teams to respond quickly to market conditions while developing specialized products for niche markets.
The company's Property and Casualty operations are organized into three main segments. The Property and Transportation segment offers coverage for agricultural operations, commercial vehicles, and various property risks. The Specialty Casualty segment provides liability coverage through excess and surplus lines, executive and professional liability policies, general liability, and workers' compensation. The Specialty Financial segment focuses on fidelity and surety bonds, lease and loan protection, and trade credit insurance.
For example, a trucking company might purchase AFG's specialized physical damage coverage to protect its fleet, while a construction firm could obtain builders' risk insurance and contractors' equipment coverage. A financial institution might rely on AFG's fidelity coverage to protect against employee theft or fraud.
AFG generates revenue by collecting premiums from policyholders and investing those funds until claims need to be paid. The company maintains an in-house team of investment professionals who manage its portfolio. In 2021, AFG divested its annuity business to Massachusetts Mutual Life Insurance Company, allowing it to focus exclusively on its property and casualty operations.
4. Property & Casualty Insurance
Property & Casualty (P&C) insurers protect individuals and businesses against financial loss from damage to property or from legal liability. This is a cyclical industry, and the sector benefits when there is 'hard market', characterized by strong premium rate increases that outpace loss and cost inflation, resulting in robust underwriting margins. The opposite is true in a 'soft market'. Interest rates also matter, as they determine the yields earned on fixed-income portfolios. On the other hand, P&C insurers face a major secular headwind from the increasing frequency and severity of catastrophe losses due to climate change. Furthermore, the liability side of the business is pressured by 'social inflation'—the trend of rising litigation costs and larger jury awards.
American Financial Group competes with other property and casualty insurers including The Travelers Companies (NYSE:TRV), Chubb Limited (NYSE:CB), The Hartford Financial Services Group (NYSE:HIG), and W.R. Berkley Corporation (NYSE:WRB).
5. Revenue Growth
Insurance companies generate revenue three ways. The first is the core insurance business itself, represented in the income statement as premiums earned. The second source is investment income from investing the “float” (premiums collected but not yet paid out as claims) in assets such as fixed-income assets and equities. The third is fees from policy administration, annuities, and other value-added services. Over the last five years, American Financial Group grew its revenue at a decent 8.2% compounded annual growth rate. Its growth was slightly above the average insurance company and shows its offerings resonate with customers.
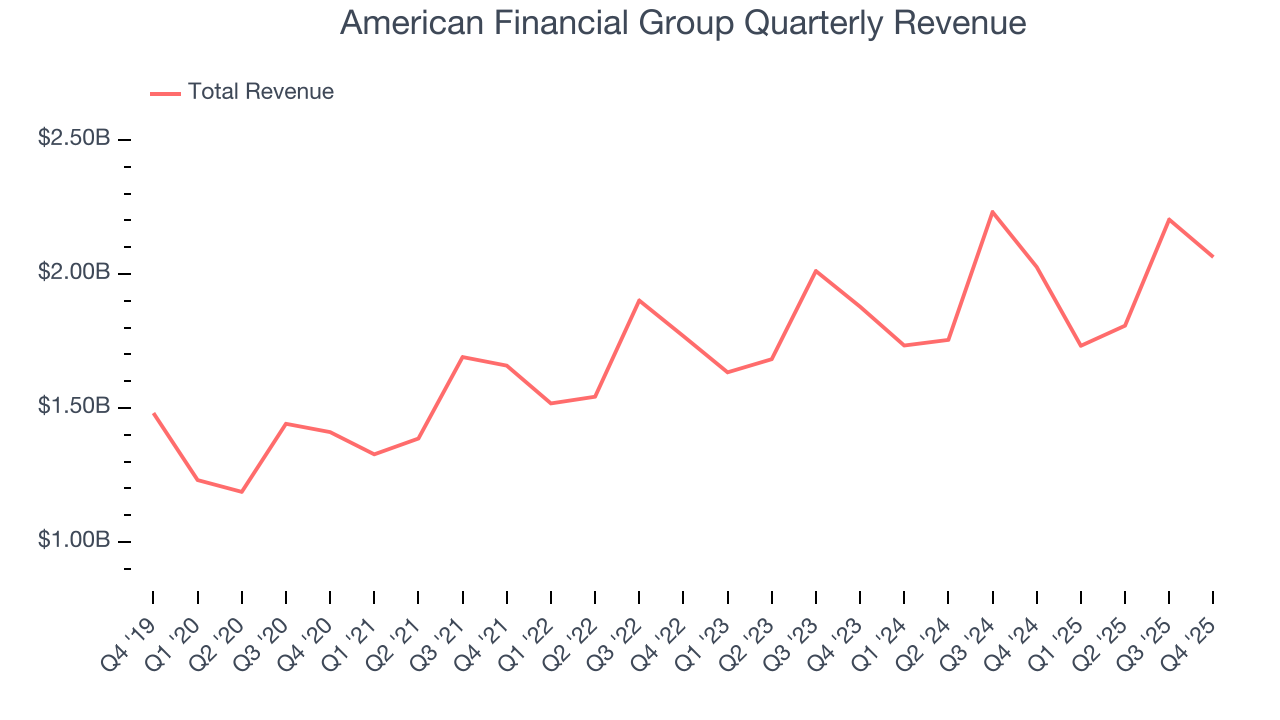
Long-term growth is the most important, but within financials, a half-decade historical view may miss recent interest rate changes and market returns. American Financial Group’s recent performance shows its demand has slowed as its annualized revenue growth of 4.1% over the last two years was below its five-year trend. 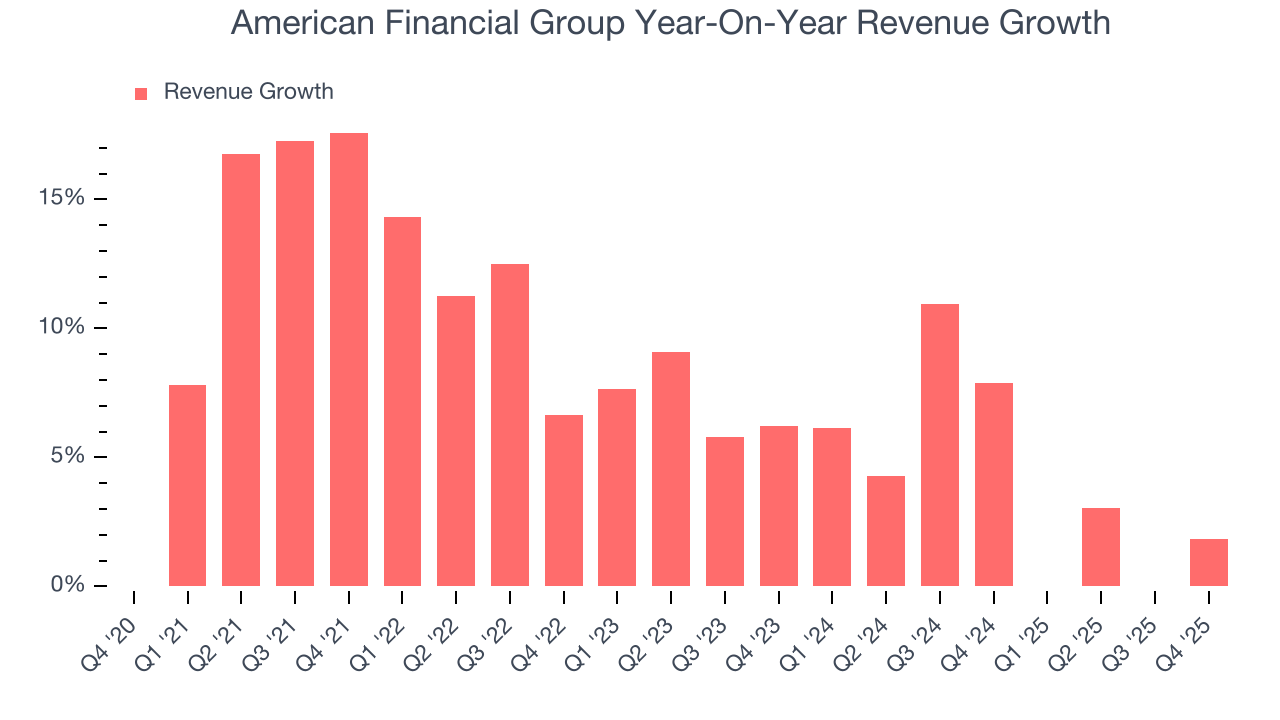 Note: Quarters not shown were determined to be outliers, impacted by outsized investment gains/losses that are not indicative of the recurring fundamentals of the business.
This quarter, American Financial Group reported modest year-on-year revenue growth of 1.8% but beat Wall Street’s estimates by 2.2%.
Net premiums earned made up 90.3% of the company’s total revenue during the last five years, meaning American Financial Group lives and dies by its underwriting activities because non-insurance operations barely move the needle.
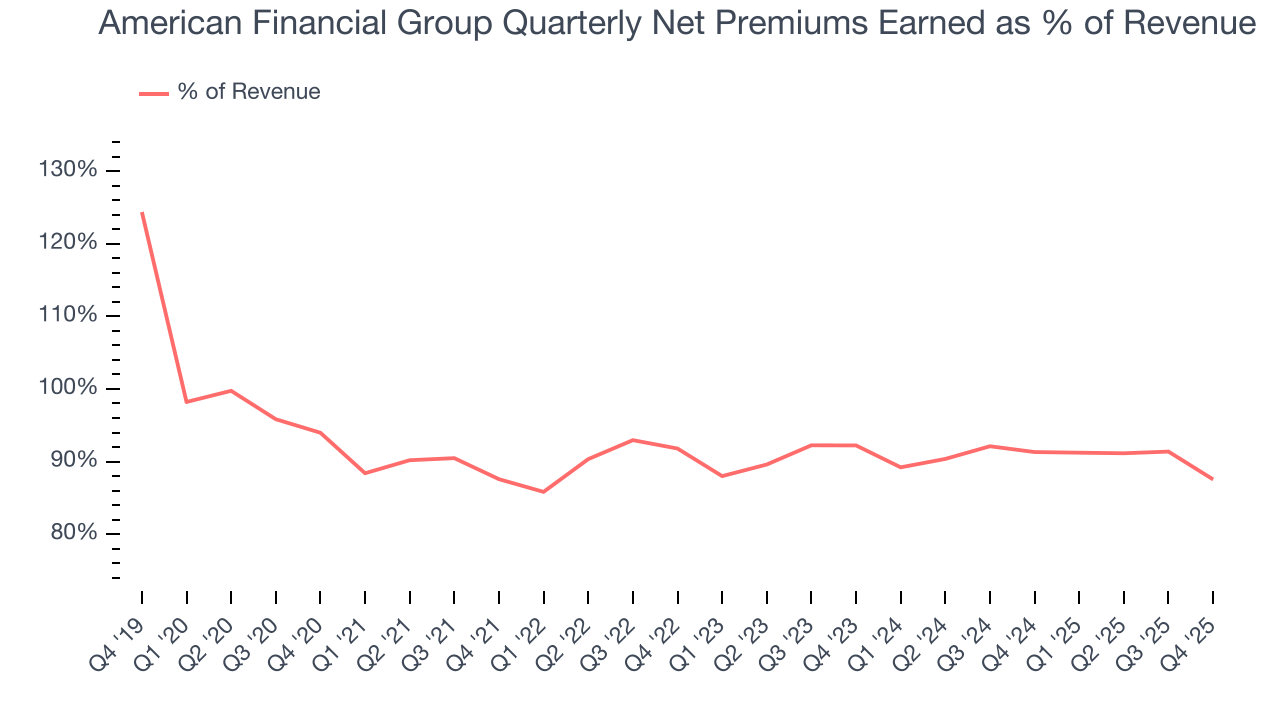
Markets consistently prioritize net premiums earned growth over investment and fee income, recognizing its superior quality as a core indicator of the company’s underwriting success and market penetration.
6. Net Premiums Earned
When insurers sell policies, they protect themselves from extremely large losses or an outsized accumulation of losses with reinsurance (insurance for insurance companies). Net premiums earned are therefore net of what’s ceded to reinsurers as a risk mitigation and transfer strategy.
American Financial Group’s net premiums earned has grown at a 6.7% annualized rate over the last five years, slightly worse than the broader insurance industry and slower than its total revenue.
When analyzing American Financial Group’s net premiums earned over the last two years, we can see that growth decelerated to 3.9% annually. This performance was similar to its total revenue.
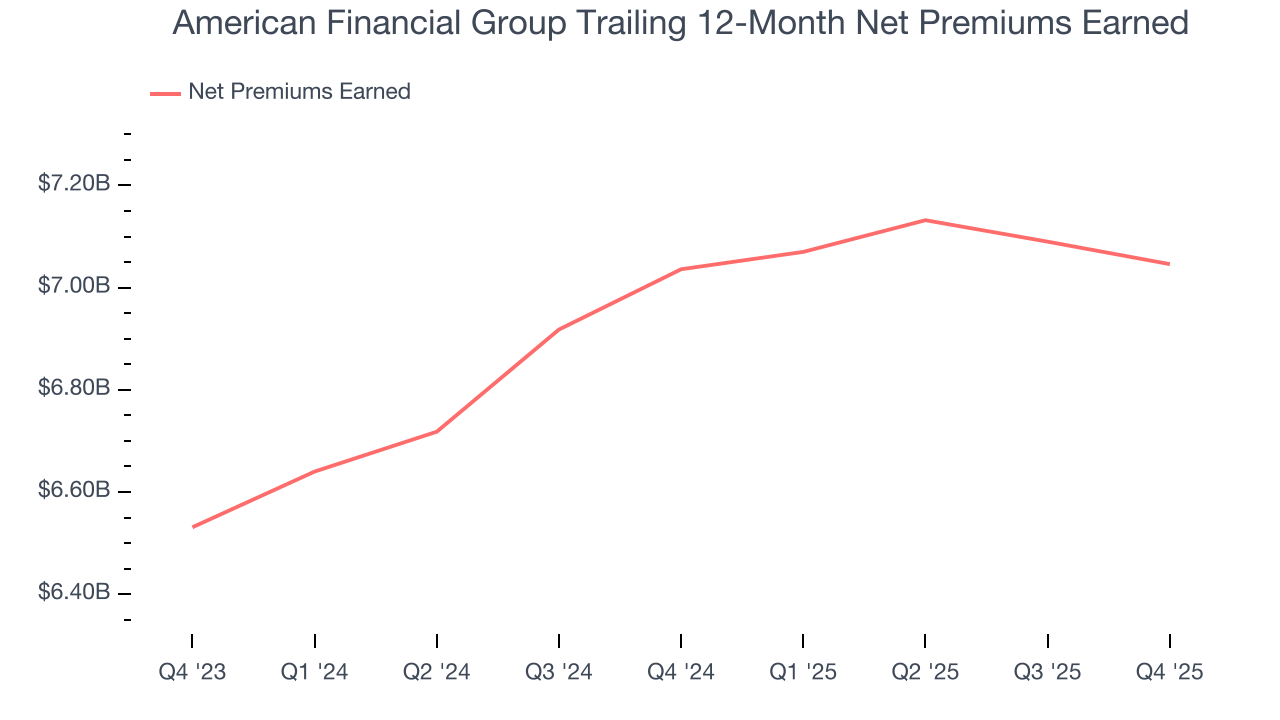
In Q4, American Financial Group produced $1.81 billion of net premiums earned, down 2.4% year on year and short of Wall Street Consensus estimates.
7. Pre-Tax Profit Margin
Revenue growth is one major determinant of business quality, and the efficiency of operations is another. For insurance companies, we look at pre-tax profit rather than the operating margin that defines sectors such as consumer, tech, and industrials.
Insurance companies are balance sheet businesses, where assets and liabilities define the economics. Interest income and expense should therefore be factored into the definition of profit but taxes - which are largely out of a company’s control - should not. This is pre-tax profit by definition.
Over the last five years, American Financial Group’s pre-tax profit margin has fallen by 7.5 percentage points, going from 22% to 13.9%. However, fixed cost leverage was muted more recently as the company’s pre-tax profit margin was flat on a two-year basis.
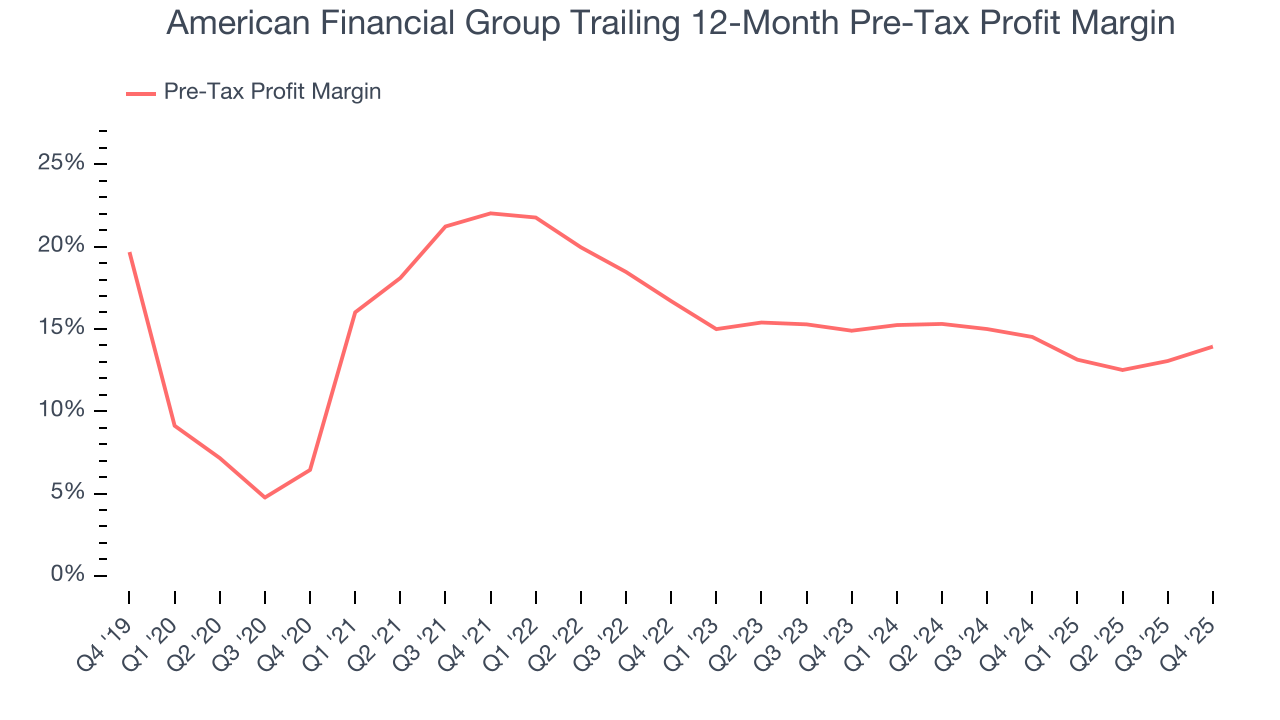
In Q4, American Financial Group’s pre-tax profit margin was 19.3%. This result was 3.5 percentage points better than the same quarter last year.
8. Earnings Per Share
Revenue trends explain a company’s historical growth, but the long-term change in earnings per share (EPS) points to the profitability of that growth – for example, a company could inflate its sales through excessive spending on advertising and promotions.
American Financial Group’s EPS grew at a weak 4% compounded annual growth rate over the last five years, lower than its 8.2% annualized revenue growth. However, its combined ratio didn’t change during this time, telling us that non-fundamental factors such as interest and taxes affected its ultimate earnings.
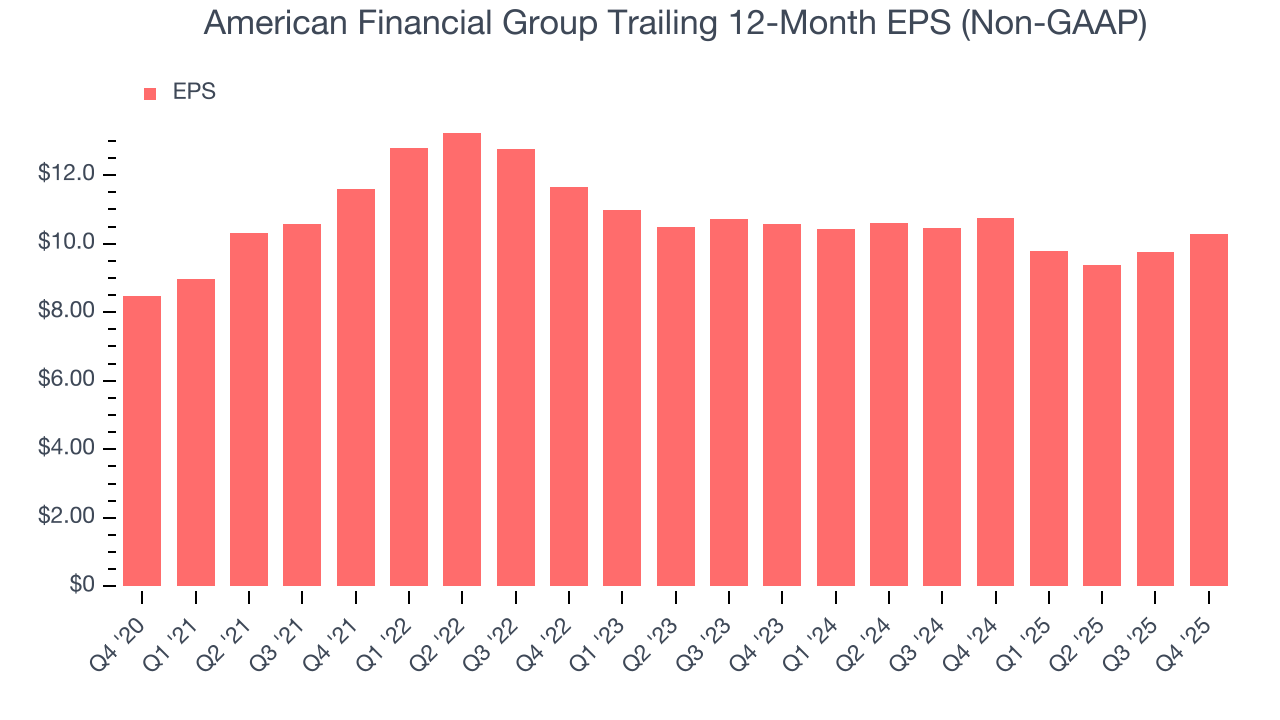
Like with revenue, we analyze EPS over a more recent period because it can provide insight into an emerging theme or development for the business.
For American Financial Group, its two-year annual EPS declines of 1.3% show it’s continued to underperform. These results were bad no matter how you slice the data.
In Q4, American Financial Group reported adjusted EPS of $3.65, up from $3.12 in the same quarter last year. This print easily cleared analysts’ estimates, and shareholders should be content with the results. Over the next 12 months, Wall Street expects American Financial Group’s full-year EPS of $10.29 to grow 11.9%.
9. Book Value Per Share (BVPS)
Insurers are balance sheet businesses, collecting premiums upfront and paying out claims over time. Premiums collected but not yet paid out, often referred to as the float, are invested and create an asset base supported by a liability structure. Book value per share (BVPS) captures this dynamic by measuring these assets (investment portfolio, cash, reinsurance recoverables) less liabilities (claim reserves, debt, future policy benefits). BVPS is essentially the residual value for shareholders.
We therefore consider BVPS very important to track for insurers and a metric that sheds light on business quality. While other (and more commonly known) per-share metrics like EPS can sometimes be lumpy due to reserve releases or one-time items and can be managed or skewed while still following accounting rules, BVPS reflects long-term capital growth and is harder to manipulate.
American Financial Group’s BVPS declined at a 6% annual clip over the last five years. However, BVPS growth has accelerated recently, growing by 6.5% annually over the last two years from $50.91 to $57.78 per share.

Over the next 12 months, Consensus estimates call for American Financial Group’s BVPS to grow by 9.3% to $57.44, mediocre growth rate.
10. Balance Sheet Assessment
The debt-to-equity ratio is a widely used measure to assess a company's balance sheet health. A higher ratio means that a business aggressively financed its growth with debt. This can result in higher earnings (if the borrowed funds are invested profitably) but also increases risk.
If debt levels are too high, there could be difficulties in meeting obligations, especially during economic downturns or periods of rising interest rates if the debt has variable-rate payments.
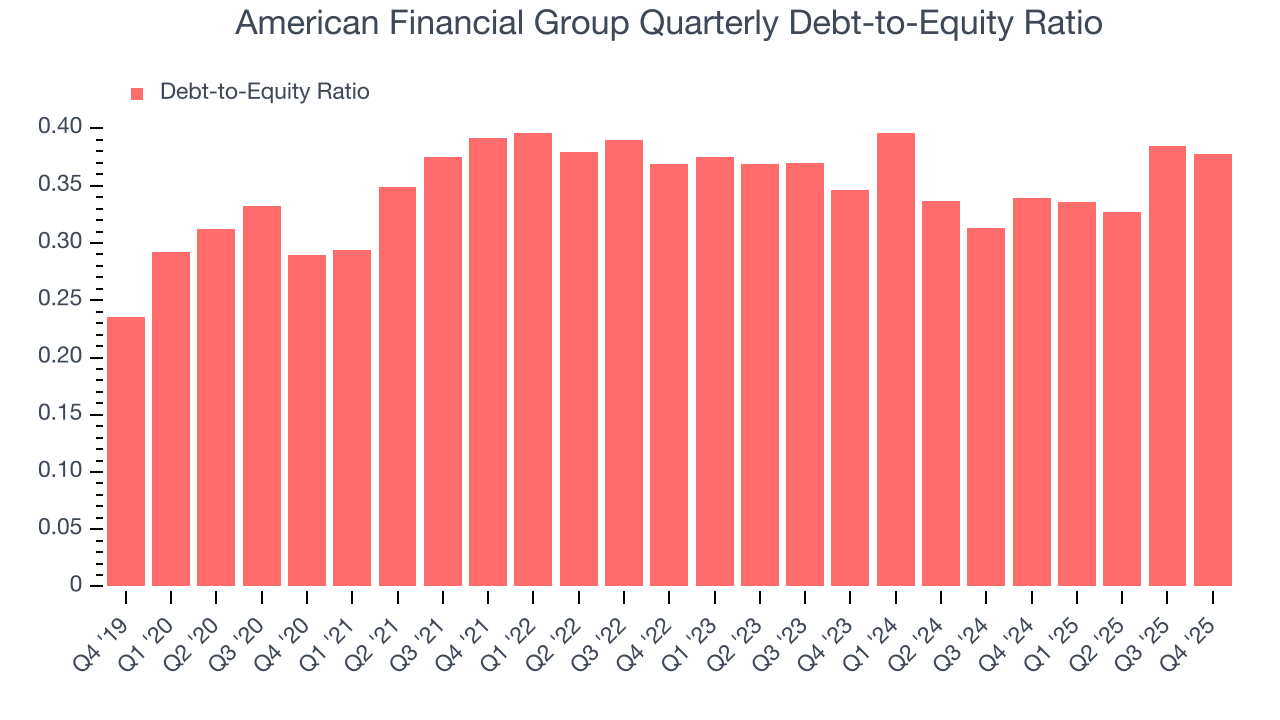
American Financial Group currently has $1.82 billion of debt and $4.82 billion of shareholder's equity on its balance sheet, and over the past four quarters, has averaged a debt-to-equity ratio of 0.4×. We think this is safe and raises no red flags. In general, we’re comfortable with any ratio below 1.0× for an insurance business. Anything below 0.5× is a bonus.
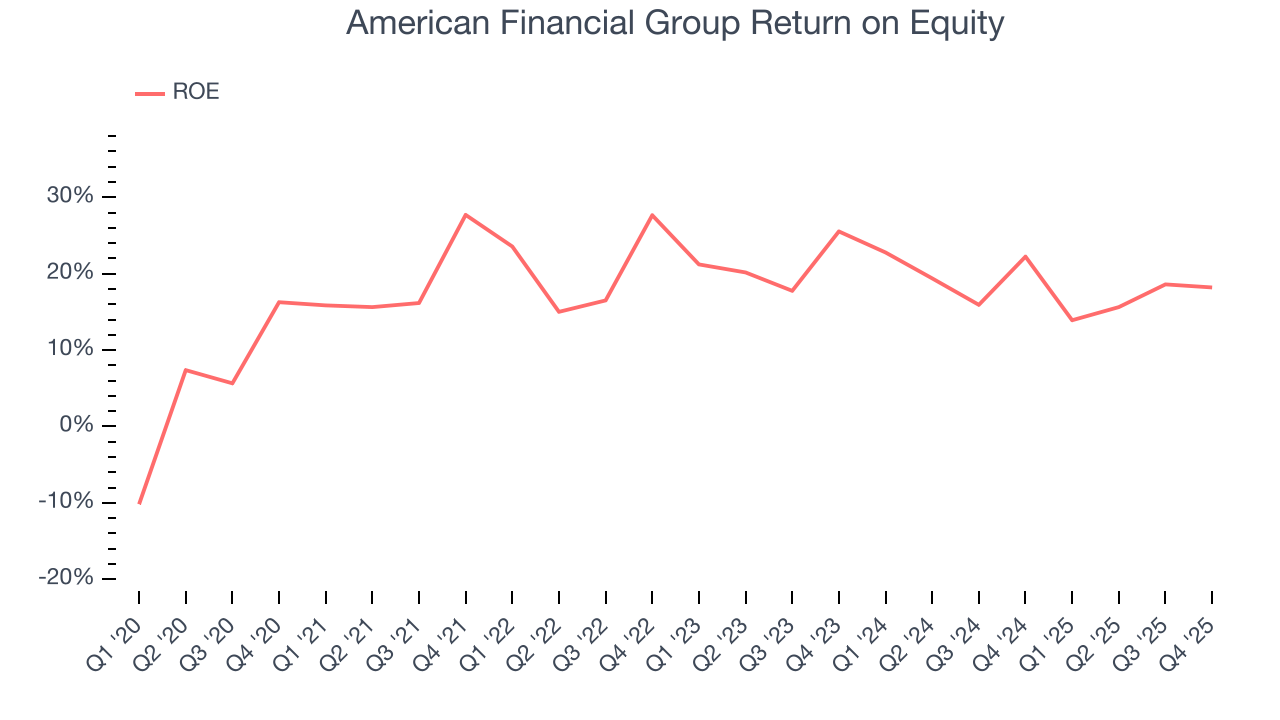
11. Return on Equity
Return on equity (ROE) is a crucial yardstick for insurance companies, measuring their ability to generate returns on the capital provided by shareholders. Insurers that consistently deliver superior ROE tend to create more value for their investors over time through strategic capital allocation and shareholder-friendly policies.
Over the last five years, American Financial Group has averaged an ROE of 19.5%, exceptional for a company operating in a sector where the average shakes out around 12.5% and those putting up 20%+ are greatly admired. This is a bright spot for American Financial Group.
12. Key Takeaways from American Financial Group’s Q4 Results
We enjoyed seeing American Financial Group beat analysts’ revenue expectations this quarter. We were also glad its EPS outperformed Wall Street’s estimates. On the other hand, its net premiums earned slightly missed. Overall, this print had some key positives. The market seemed to be hoping for more, and the stock traded down 1.9% to $127.80 immediately following the results.
13. Is Now The Time To Buy American Financial Group?
Updated: March 24, 2026 at 12:32 AM EDT
Are you wondering whether to buy American Financial Group or pass? We urge investors to not only consider the latest earnings results but also longer-term business quality and valuation as well.
American Financial Group falls short of our quality standards. Although its revenue growth was decent over the last five years, it’s expected to deteriorate over the next 12 months and its BVPS has declined over the last five years. And while the company’s stellar ROE suggests it has been a well-run company historically, the downside is its weak EPS growth over the last five years shows it’s failed to produce meaningful profits for shareholders.
American Financial Group’s P/B ratio based on the next 12 months is 2x. At this valuation, there’s a lot of good news priced in - we think other companies feature superior fundamentals at the moment.
Wall Street analysts have a consensus one-year price target of $140.50 on the company (compared to the current share price of $127.34).