
Assured Guaranty (AGO)
Assured Guaranty is up against the odds. Not only are its sales cratering but also its low returns on capital suggest it struggles to generate profits.― StockStory Analyst Team
1. News


2. Summary
Why We Think Assured Guaranty Will Underperform
Serving as a financial safety net for over $11 trillion in debt service payments since its founding in 2003, Assured Guaranty (NYSE:AGO) provides credit protection products that guarantee scheduled payments on municipal bonds, infrastructure projects, and structured finance obligations.
- Sales stagnated over the last five years and signal the need for new growth strategies
- Projected sales decline of 20% over the next 12 months indicates demand will continue deteriorating
- Net premiums earned contracted by 3.6% annually over the last five years, showing unfavorable market dynamics this cycle


Assured Guaranty doesn’t live up to our standards. There are superior stocks for sale in the market.
Why There Are Better Opportunities Than Assured Guaranty


At $83.24 per share, Assured Guaranty trades at 0.7x forward P/B. This sure is a cheap multiple, but you get what you pay for.
Cheap stocks can look like a great deal at first glance, but they can be value traps. They often have less earnings power, meaning there is more reliance on a re-rating to generate good returns - an unlikely scenario for low-quality companies.
3. Assured Guaranty (AGO) Research Report: Q3 CY2025 Update
Financial guaranty insurer Assured Guaranty (NYSE:AGO) reported Q3 CY2025 results topping the market’s revenue expectations, but sales fell by 23% year on year to $207 million. Its non-GAAP profit of $2.57 per share was 67.2% above analysts’ consensus estimates.
Assured Guaranty (AGO) Q3 CY2025 Highlights:
Company Overview
Serving as a financial safety net for over $11 trillion in debt service payments since its founding in 2003, Assured Guaranty (NYSE:AGO) provides credit protection products that guarantee scheduled payments on municipal bonds, infrastructure projects, and structured finance obligations.
Assured Guaranty operates primarily through its insurance subsidiaries, which apply their credit underwriting expertise to offer financial guaranty insurance. This insurance serves as a safety net for bondholders—if an issuer fails to make scheduled principal or interest payments, Assured Guaranty steps in to cover the shortfall. This protection benefits both issuers and investors: issuers can often achieve lower borrowing costs, while investors gain certainty that they'll receive promised payments.
The company's business spans several key markets. In U.S. public finance, Assured Guaranty insures various municipal obligations including general obligation bonds, tax-backed bonds, utility bonds, transportation infrastructure, healthcare facilities, and higher education institutions. Its non-U.S. business focuses on infrastructure projects, regulated utilities, and renewable energy facilities, with significant operations in the United Kingdom and Europe.
For example, when a municipality issues bonds to finance a new water treatment facility, Assured Guaranty might guarantee those bonds, enabling the municipality to secure better financing terms while providing investors with peace of mind. Similarly, when a public-private partnership develops a toll road, Assured Guaranty's guarantee can make the project's bonds more marketable.
The company generates revenue primarily through insurance premiums, which it collects upfront but recognizes over the life of the insured obligations. It invests these premiums in a portfolio of fixed-income securities and alternative investments to support future claims-paying obligations. Since July 2023, Assured Guaranty has also participated in asset management through its ownership interest in Sound Point Capital Management, which manages credit strategies including collateralized loan obligations and various credit funds.
4. Property & Casualty Insurance
Property & Casualty (P&C) insurers protect individuals and businesses against financial loss from damage to property or from legal liability. This is a cyclical industry, and the sector benefits when there is 'hard market', characterized by strong premium rate increases that outpace loss and cost inflation, resulting in robust underwriting margins. The opposite is true in a 'soft market'. Interest rates also matter, as they determine the yields earned on fixed-income portfolios. On the other hand, P&C insurers face a major secular headwind from the increasing frequency and severity of catastrophe losses due to climate change. Furthermore, the liability side of the business is pressured by 'social inflation'—the trend of rising litigation costs and larger jury awards.
Assured Guaranty's primary competitor in the U.S. public finance financial guaranty business is Build America Mutual Assurance Company (BAM), a mutual insurance company that began operations in 2012. In the broader financial services sector, Assured Guaranty also competes with large bond insurers and financial institutions that provide credit enhancement products.
5. Revenue Growth
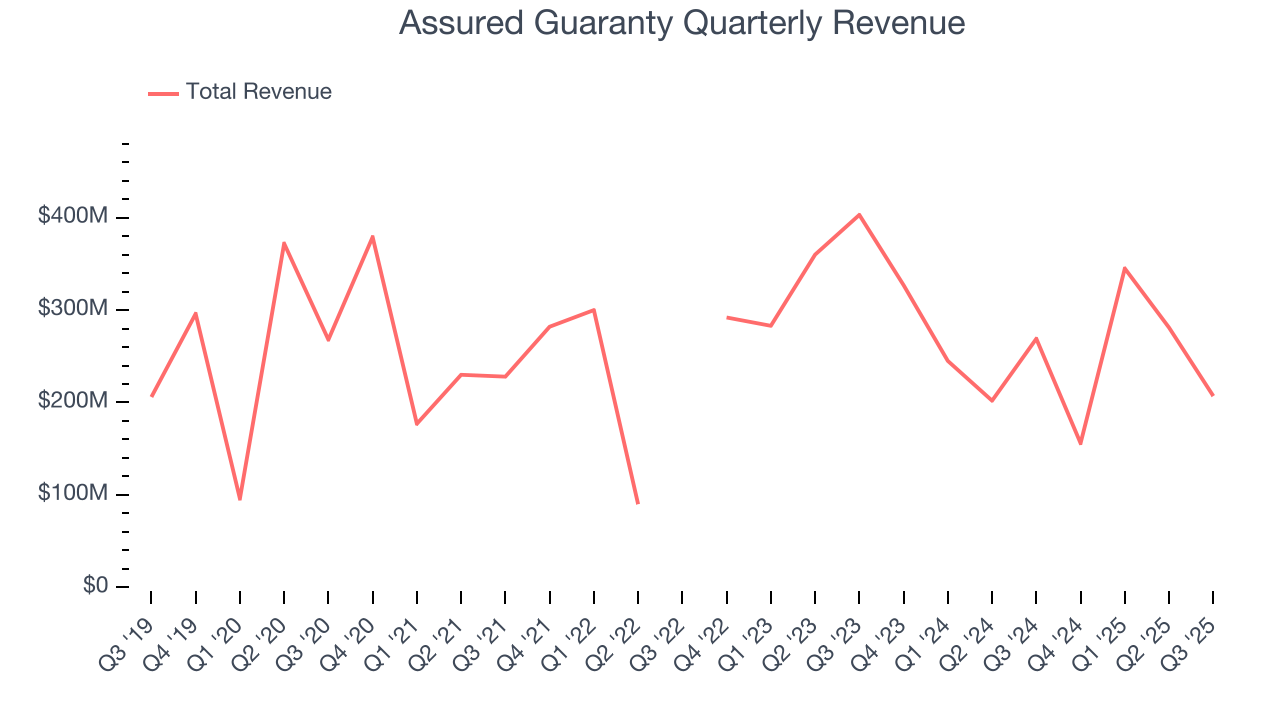
Insurance companies earn revenue from three primary sources: 1) The core insurance business itself, often called underwriting and represented in the income statement as premiums 2) Income from investing the “float” (premiums collected upfront not yet paid out as claims) in assets such as fixed-income assets and equities 3) Fees from various sources such as policy administration, annuities, or other value-added services. Unfortunately, Assured Guaranty struggled to consistently increase demand as its $989 million of revenue for the trailing 12 months was close to its revenue five years ago. This wasn’t a great result and suggests it’s a low quality business.
 Note: Quarters not shown were determined to be outliers, impacted by outsized investment gains/losses that are not indicative of the recurring fundamentals of the business.
We at StockStory place the most emphasis on long-term growth, but within financials, a half-decade historical view may miss recent interest rate changes, market returns, and industry trends. Assured Guaranty’s recent performance shows its demand remained suppressed as its revenue has declined by 14% annually over the last two years. 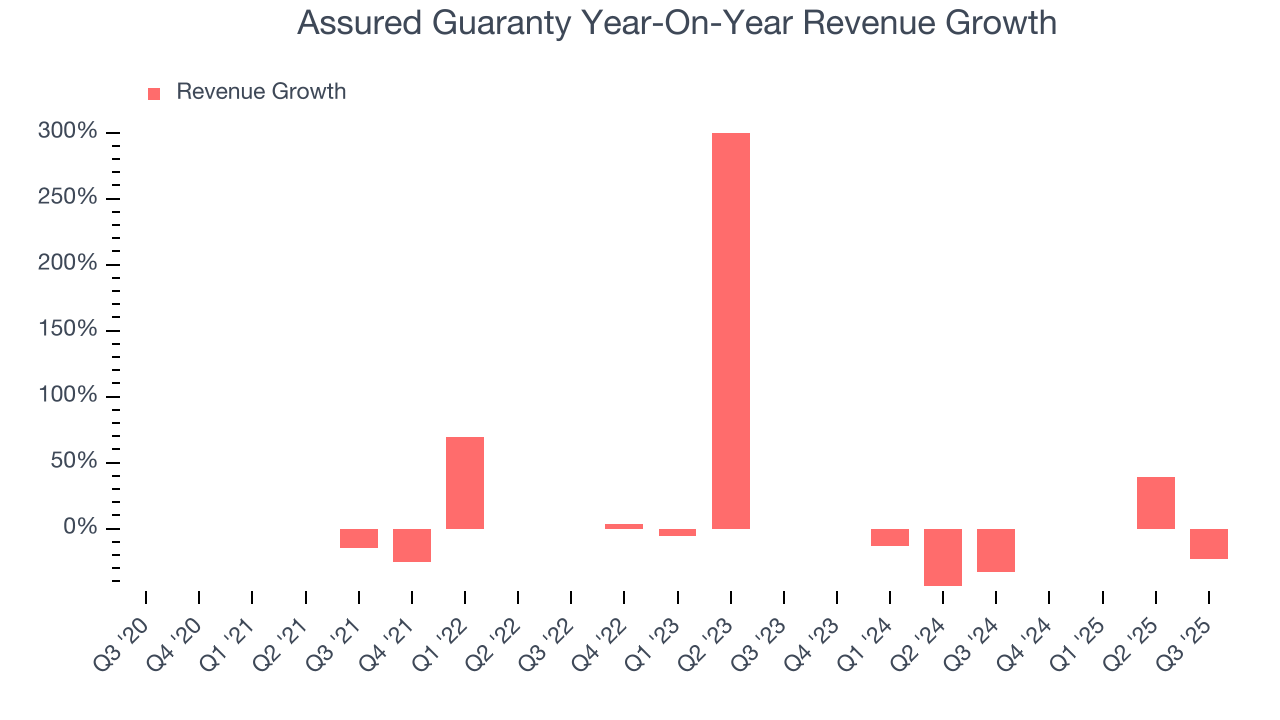 Note: Quarters not shown were determined to be outliers, impacted by outsized investment gains/losses that are not indicative of the recurring fundamentals of the business.
This quarter, Assured Guaranty’s revenue fell by 23% year on year to $207 million but beat Wall Street’s estimates by 12.2%.
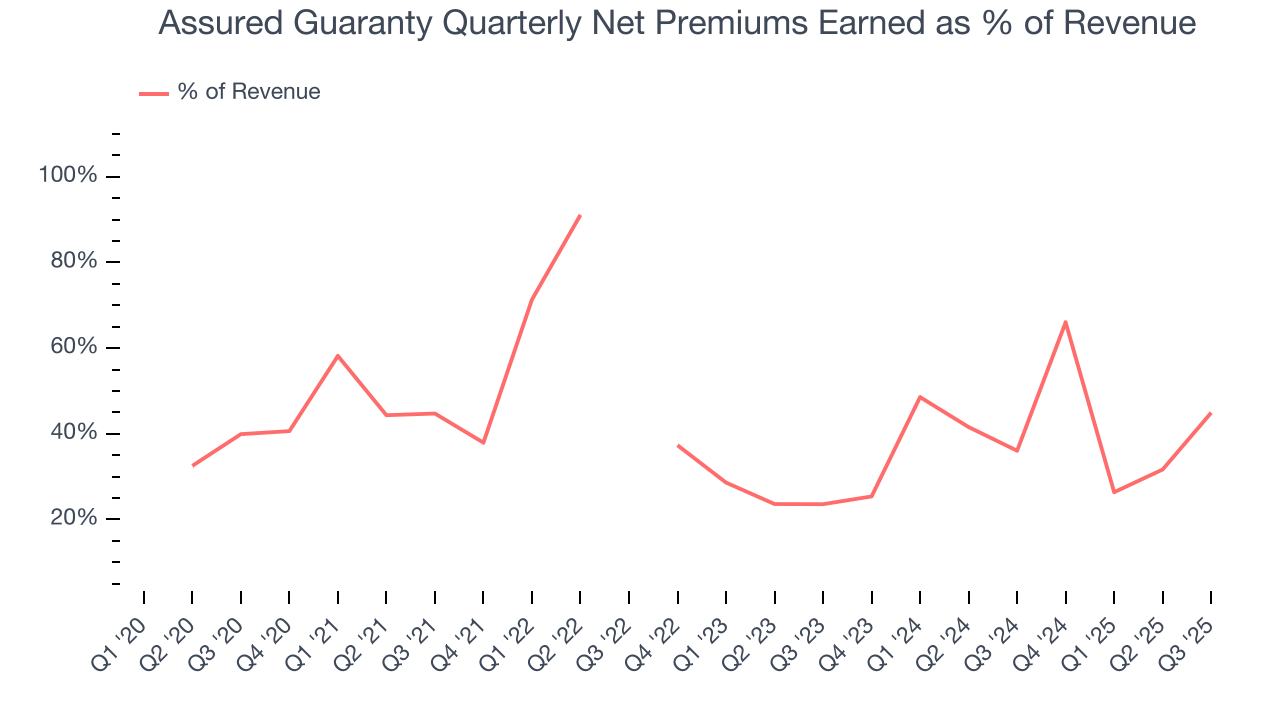
Net premiums earned made up 40.8% of the company’s total revenue during the last five years, meaning Assured Guaranty’s growth drivers strike a balance between insurance and non-insurance activities.
 Note: Quarters not shown were determined to be outliers, impacted by outsized investment gains/losses that are not indicative of the recurring fundamentals of the business.
Markets consistently prioritize net premiums earned growth over investment and fee income, recognizing its superior quality as a core indicator of the company’s underwriting success and market penetration.
6. Net Premiums Earned
When insurers sell policies, they protect themselves from extremely large losses or an outsized accumulation of losses with reinsurance (insurance for insurance companies). Net premiums earned are therefore gross premiums less what’s ceded to reinsurers as a risk mitigation and transfer strategy.
Assured Guaranty’s net premiums earned has declined by 3.8% annually over the last five years, much worse than the broader insurance industry. This shows that policy underwriting underperformed its other business lines.
When analyzing Assured Guaranty’s net premiums earned over the last two years, we can see a sliver of stabilization as income was flat. Since two-year net premiums earned outperformed total revenue over this period, it’s implied that other line items such as investment income were even bigger detractors of consolidated growth. While these additional streams certainly contribute to the bottom line, their impact can vary. Some firms have shown greater success and long-term consistency in investing their float compared to peers. However, sharp fluctuations in the fixed income and equity markets can significantly affect short-term performance.
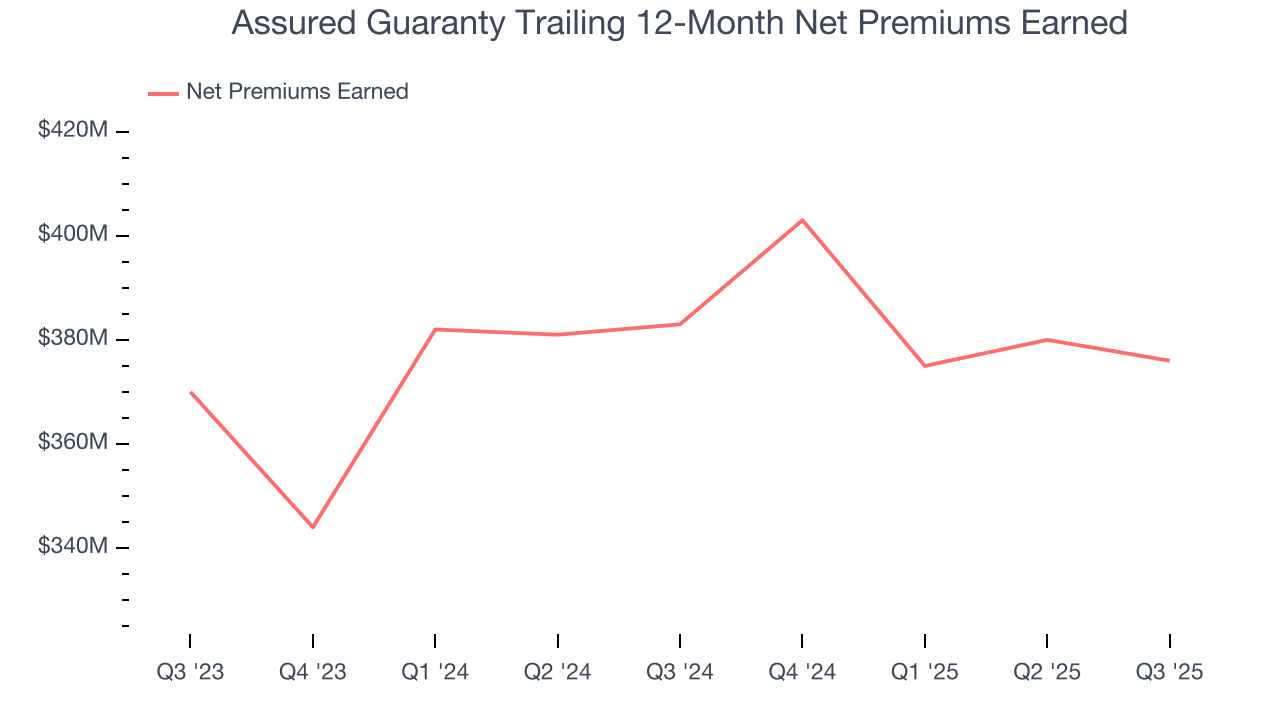
In Q3, Assured Guaranty produced $93 million of net premiums earned, down 4.1% year on year. But this was still enough to top Wall Street Consensus estimates by 1.1%.
7. Pre-Tax Profit Margin
Revenue growth is one major determinant of business quality, and the efficiency of operations is another. For insurance companies, we look at pre-tax profit rather than the operating margin that defines sectors such as consumer, tech, and industrials.
This is because insurers are balance sheet businesses, where assets and liabilities define the core economics. This means that interest income and expense should be factored into the definition of profit but taxes - which are largely out of a company’s control - should not.
Over the last four years, Assured Guaranty’s pre-tax profit margin has fallen by 21.8 percentage points, going from 31.5% to 53.3%. It has also expanded by 11.1 percentage points on a two-year basis, showing its expenses have consistently grown at a slower rate than revenue. This typically signals prudent management.
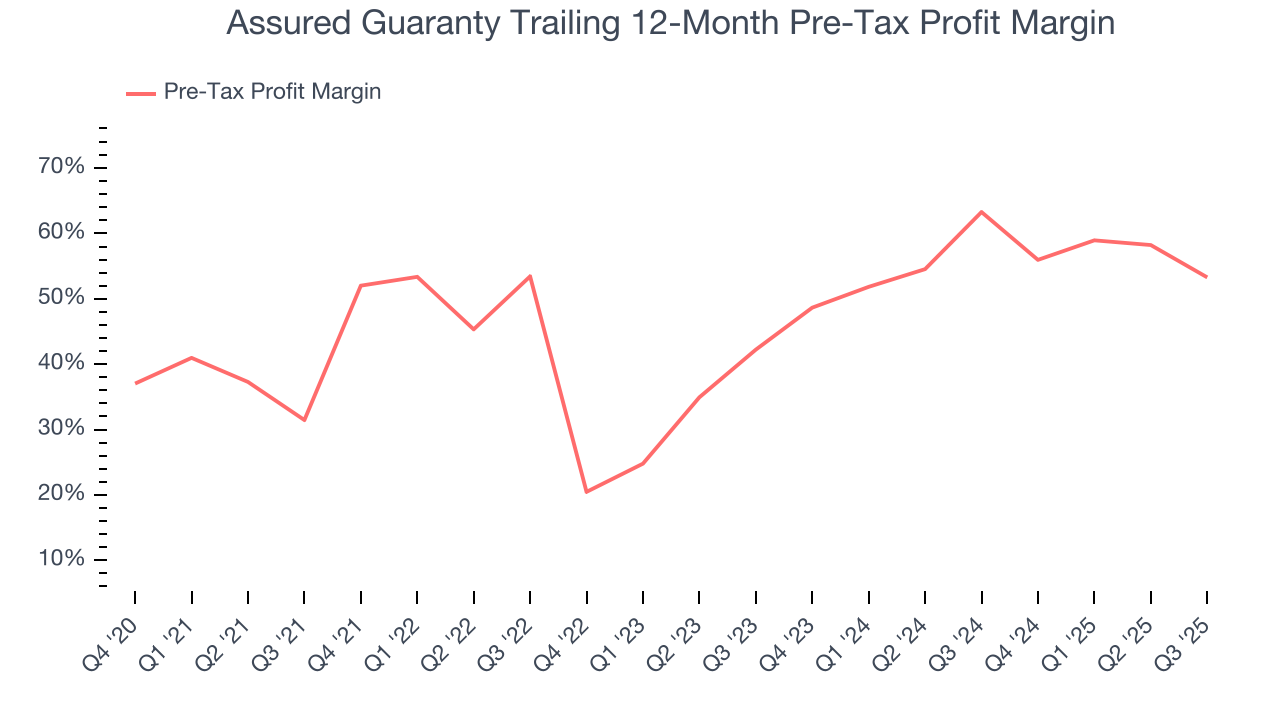
In Q3, Assured Guaranty’s pre-tax profit margin was 65.2%. This result was 16.6 percentage points worse than the same quarter last year.
8. Earnings Per Share
We track the long-term change in earnings per share (EPS) for the same reason as long-term revenue growth. Compared to revenue, however, EPS highlights whether a company’s growth is profitable.
Assured Guaranty’s EPS grew at a remarkable 20.2% compounded annual growth rate over the last five years, higher than its flat revenue. However, we take this with a grain of salt because its operating margin didn’t improve and it didn’t repurchase its shares, meaning the delta came from factors we consider non-core or less sustainable over the long term.
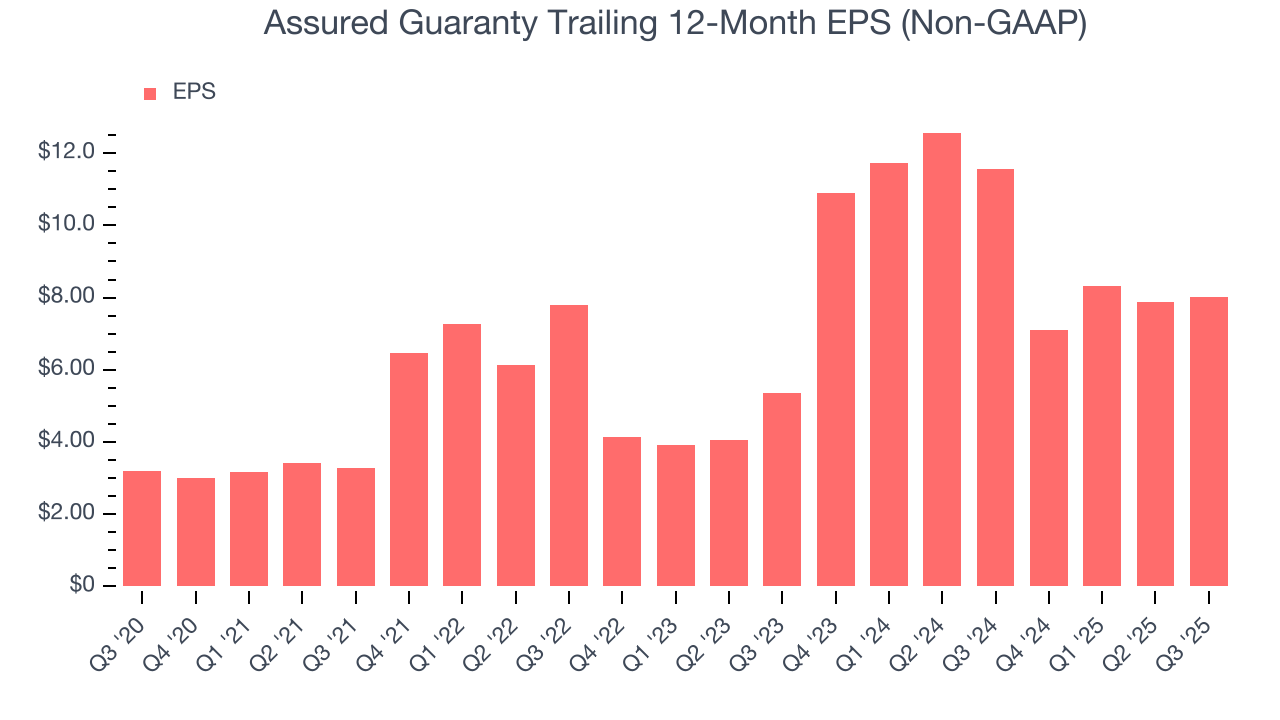
Like with revenue, we analyze EPS over a shorter period to see if we are missing a change in the business.
For Assured Guaranty, its two-year annual EPS growth of 22.4% was higher than its five-year trend. We love it when earnings growth accelerates, especially when it accelerates off an already high base.
In Q3, Assured Guaranty reported adjusted EPS of $2.57, up from $2.42 in the same quarter last year. This print easily cleared analysts’ estimates, and shareholders should be content with the results. Over the next 12 months, Wall Street expects Assured Guaranty’s full-year EPS of $8.03 to shrink by 14%.
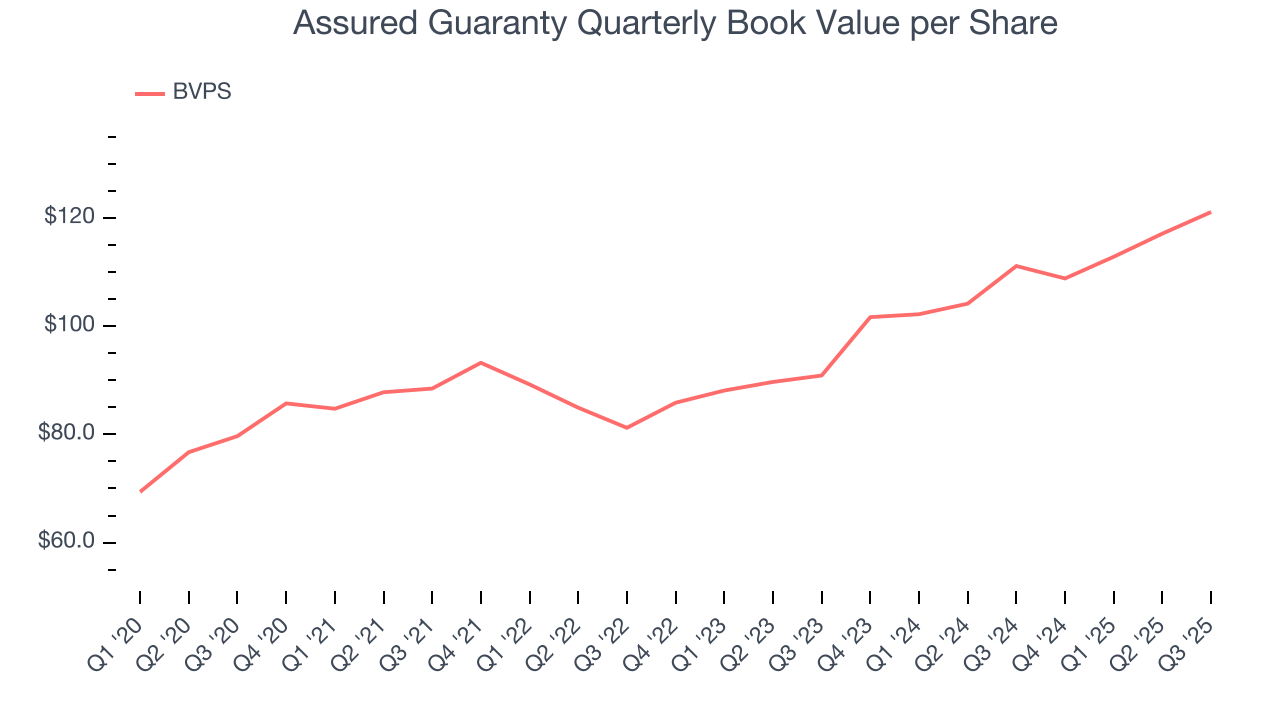
9. Book Value Per Share (BVPS)
Insurers are balance sheet businesses, collecting premiums upfront and paying out claims over time. Premiums collected but not yet paid out, often referred to as the float, are invested and create an asset base supported by a liability structure. Book value per share (BVPS) captures this dynamic by measuring these assets (investment portfolio, cash, reinsurance recoverables) less liabilities (claim reserves, debt, future policy benefits). BVPS is essentially the residual value for shareholders.
We therefore consider BVPS very important to track for insurers and a metric that sheds light on business quality. While other (and more commonly known) per-share metrics like EPS can sometimes be lumpy due to reserve releases or one-time items and can be managed or skewed while still following accounting rules, BVPS reflects long-term capital growth and is harder to manipulate.
Assured Guaranty’s BVPS grew at a decent 8.7% annual clip over the last five years. BVPS growth has accelerated recently, growing by 15.4% annually over the last two years from $90.89 to $121.13 per share.
10. Balance Sheet Assessment
The debt-to-equity ratio is a widely used measure to assess a company's balance sheet health. A higher ratio means that a business aggressively financed its growth with debt. This can result in higher earnings (if the borrowed funds are invested profitably) but also increases risk.
If debt levels are too high, there could be difficulties in meeting obligations, especially during economic downturns or periods of rising interest rates if the debt has variable-rate payments.
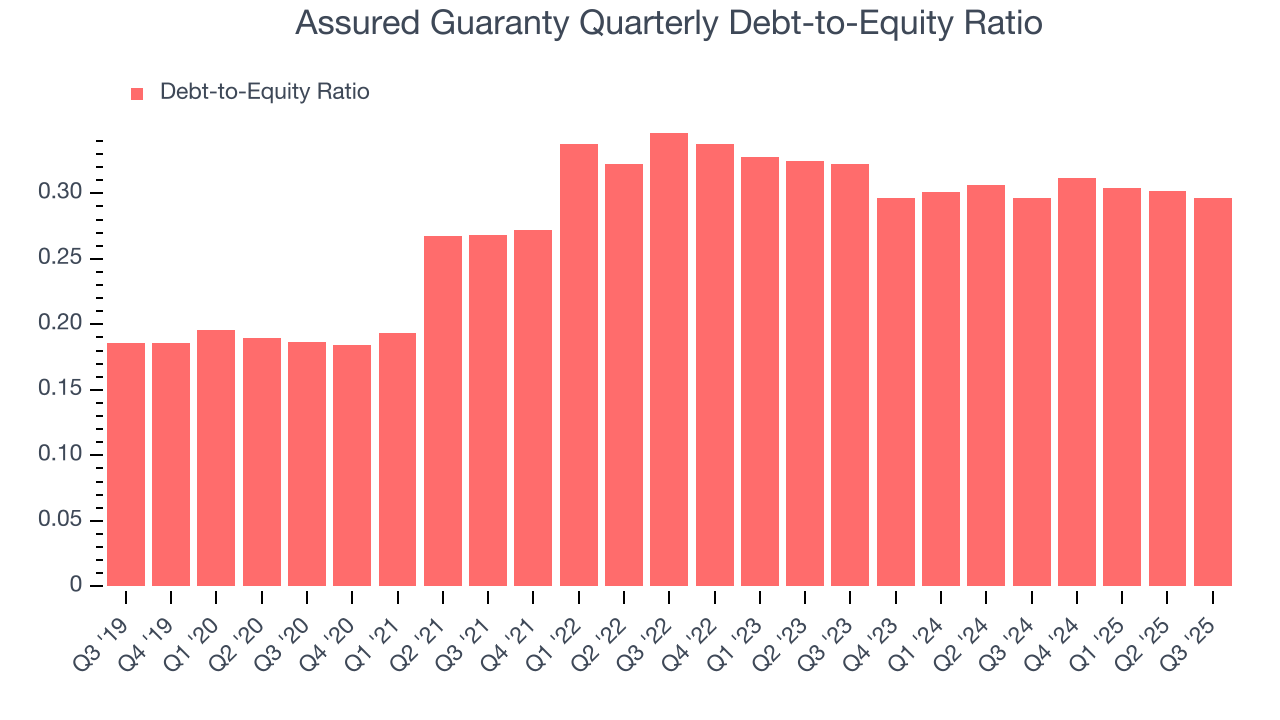
Assured Guaranty currently has $1.7 million of debt and $5.74 million of shareholder's equity on its balance sheet, and over the past four quarters, has averaged a debt-to-equity ratio of 0.3×. We think this is safe and raises no red flags. In general, we’re comfortable with any ratio below 1.0× for an insurance business. Anything below 0.5× is a bonus.
11. Return on Equity
Return on equity (ROE) is a crucial yardstick for insurance companies, measuring their ability to generate returns on the capital provided by shareholders. Insurers that consistently deliver superior ROE tend to create more value for their investors over time through strategic capital allocation and shareholder-friendly policies.
Over the last five years, Assured Guaranty has averaged an ROE of 7.8%, uninspiring for a company operating in a sector where the average shakes out around 12.5%.
12. Key Takeaways from Assured Guaranty’s Q3 Results
It was good to see Assured Guaranty beat analysts’ EPS expectations this quarter. We were also excited its revenue outperformed Wall Street’s estimates by a wide margin. Zooming out, we think this was a good print with some key areas of upside. The stock remained flat at $80.75 immediately after reporting.
13. Is Now The Time To Buy Assured Guaranty?
Updated: January 23, 2026 at 11:40 PM EST
The latest quarterly earnings matters, sure, but we actually think longer-term fundamentals and valuation matter more. Investors should consider all these pieces before deciding whether or not to invest in Assured Guaranty.
Assured Guaranty doesn’t pass our quality test. For starters, its revenue growth was weak over the last five years, and analysts expect its demand to deteriorate over the next 12 months. And while its expanding pre-tax profit margin shows the business has become more efficient, the downside is its projected EPS for the next year is lacking. On top of that, its net premiums earned has declined over the last five years.
Assured Guaranty’s P/B ratio based on the next 12 months is 0.7x. While this valuation is optically cheap, the potential downside is huge given its shaky fundamentals. There are better stocks to buy right now.
Wall Street analysts have a consensus one-year price target of $107 on the company (compared to the current share price of $83.24).
Although the price target is bullish, readers should exercise caution because analysts tend to be overly optimistic. The firms they work for, often big banks, have relationships with companies that extend into fundraising, M&A advisory, and other rewarding business lines. As a result, they typically hesitate to say bad things for fear they will lose out. We at StockStory do not suffer from such conflicts of interest, so we’ll always tell it like it is.