
AIG (AIG)
AIG faces an uphill battle. Not only are its sales cratering but also its low returns on capital suggest it struggles to generate profits.― StockStory Analyst Team
1. News
2. Summary
Why We Think AIG Will Underperform
With roots dating back to 1919 when it began as a small insurance agency in Shanghai, China, AIG (NYSE:AIG) is a global insurance organization that provides commercial and personal insurance solutions to businesses and individuals across more than 200 countries.
- Products and services are facing significant end-market challenges during this cycle as sales have declined by 9.5% annually over the last five years
- Earnings growth over the last two years fell short of the peer group average as its EPS only increased by 2.6% annually
- Net premiums earned contracted by 5.5% annually over the last five years, showing unfavorable market dynamics this cycle


AIG’s quality doesn’t meet our expectations. We believe there are better opportunities elsewhere.
Why There Are Better Opportunities Than AIG


At $77.38 per share, AIG trades at 0.9x forward P/B. This multiple is lower than most insurance companies, but for good reason.
We’d rather pay up for companies with elite fundamentals than get a bargain on weak ones. Cheap stocks can be value traps, and as their performance deteriorates, they will stay cheap or get even cheaper.
3. AIG (AIG) Research Report: Q4 CY2025 Update
Global insurance giant AIG (NYSE:AIG) missed Wall Street’s revenue expectations in Q4 CY2025, with sales falling 1.4% year on year to $6.76 billion. Its non-GAAP profit of $1.96 per share was 3% above analysts’ consensus estimates.
AIG (AIG) Q4 CY2025 Highlights:
- Revenue: $6.76 billion vs analyst estimates of $6.92 billion (1.4% year-on-year decline, 2.3% miss)
- Combined Ratio: 88.8% vs analyst estimates of 90.4% (161.7 basis point beat)
- Adjusted EPS: $1.96 vs analyst estimates of $1.90 (3% beat)
- Book Value per Share: $76.06 vs analyst estimates of $83.28 (8.4% year-on-year growth, 8.7% miss)
- Market Capitalization: $40.47 billion
Company Overview
With roots dating back to 1919 when it began as a small insurance agency in Shanghai, China, AIG (NYSE:AIG) is a global insurance organization that provides commercial and personal insurance solutions to businesses and individuals across more than 200 countries.
AIG operates through three main segments: North America Commercial, International Commercial, and Global Personal Insurance. The company's General Insurance division offers a comprehensive range of products including property insurance that protects against business interruption and natural disasters; casualty coverage that includes general liability and workers' compensation; financial lines products like directors and officers insurance and cyber risk protection; and specialty insurance covering marine, aviation, and political risks.
For example, a multinational corporation might use AIG's commercial property insurance to protect its manufacturing facilities worldwide against fire damage, while simultaneously relying on the company's directors and officers coverage to shield its executives from liability claims. Meanwhile, a high-net-worth individual might purchase a comprehensive personal insurance package that protects their homes, vehicles, art collections, and provides worldwide travel coverage.
AIG generates revenue primarily through insurance premiums paid by its diverse customer base, which ranges from individual consumers to Fortune 500 companies. The company distributes its products through multiple channels including independent agents, brokers, affinity partners, and direct-to-consumer platforms. Its global infrastructure enables it to write complex multinational policies that cover risks across borders—a capability particularly valuable to international businesses seeking consolidated insurance solutions.
The company maintains a disciplined underwriting approach, focusing on portfolio optimization and strategic partnerships with reinsurers to manage exposure to catastrophic events and large individual losses.
4. Multi-Line Insurance
Multi-line insurance companies operate a diversified business model, offering a broad suite of products that span both Property & Casualty (P&C) and Life & Health (L&H) insurance. This diversification allows them to generate revenue from multiple, often uncorrelated, underwriting pools while also earning investment income on their combined float. Interest rates matter for the sector (and make it cyclical), with higher rates allowing insurers to reinvest their fixed-income portfolios at more attractive yields and vice versa. The market environment also matters for P&C operations specifically, with a 'hard market' characterized by pricing increases that outstrip claim costs, resulting in higher profits while a 'soft market' is the opposite. On the other hand, a key headwind is increasing volatility and severity of catastrophe losses, driven by climate change, which poses a significant threat to P&C underwriting results.
AIG competes with other global insurance and financial services companies including Chubb Limited (NYSE:CB), The Travelers Companies (NYSE:TRV), Allianz SE (ETR:ALV), and Zurich Insurance Group (SWX:ZURN).
5. Revenue Growth
Insurance companies generate revenue three ways. The first is the core insurance business itself, represented in the income statement as premiums earned. The second source is investment income from investing the “float” (premiums collected but not yet paid out as claims) in assets such as fixed-income assets and equities. The third is fees from policy administration, annuities, and other value-added services. Over the last five years, AIG’s demand was weak and its revenue declined by 9.6% per year. This wasn’t a great result and is a sign of poor business quality.
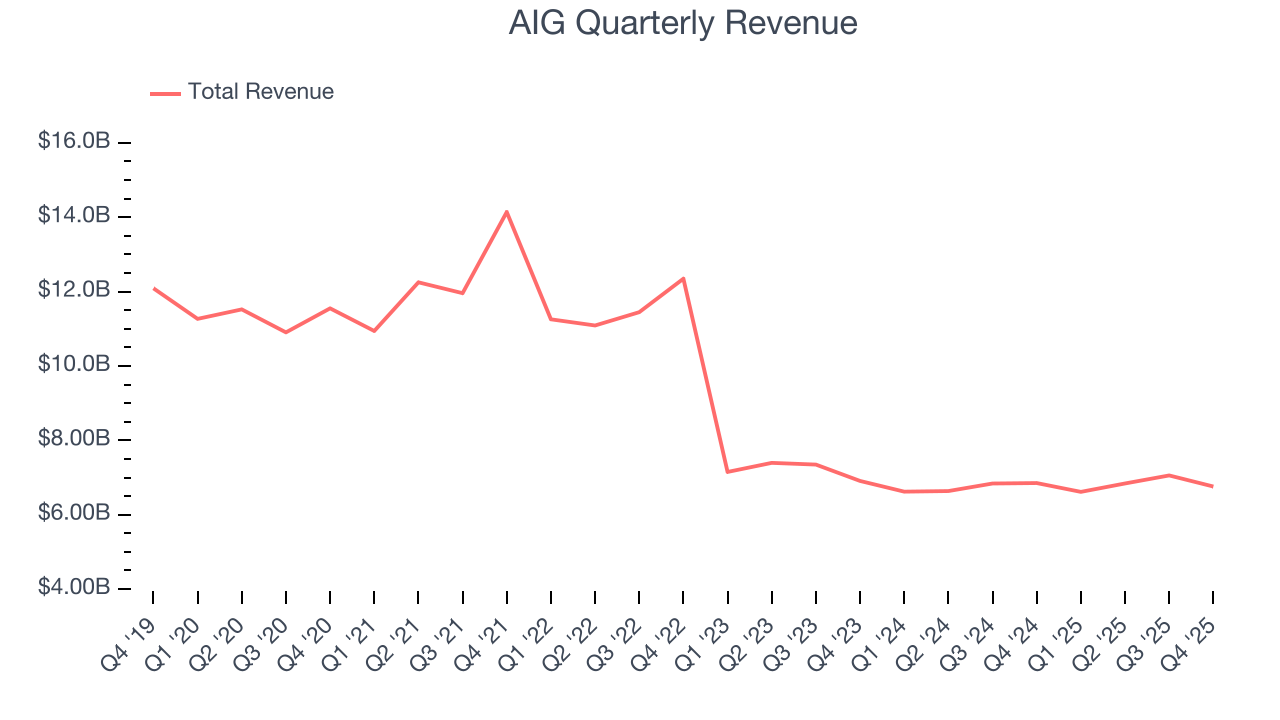
We at StockStory place the most emphasis on long-term growth, but within financials, a half-decade historical view may miss recent interest rate changes, market returns, and industry trends. AIG’s annualized revenue declines of 2.7% over the last two years suggest its demand continued shrinking. 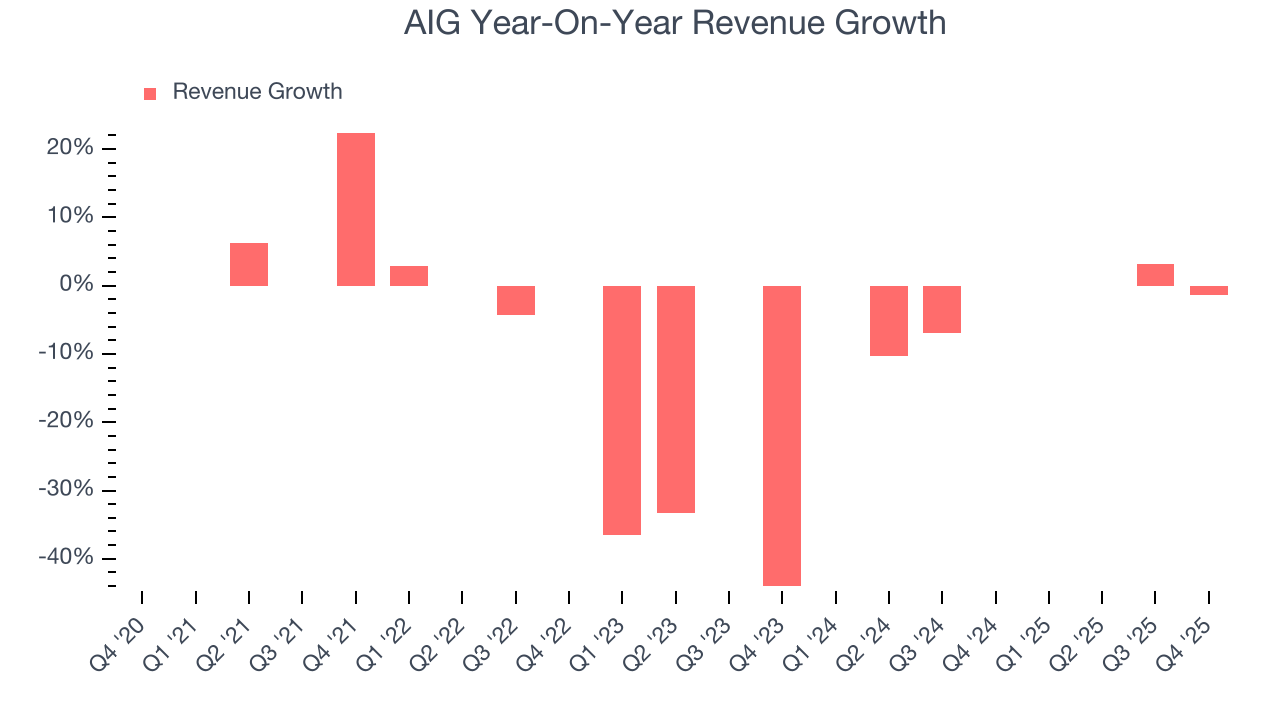 Note: Quarters not shown were determined to be outliers, impacted by outsized investment gains/losses that are not indicative of the recurring fundamentals of the business.
This quarter, AIG missed Wall Street’s estimates and reported a rather uninspiring 1.4% year-on-year revenue decline, generating $6.76 billion of revenue.
Net premiums earned made up 65.7% of the company’s total revenue during the last five years, meaning insurance operations are AIG’s largest source of revenue.
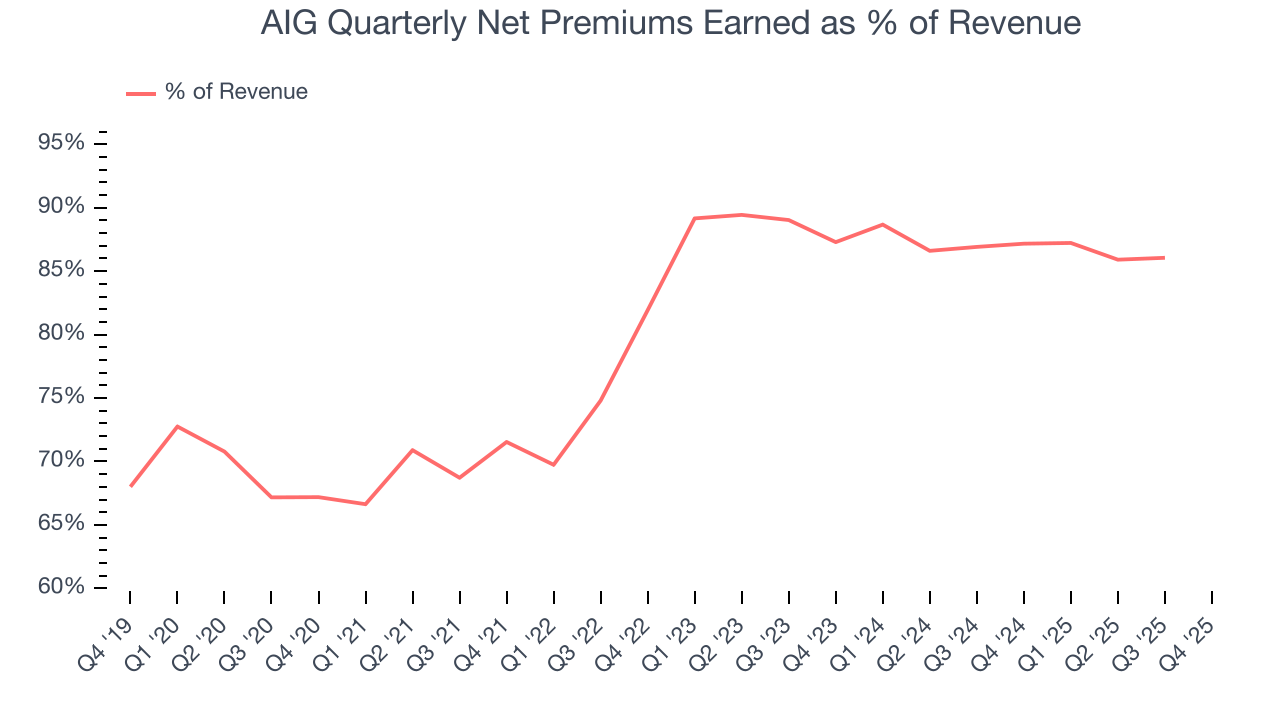 Note: Quarters not shown were determined to be outliers, impacted by outsized investment gains/losses that are not indicative of the recurring fundamentals of the business.
While insurers generate revenue from multiple sources, investors view net premiums earned as the cornerstone - its direct link to core operations stands in sharp contrast to the unpredictability of investment returns and fees.
6. Net Premiums Earned
When insurers sell policies, they protect themselves from extremely large losses or an outsized accumulation of losses with reinsurance (insurance for insurance companies). Net premiums earned are:
- Gross premiums - what’s ceded to reinsurers as a risk mitigation and transfer strategy
AIG’s net premiums earned has declined by 5.5% annually over the last five years, much worse than the broader insurance industry. A silver lining is that policy underwriting outperformed its other business lines.
When analyzing AIG’s net premiums earned over the last two years, we can see that income dropped by 3.6% annually. This performance was similar to its total revenue.
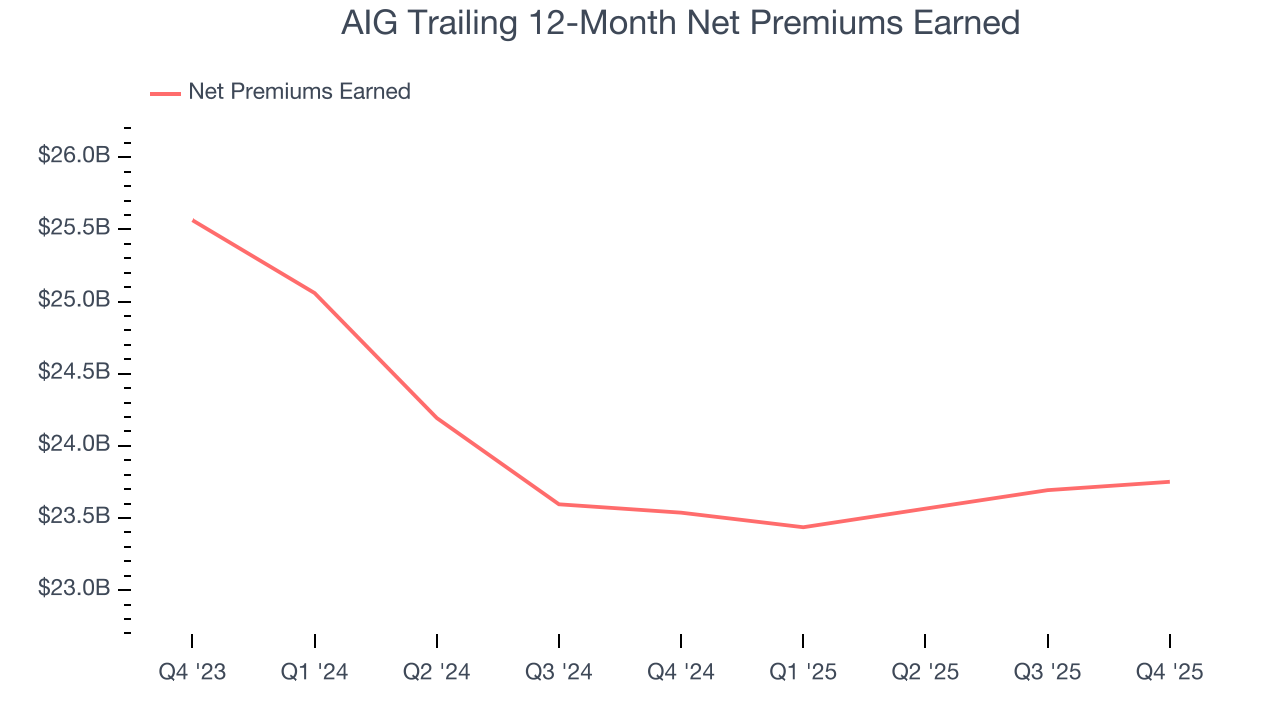
This quarter, AIG’s net premiums earned was $6.03 billion, flat year on year. But this was still enough to top Wall Street Consensus estimates by 1.2%.
7. Pre-Tax Profit Margin
Revenue growth is one major determinant of business quality, and the efficiency of operations is another. For insurance companies, we look at pre-tax profit rather than the operating margin that defines sectors such as consumer, tech, and industrials.
The economics of insurers are driven by their balance sheets, where assets (investing the float + premiums receivable) and liabilities (claims to pay) define the fundamentals. Interest income and expense should therefore be factored into the definition of profit but taxes - which are largely out of a company’s control - should not.
Over the last five years, AIG’s pre-tax profit margin has fallen by 30.3 percentage points, going from 24.5% to 14.2%. It has also expanded by 4.3 percentage points on a two-year basis, showing its expenses have consistently grown at a slower rate than revenue. This typically signals prudent management.
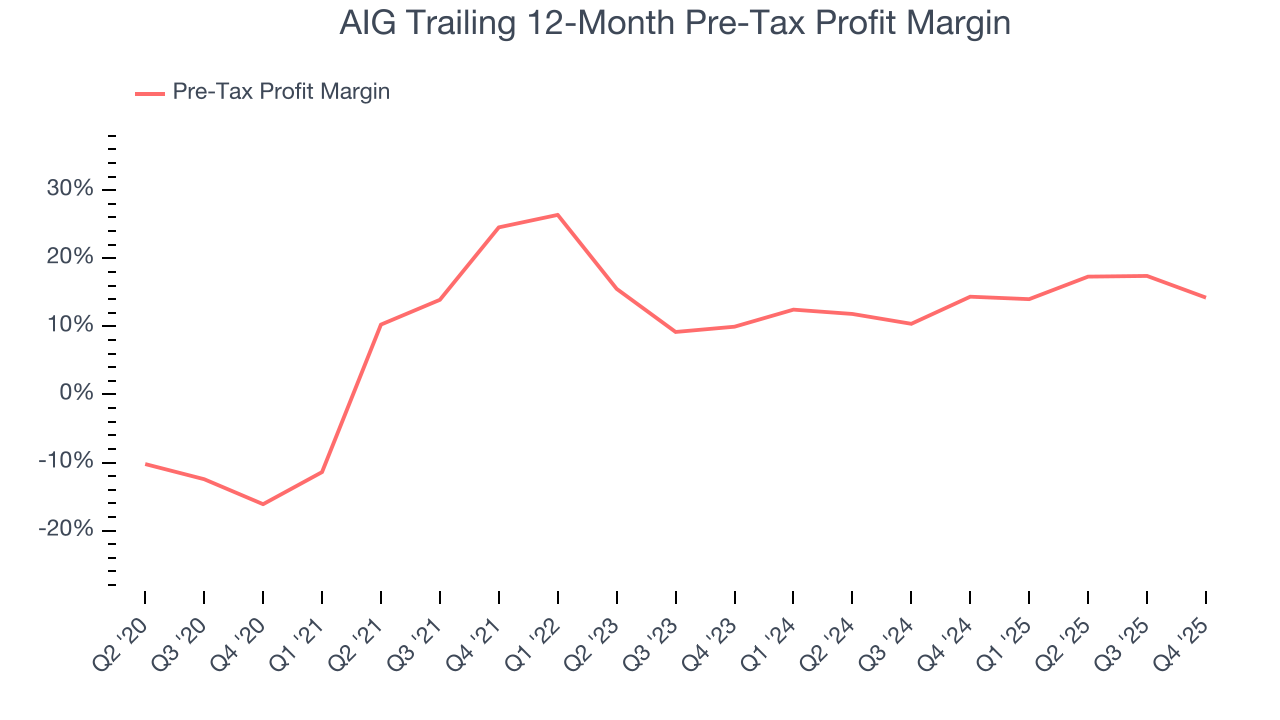
AIG’s pre-tax profit margin came in at 9.8% this quarter. This result was 12.8 percentage points worse than the same quarter last year.
8. Earnings Per Share
Revenue trends explain a company’s historical growth, but the long-term change in earnings per share (EPS) points to the profitability of that growth – for example, a company could inflate its sales through excessive spending on advertising and promotions.
AIG’s EPS grew at a spectacular 23.2% compounded annual growth rate over the last five years, higher than its 9.6% annualized revenue declines. This tells us management adapted its cost structure in response to a challenging demand environment.
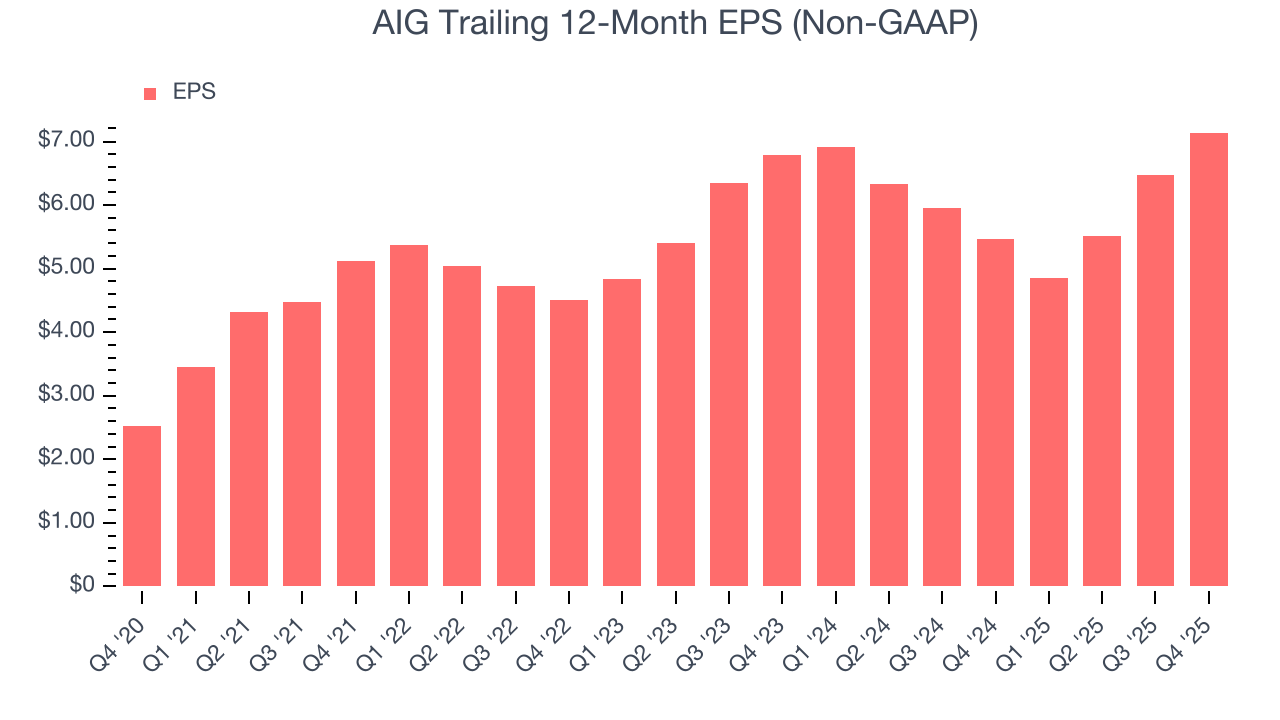
Like with revenue, we analyze EPS over a shorter period to see if we are missing a change in the business.
For AIG, its two-year annual EPS growth of 2.6% was lower than its five-year trend. We hope its growth can accelerate in the future.
In Q4, AIG reported adjusted EPS of $1.96, up from $1.30 in the same quarter last year. This print beat analysts’ estimates by 3%. Over the next 12 months, Wall Street expects AIG’s full-year EPS of $7.14 to grow 10.2%.
9. Book Value Per Share (BVPS)
Insurance companies are balance sheet businesses, collecting premiums upfront and paying out claims over time. The float–premiums collected but not yet paid out–are invested, creating an asset base supported by a liability structure. Book value per share (BVPS) captures this dynamic by measuring these assets (investment portfolio, cash, reinsurance recoverables) less liabilities (claim reserves, debt, future policy benefits). BVPS is essentially the residual value for shareholders.
We therefore consider BVPS very important to track for insurers and a metric that sheds light on business quality because it reflects long-term capital growth and is harder to manipulate than more commonly-used metrics like EPS.
AIG’s BVPS was flat over the last five years. However, BVPS growth has accelerated recently, growing by 8.1% annually over the last two years from $65.13 to $76.06 per share.
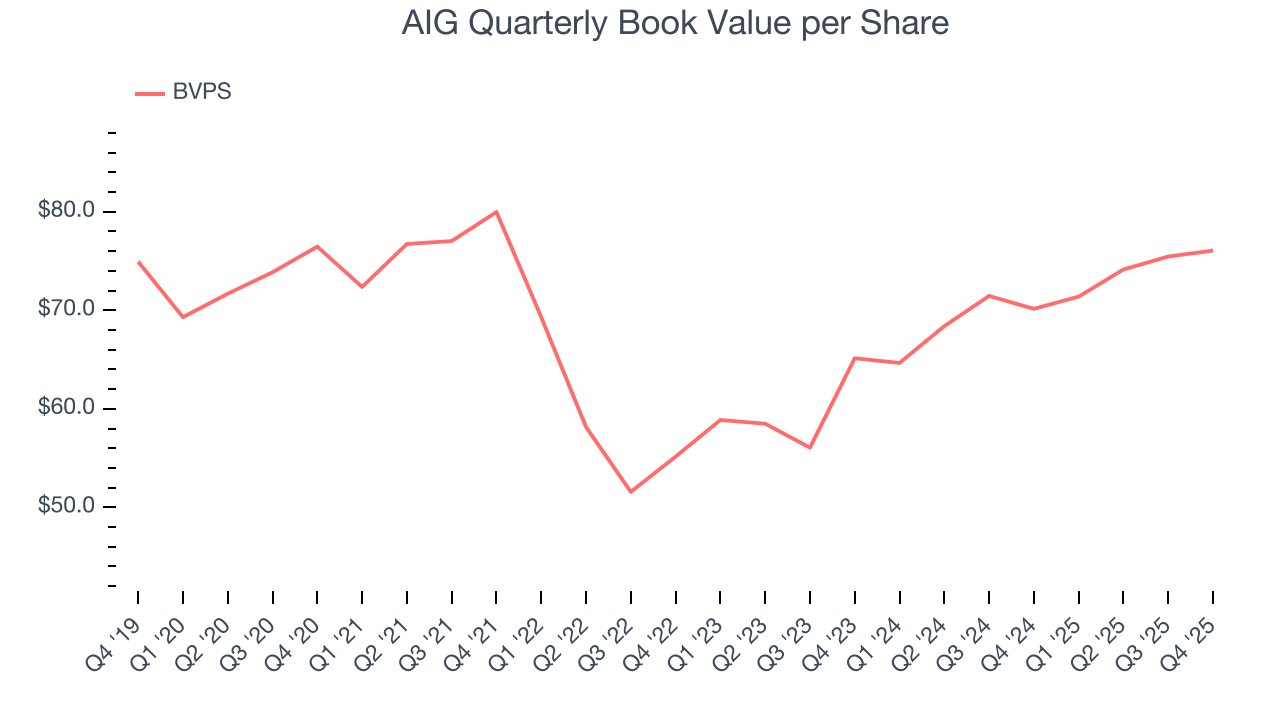
Over the next 12 months, Consensus estimates call for AIG’s BVPS to grow by 16.2% to $83.28, top-notch growth rate.
10. Balance Sheet Assessment
The debt-to-equity ratio is a widely used measure to assess a company's balance sheet health. A higher ratio means that a business aggressively financed its growth with debt. This can result in higher earnings (if the borrowed funds are invested profitably) but also increases risk.
If debt levels are too high, there could be difficulties in meeting obligations, especially during economic downturns or periods of rising interest rates if the debt has variable-rate payments.
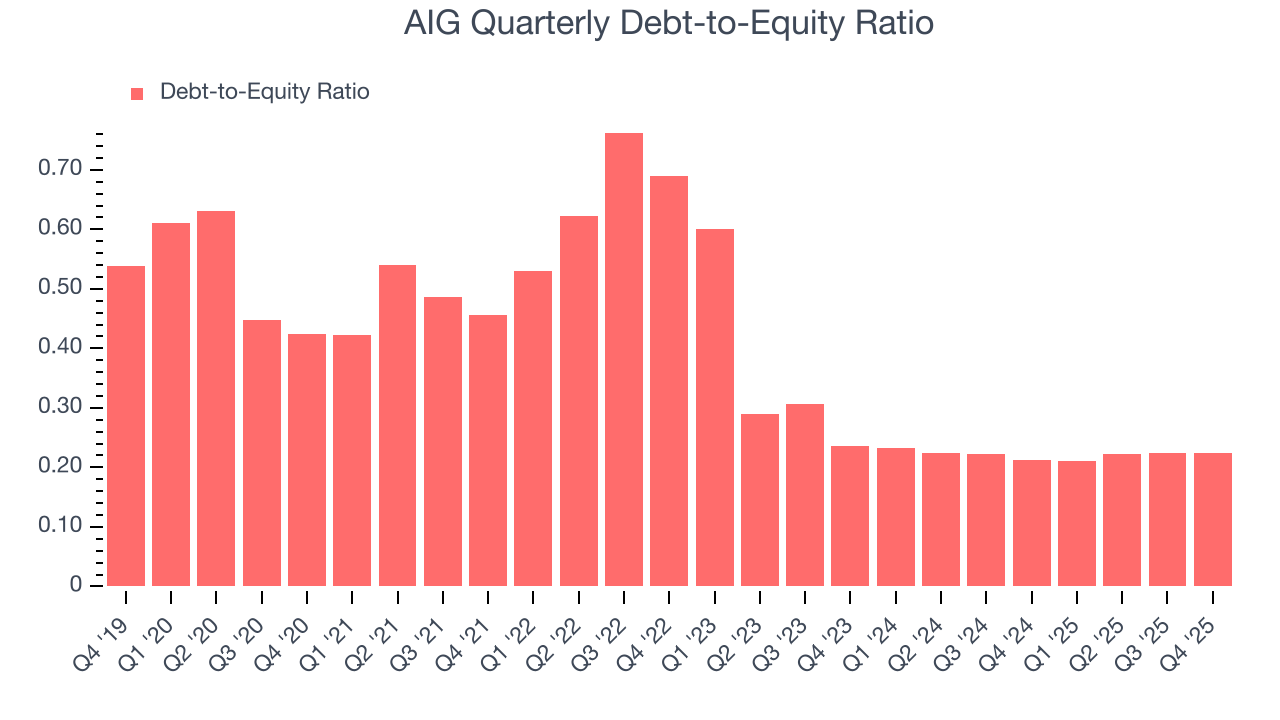
AIG currently has $9.21 billion of debt and $41 billion of shareholder's equity on its balance sheet, and over the past four quarters, has averaged a debt-to-equity ratio of 0.2×. We think this is safe and raises no red flags. In general, we’re comfortable with any ratio below 1.0× for an insurance business. Anything below 0.5× is a bonus.
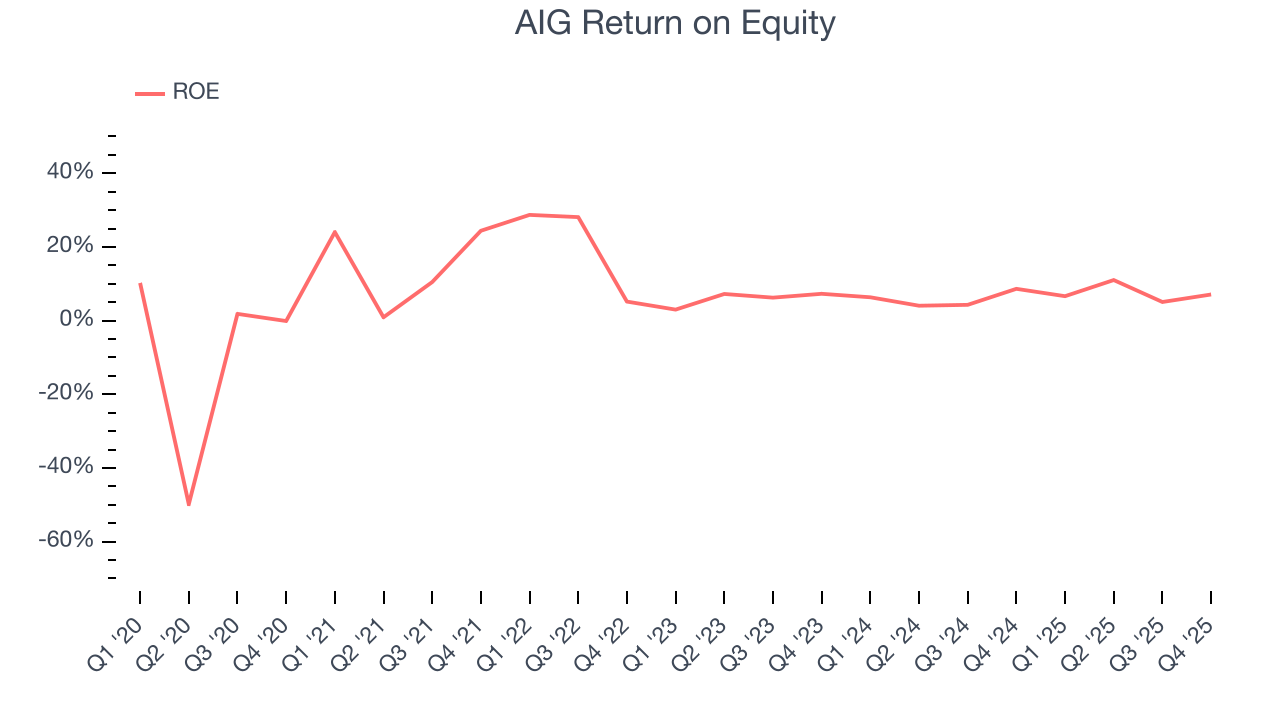
11. Return on Equity
Return on equity (ROE) is a crucial yardstick for insurance companies, measuring their ability to generate returns on the capital provided by shareholders. Insurers that consistently deliver superior ROE tend to create more value for their investors over time through strategic capital allocation and shareholder-friendly policies.
Over the last five years, AIG has averaged an ROE of 10.5%, uninspiring for a company operating in a sector where the average shakes out around 12.5%.
12. Key Takeaways from AIG’s Q4 Results
We struggled to find many positives in these results. Its net premiums earned missed and its book value per share fell short of Wall Street’s estimates. Overall, this was a weaker quarter. The stock remained flat at $74.98 immediately following the results.
13. Is Now The Time To Buy AIG?
Updated: March 14, 2026 at 12:40 AM EDT
The latest quarterly earnings matters, sure, but we actually think longer-term fundamentals and valuation matter more. Investors should consider all these pieces before deciding whether or not to invest in AIG.
AIG doesn’t pass our quality test. To kick things off, its revenue has declined over the last five years. While its expanding pre-tax profit margin shows the business has become more efficient, the downside is its BVPS growth was weak over the last five years. On top of that, its net premiums earned has declined over the last five years.
AIG’s P/B ratio based on the next 12 months is 0.9x. This valuation tells us a lot of optimism is priced in - you can find more timely opportunities elsewhere.
Wall Street analysts have a consensus one-year price target of $87.50 on the company (compared to the current share price of $77.38).