
Applied Industrial (AIT)
We’re not sold on Applied Industrial. Its decelerating growth shows demand is falling and its weak gross margin indicates it has bad unit economics.― StockStory Analyst Team
1. News


2. Summary
Why Applied Industrial Is Not Exciting
Formerly called The Ohio Ball Bearing Company, Applied Industrial (NYSE:AIT) distributes industrial products–everything from power tools to industrial valves–and services to a wide variety of industries.
- Absence of organic revenue growth over the past two years suggests it may have to lean into acquisitions to drive its expansion
- Projected sales growth of 5.1% for the next 12 months suggests sluggish demand
- A positive is that its additional sales over the last five years increased its profitability as the 80.2% annual growth in its earnings per share outpaced its revenue


Applied Industrial doesn’t check our boxes. There are more rewarding stocks elsewhere.
Why There Are Better Opportunities Than Applied Industrial


At $260.64 per share, Applied Industrial trades at 23.5x forward P/E. This valuation is fair for the quality you get, but we’re on the sidelines for now.
We’d rather invest in similarly-priced but higher-quality companies with more reliable earnings growth.
3. Applied Industrial (AIT) Research Report: Q4 CY2025 Update
Industrial products distributor Applied Industrial (NYSE:AIT) missed Wall Street’s revenue expectations in Q4 CY2025, but sales rose 8.4% year on year to $1.16 billion. Its GAAP profit of $2.51 per share was 0.7% above analysts’ consensus estimates.
Applied Industrial (AIT) Q4 CY2025 Highlights:
- Revenue: $1.16 billion vs analyst estimates of $1.17 billion (8.4% year-on-year growth, 0.7% miss)
- EPS (GAAP): $2.51 vs analyst estimates of $2.49 (0.7% beat)
- Adjusted EBITDA: $140.4 million vs analyst estimates of $143.2 million (12.1% margin, 1.9% miss)
- EPS (GAAP) guidance for the full year is $10.60 at the midpoint, roughly in line with what analysts were expecting
- Operating Margin: 10.6%, in line with the same quarter last year
- Free Cash Flow Margin: 8%, similar to the same quarter last year
- Organic Revenue rose 2.2% year on year (miss)
- Market Capitalization: $10.62 billion
Company Overview
Formerly called The Ohio Ball Bearing Company, Applied Industrial (NYSE:AIT) distributes industrial products–everything from power tools to industrial valves–and services to a wide variety of industries.
Applied Industrial was founded in 1923. By 1997, the product portfolio was much more vast than the original bearings it was known for, and the company changed its name to Applied Industrial Technologies to more accurately reflect its business.
Today, AIT offers products including bearings, power transmission products, fluid handling equipment, hydraulic pumps, and a wide variety of other industrial supplies. The company also offers repair and storeroom services to keep customers’ equipment in top condition and to help customers manage their supply of products. For example, AIT may support a manufacturing plant by regularly supplying conveyor belts for assembly lines before they wear out to ensure the plant's operations are never down. AIT may also store and manage equipment for the plant to reduce costs and working capital needs.
The primary revenue sources for Applied Industrial come from the sale of industrial products and related services, such as technical support and inventory management. The company's business model focuses on direct sales through its network of service centers and online platforms, providing accessibility and convenience for its customers.
4. Engineered Components and Systems
Engineered components and systems companies possess technical know-how in sometimes narrow areas such as metal forming or intelligent robotics. Lately, automation and connected equipment collecting analyzable data have been trending, creating new demand. On the other hand, like the broader industrials sector, engineered components and systems companies are at the whim of economic cycles. Consumer spending and interest rates, for example, can greatly impact the industrial production that drives demand for these companies’ offerings.
Competitors in the industrial products and services industry include W.W. Grainger (NYSE:GWW), Fastenal (NASDAQ:FAST), and MSC Industrial Direct (NYSE:MSM).
5. Revenue Growth
A company’s long-term sales performance is one signal of its overall quality. Even a bad business can shine for one or two quarters, but a top-tier one grows for years. Thankfully, Applied Industrial’s 9.2% annualized revenue growth over the last five years was solid. Its growth beat the average industrials company and shows its offerings resonate with customers.
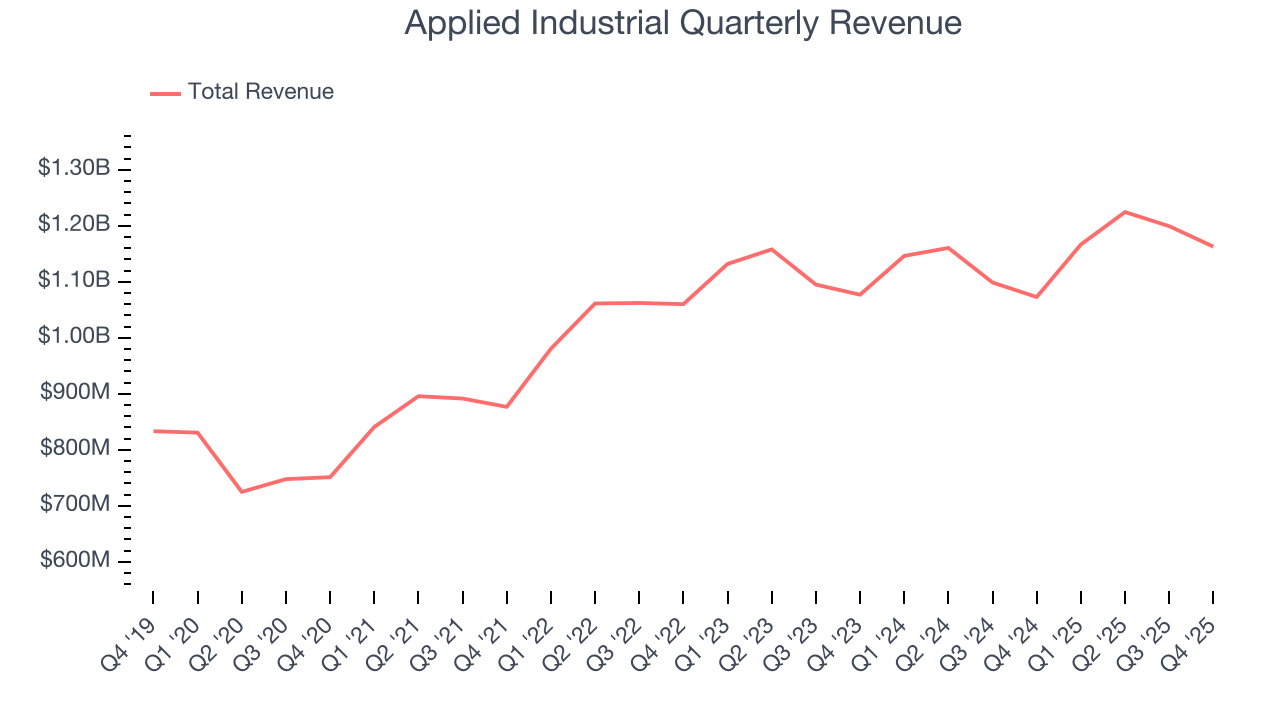
We at StockStory place the most emphasis on long-term growth, but within industrials, a half-decade historical view may miss cycles, industry trends, or a company capitalizing on catalysts such as a new contract win or a successful product line. Applied Industrial’s recent performance shows its demand has slowed as its annualized revenue growth of 3.2% over the last two years was below its five-year trend. 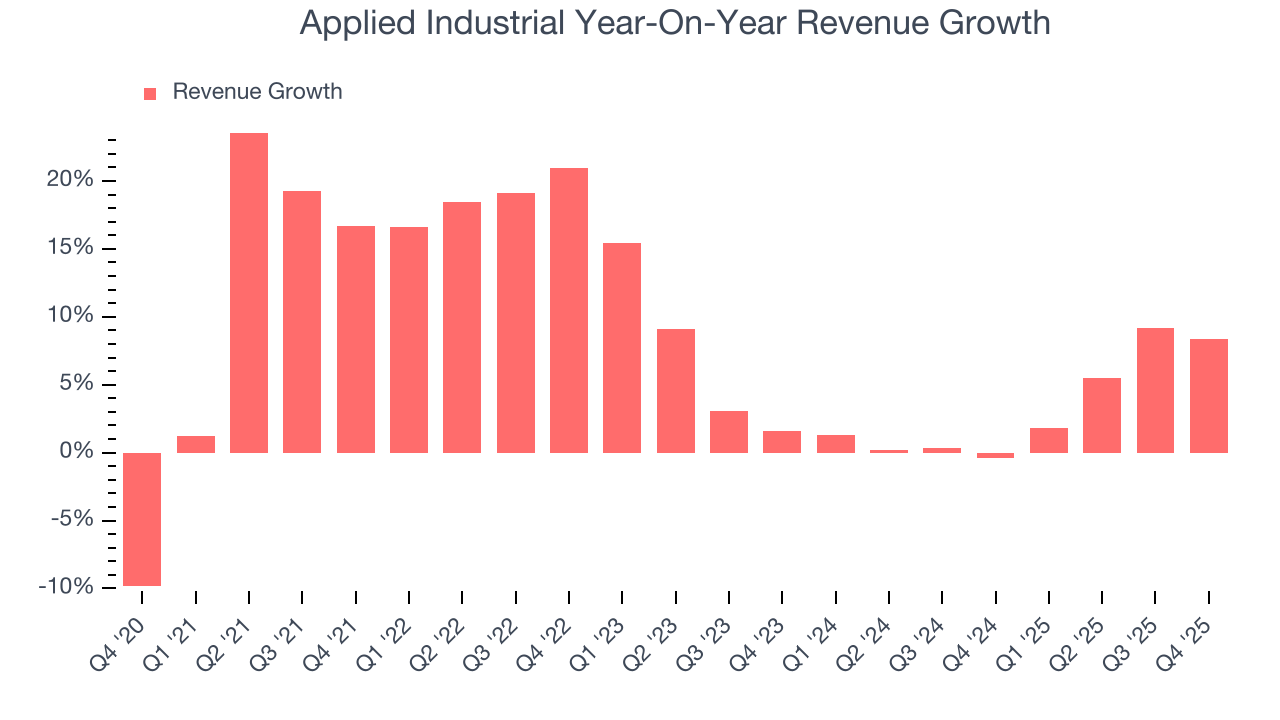
We can better understand the company’s sales dynamics by analyzing its organic revenue, which strips out one-time events like acquisitions and currency fluctuations that don’t accurately reflect its fundamentals. Over the last two years, Applied Industrial’s organic revenue was flat. Because this number is lower than its two-year revenue growth, we can see that some mixture of acquisitions and foreign exchange rates boosted its headline results. 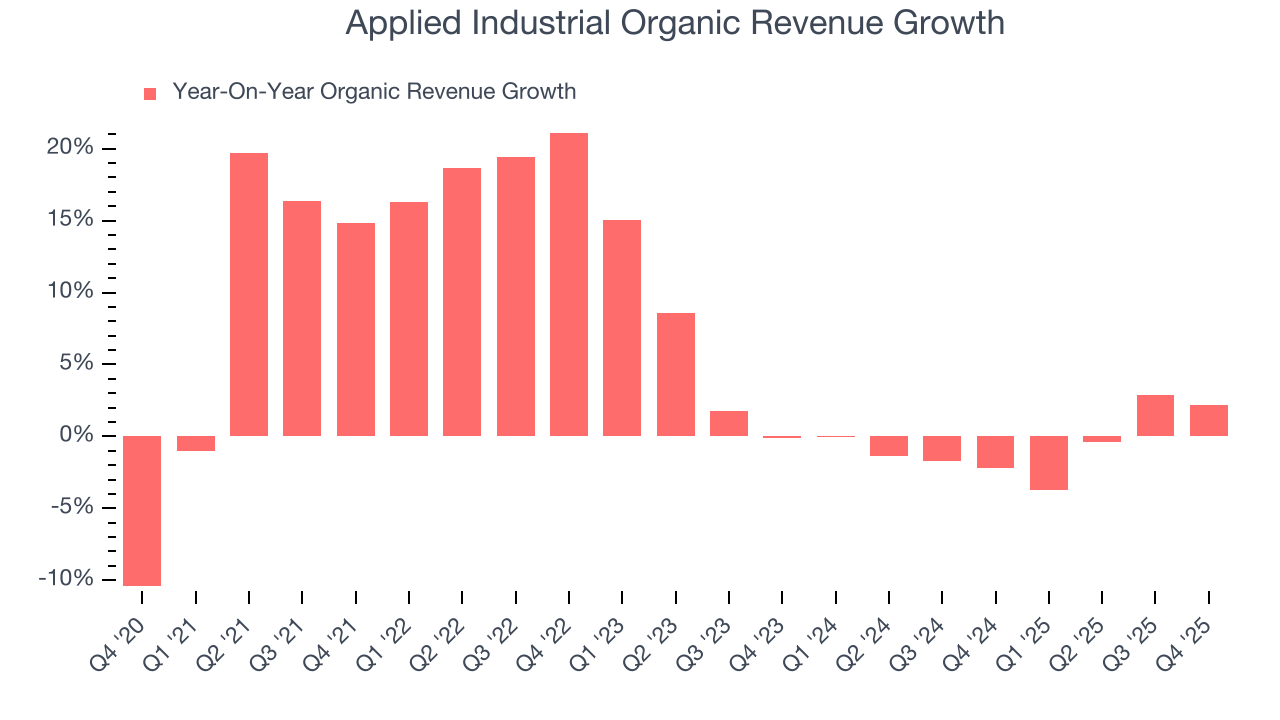
This quarter, Applied Industrial’s revenue grew by 8.4% year on year to $1.16 billion, missing Wall Street’s estimates.
Looking ahead, sell-side analysts expect revenue to grow 4.7% over the next 12 months. Although this projection suggests its newer products and services will catalyze better top-line performance, it is still below the sector average.
6. Gross Margin & Pricing Power
All else equal, we prefer higher gross margins because they make it easier to generate more operating profits and indicate that a company commands pricing power by offering more differentiated products.
Applied Industrial’s gross margin is slightly below the average industrials company, giving it less room to invest in areas such as research and development. As you can see below, it averaged a 29.7% gross margin over the last five years. Said differently, Applied Industrial had to pay a chunky $70.33 to its suppliers for every $100 in revenue. 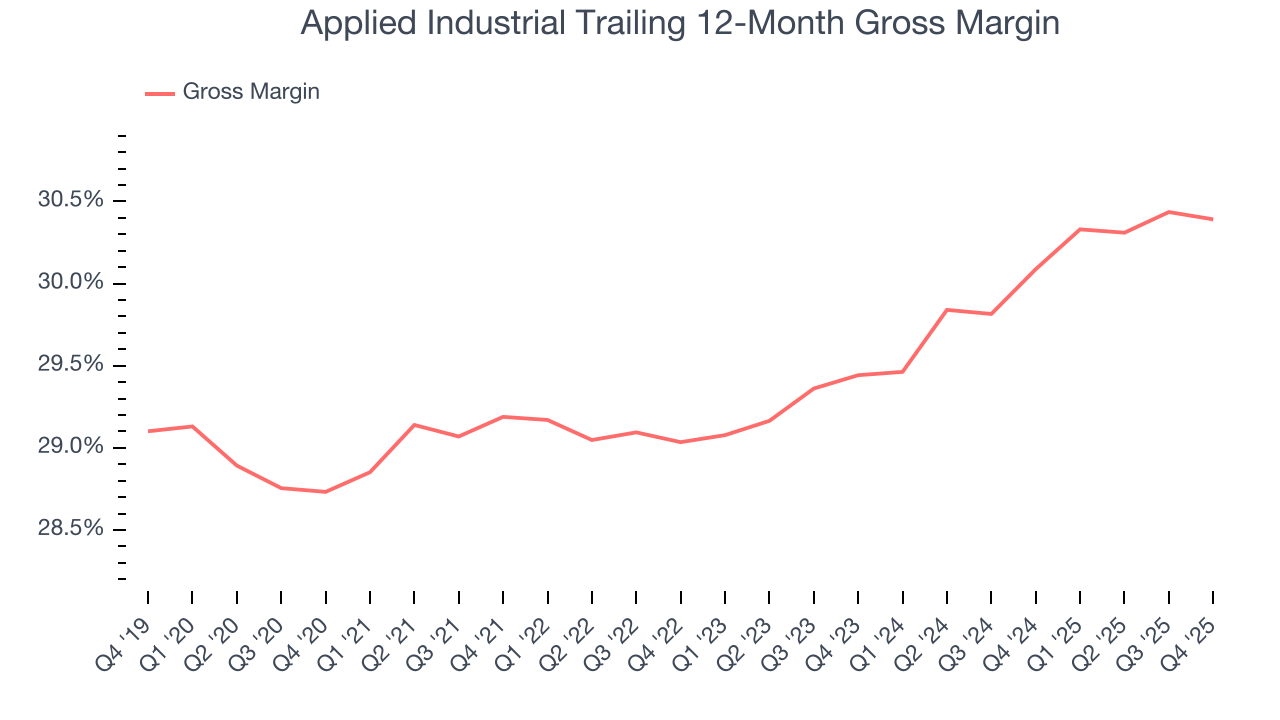
Applied Industrial produced a 30.4% gross profit margin in Q4, in line with the same quarter last year. Zooming out, the company’s full-year margin has remained steady over the past 12 months, suggesting its input costs (such as raw materials and manufacturing expenses) have been stable and it isn’t under pressure to lower prices.
7. Operating Margin
Applied Industrial has managed its cost base well over the last five years. It demonstrated solid profitability for an industrials business, producing an average operating margin of 10.4%. This result was particularly impressive because of its low gross margin, which is mostly a factor of what it sells and takes huge shifts to move meaningfully. Companies have more control over their operating margins, and it’s a show of well-managed operations if they’re high when gross margins are low.
Looking at the trend in its profitability, Applied Industrial’s operating margin rose by 2.1 percentage points over the last five years, as its sales growth gave it operating leverage.
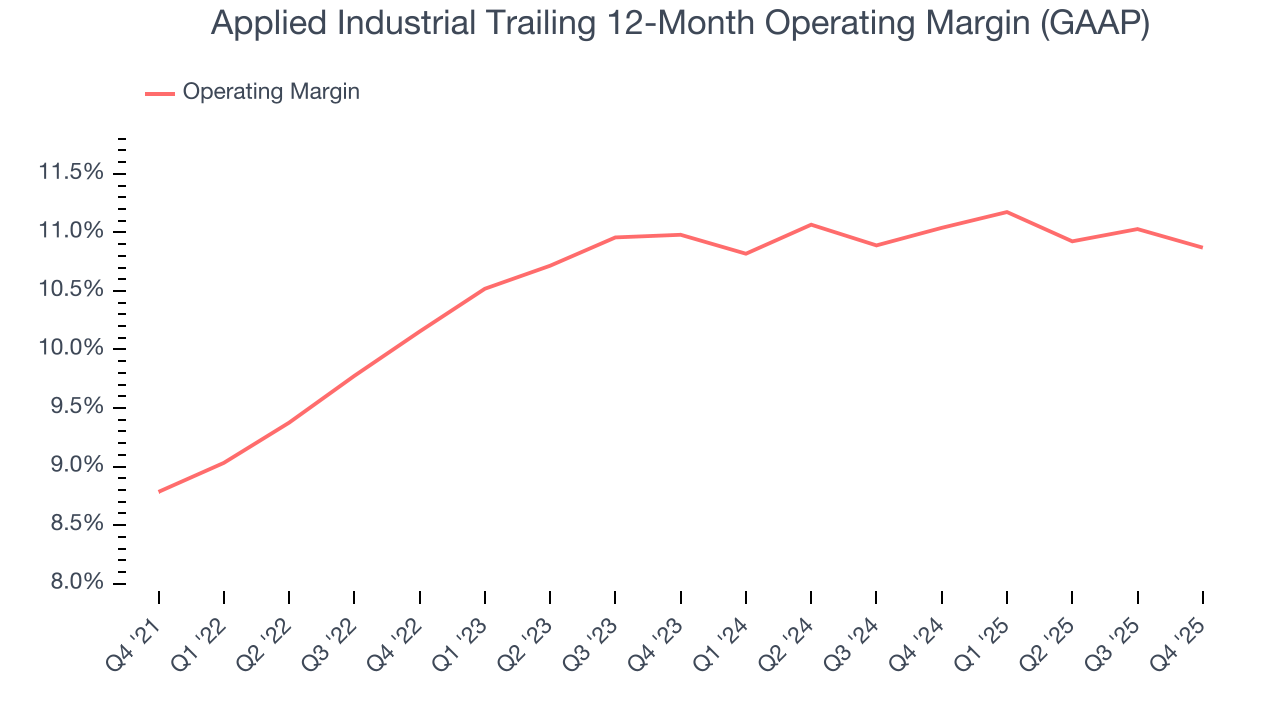
In Q4, Applied Industrial generated an operating margin profit margin of 10.6%, in line with the same quarter last year. This indicates the company’s cost structure has recently been stable.
8. Earnings Per Share
Revenue trends explain a company’s historical growth, but the long-term change in earnings per share (EPS) points to the profitability of that growth – for example, a company could inflate its sales through excessive spending on advertising and promotions.
Applied Industrial’s full-year EPS flipped from negative to positive over the last five years. This is encouraging and shows it’s at a critical moment in its life.
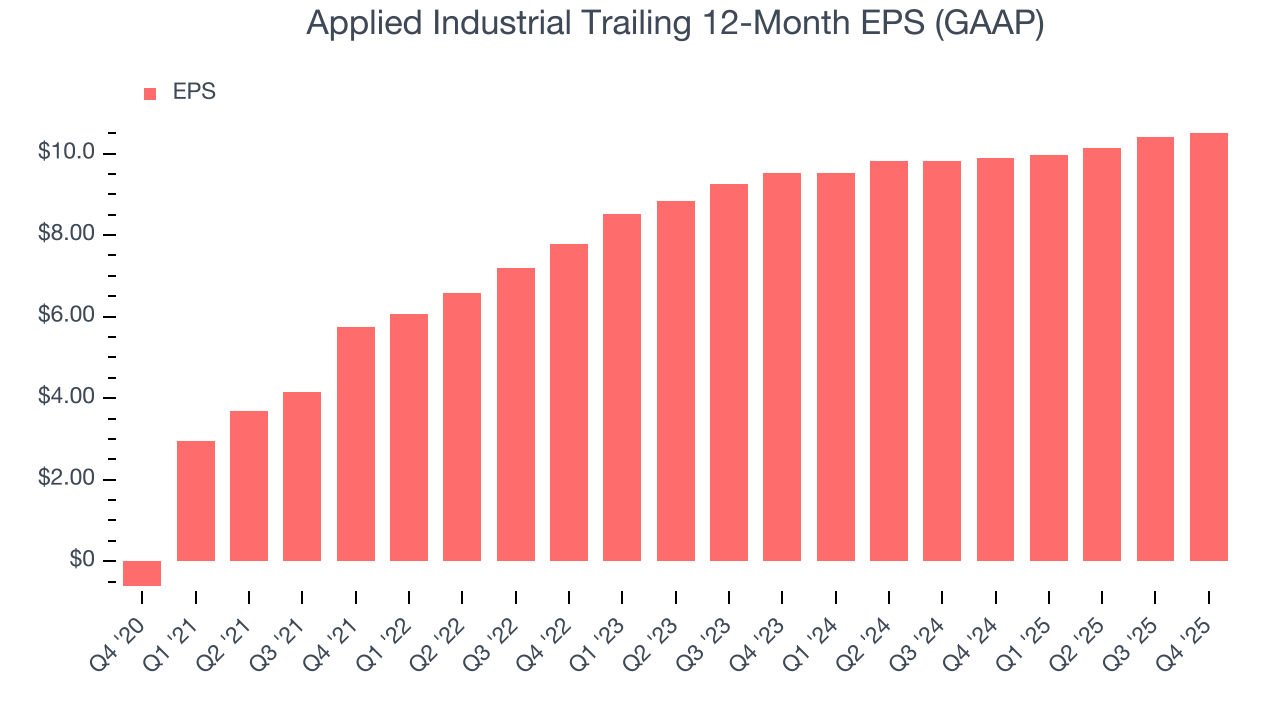
Like with revenue, we analyze EPS over a shorter period to see if we are missing a change in the business.
Applied Industrial’s unimpressive 5% annual EPS growth over the last two years aligns with its revenue trend. This tells us it maintained its per-share profitability as it expanded.
In Q4, Applied Industrial reported EPS of $2.51, up from $2.39 in the same quarter last year. This print was close to analysts’ estimates. Over the next 12 months, Wall Street expects Applied Industrial’s full-year EPS of $10.51 to grow 5.6%.
9. Cash Is King
Although earnings are undoubtedly valuable for assessing company performance, we believe cash is king because you can’t use accounting profits to pay the bills.
Applied Industrial has shown decent cash profitability, giving it some flexibility to reinvest or return capital to investors. The company’s free cash flow margin averaged 7.4% over the last five years, slightly better than the broader industrials sector.
Taking a step back, we can see that Applied Industrial’s margin expanded by 5.4 percentage points during that time. This is encouraging, and we can see it became a less capital-intensive business because its free cash flow profitability rose more than its operating profitability.
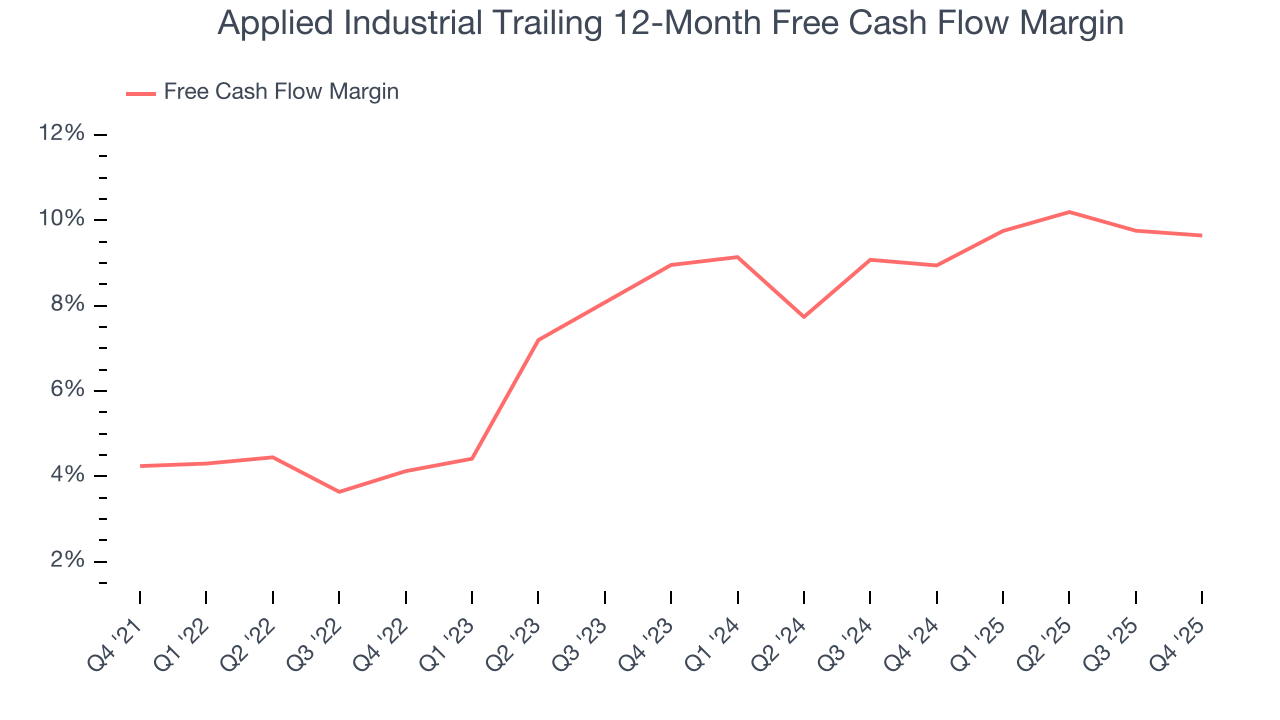
Applied Industrial’s free cash flow clocked in at $93.38 million in Q4, equivalent to a 8% margin. This cash profitability was in line with the comparable period last year and its five-year average.
10. Return on Invested Capital (ROIC)
EPS and free cash flow tell us whether a company was profitable while growing its revenue. But was it capital-efficient? Enter ROIC, a metric showing how much operating profit a company generates relative to the money it has raised (debt and equity).
Although Applied Industrial hasn’t been the highest-quality company lately, it found a few growth initiatives in the past that worked out wonderfully. Its five-year average ROIC was 19.6%, splendid for an industrials business.
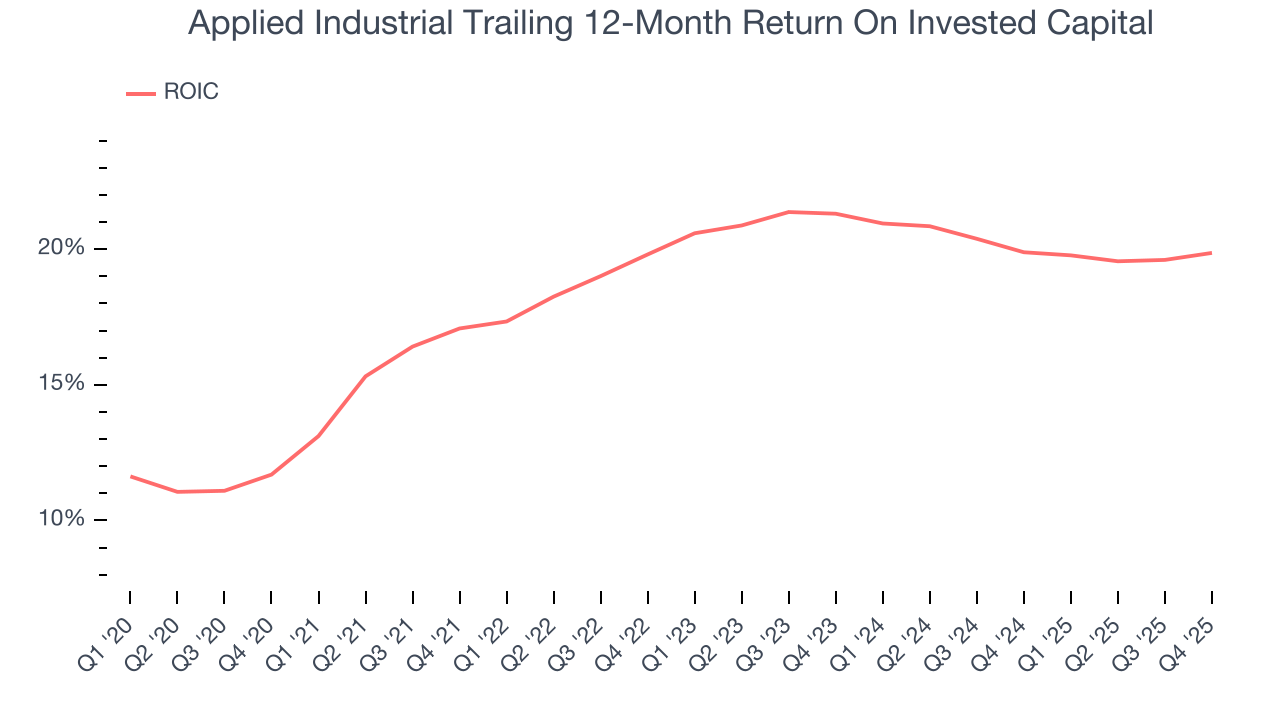
We like to invest in businesses with high returns, but the trend in a company’s ROIC is what often surprises the market and moves the stock price. Over the last few years, Applied Industrial’s ROIC averaged 1.4 percentage point increases each year. This is a good sign, and if its returns keep rising, there’s a chance it could evolve into an investable business.
11. Balance Sheet Assessment
Applied Industrial reported $406 million of cash and $572.3 million of debt on its balance sheet in the most recent quarter. As investors in high-quality companies, we primarily focus on two things: 1) that a company’s debt level isn’t too high and 2) that its interest payments are not excessively burdening the business.
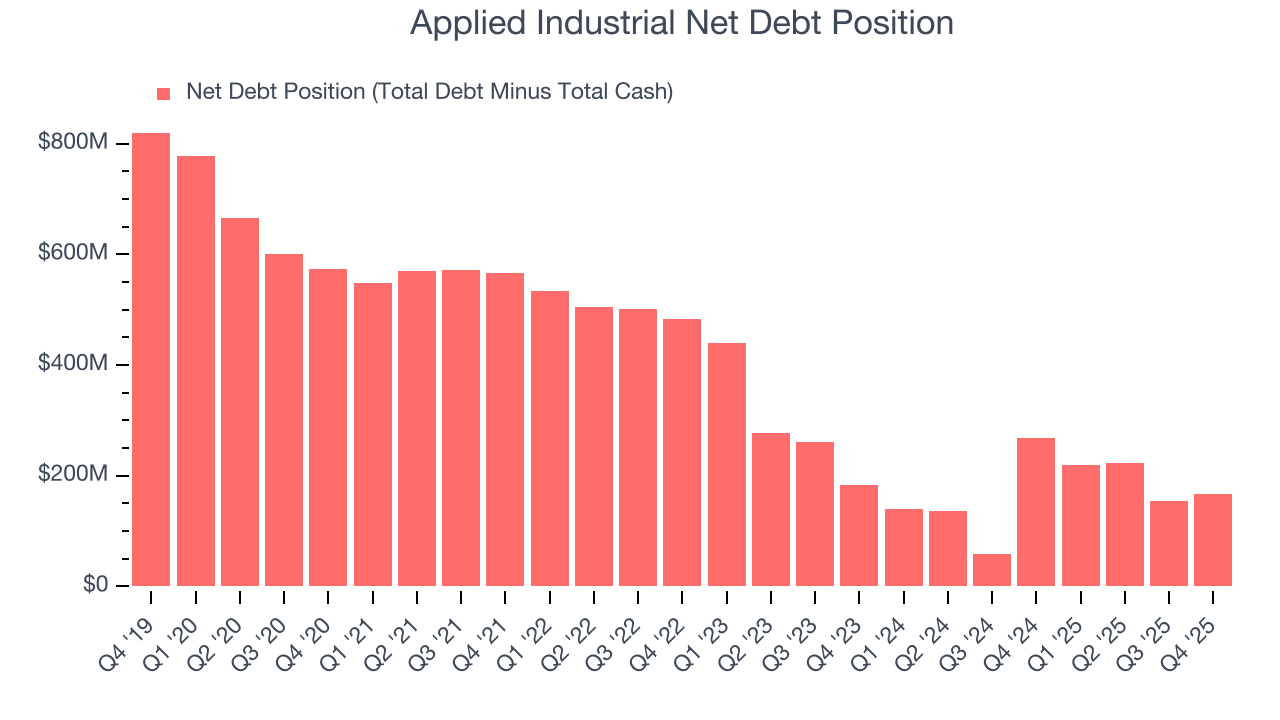
With $584.7 million of EBITDA over the last 12 months, we view Applied Industrial’s 0.3× net-debt-to-EBITDA ratio as safe. We also see its $2.23 million of annual interest expenses as appropriate. The company’s profits give it plenty of breathing room, allowing it to continue investing in growth initiatives.
12. Key Takeaways from Applied Industrial’s Q4 Results
Revenue missed slightly, EPS beat slightly, and EPS guidance was roughly in line with expectations. Overall, this quarter was without many large surprises. The stock remained flat at $280 immediately after reporting.
13. Is Now The Time To Buy Applied Industrial?
Updated: March 27, 2026 at 11:12 PM EDT
Before deciding whether to buy Applied Industrial or pass, we urge investors to consider business quality, valuation, and the latest quarterly results.
Applied Industrial has a few positive attributes, but it doesn’t top our wishlist. First off, its revenue growth was solid over the last five years. And while Applied Industrial’s flat organic revenue disappointed, its rising cash profitability gives it more optionality.
Applied Industrial’s P/E ratio based on the next 12 months is 23.5x. This valuation multiple is fair, but we don’t have much faith in the company. We're fairly confident there are better investments elsewhere.
Wall Street analysts have a consensus one-year price target of $305 on the company (compared to the current share price of $260.64).