
Allstate (ALL)
We’re not sold on Allstate. Its sales and EPS are expected to be weak over the next year, which doesn’t bode well for its share price.― StockStory Analyst Team
1. News


2. Summary
Why Allstate Is Not Exciting
Born from a Sears, Roebuck & Co. initiative during the Great Depression with its famous "You're in good hands" slogan, Allstate (NYSE:ALL) is one of America's largest personal property and casualty insurers, offering protection for autos, homes, and personal property.
- Large asset base makes it harder to grow book value per share quickly, and its annual book value per share growth of 3.2% over the last five years was below our standards for the insurance sector
- Estimated sales growth of 1.4% for the next 12 months implies demand will slow from its two-year trend
- A consolation is that its notable projected book value per share growth of 19.1% for the next 12 months hints at strong capital generation


Allstate doesn’t fulfill our quality requirements. There are better opportunities in the market.
Why There Are Better Opportunities Than Allstate


Allstate’s stock price of $193.68 implies a valuation ratio of 1.8x forward P/B. This valuation is fair for the quality you get, but we’re on the sidelines for now.
We’d rather invest in similarly-priced but higher-quality companies with more reliable earnings growth.
3. Allstate (ALL) Research Report: Q3 CY2025 Update
Insurance giant Allstate (NYSE:ALL) reported Q3 CY2025 results beating Wall Street’s revenue expectations, with sales up 3.8% year on year to $17.26 billion. Its non-GAAP profit of $11.17 per share was 48.1% above analysts’ consensus estimates.
Allstate (ALL) Q3 CY2025 Highlights:
Company Overview
Born from a Sears, Roebuck & Co. initiative during the Great Depression with its famous "You're in good hands" slogan, Allstate (NYSE:ALL) is one of America's largest personal property and casualty insurers, offering protection for autos, homes, and personal property.
Allstate operates through a network of thousands of exclusive agents, independent agents, contact centers, and online platforms to deliver its insurance products. The company's portfolio extends beyond traditional auto and home insurance to include specialty coverage for motorcycles, boats, and recreational vehicles, as well as umbrella policies that provide additional liability protection.
The insurer has embraced technology to enhance its offerings, developing telematics programs like Drivewise, which monitors driving behavior through mobile apps or in-vehicle devices to encourage safer driving and provide more personalized pricing. Similarly, its Milewise program offers usage-based insurance where customers pay based on miles driven.
Beyond its core insurance business, Allstate has diversified into protection services through several subsidiaries. Allstate Protection Plans safeguards consumer electronics and appliances purchased from major retailers. Allstate Identity Protection helps customers secure their personal information against fraud. The company also provides roadside assistance services and dealer services for vehicle service contracts.
A typical Allstate customer might be a homeowner who bundles multiple policies for savings, uses the mobile app to file claims after storm damage, and receives personalized pricing based on their driving habits tracked through telematics. Allstate generates revenue primarily through insurance premiums, with additional income from investment returns on its substantial portfolio.
4. Property & Casualty Insurance
Property & Casualty (P&C) insurers protect individuals and businesses against financial loss from damage to property or from legal liability. This is a cyclical industry, and the sector benefits when there is 'hard market', characterized by strong premium rate increases that outpace loss and cost inflation, resulting in robust underwriting margins. The opposite is true in a 'soft market'. Interest rates also matter, as they determine the yields earned on fixed-income portfolios. On the other hand, P&C insurers face a major secular headwind from the increasing frequency and severity of catastrophe losses due to climate change. Furthermore, the liability side of the business is pressured by 'social inflation'—the trend of rising litigation costs and larger jury awards.
Allstate's main competitors in the property and casualty insurance market include State Farm, Progressive (NYSE:PGR), Berkshire Hathaway's GEICO (NYSE:BRK.A, NYSE:BRK.B), Liberty Mutual, and Travelers (NYSE:TRV).
5. Revenue Growth
In general, insurance companies earn revenue from three primary sources. The first is the core insurance business itself, often called underwriting and represented in the income statement as premiums earned. The second source is investment income from investing the “float” (premiums collected upfront not yet paid out as claims) in assets such as fixed-income assets and equities. The third is fees from various sources such as policy administration, annuities, or other value-added services. Luckily, Allstate’s revenue grew at a solid 9.9% compounded annual growth rate over the last five years. Its growth beat the average insurance company and shows its offerings resonate with customers.
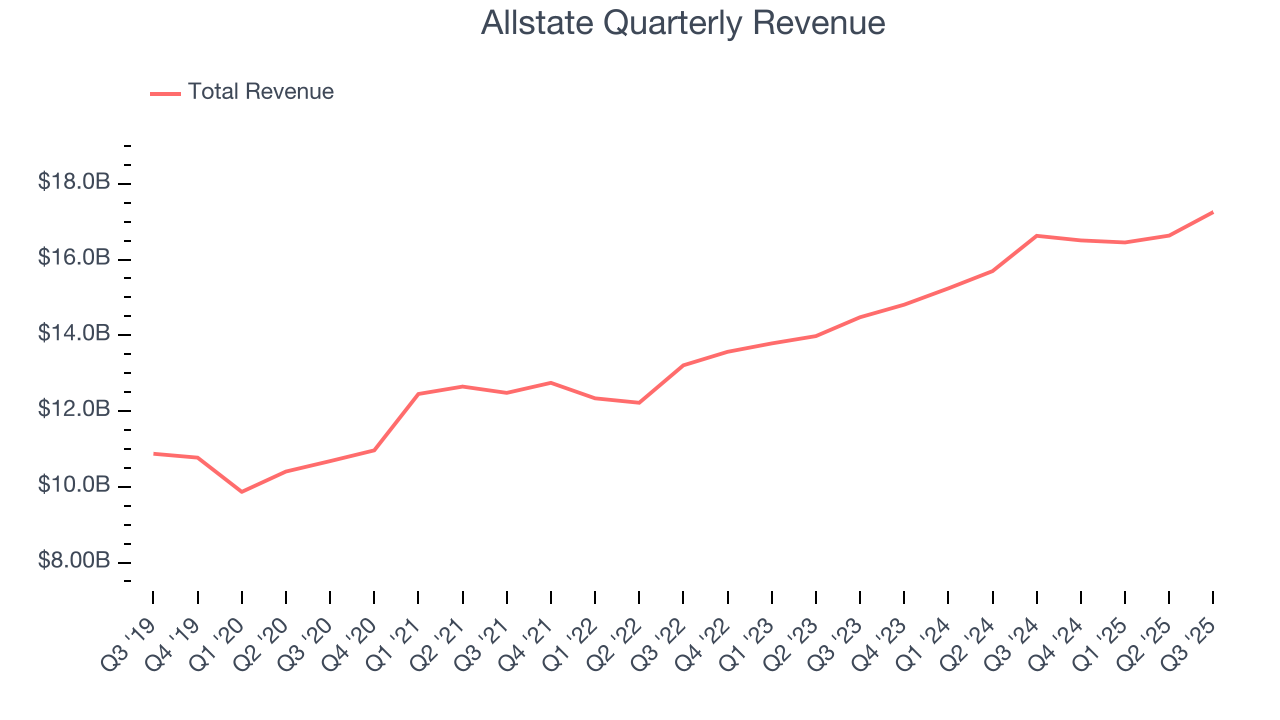
Long-term growth is the most important, but within financials, a half-decade historical view may miss recent interest rate changes and market returns. Allstate’s annualized revenue growth of 9.4% over the last two years aligns with its five-year trend, suggesting its demand was predictably strong. 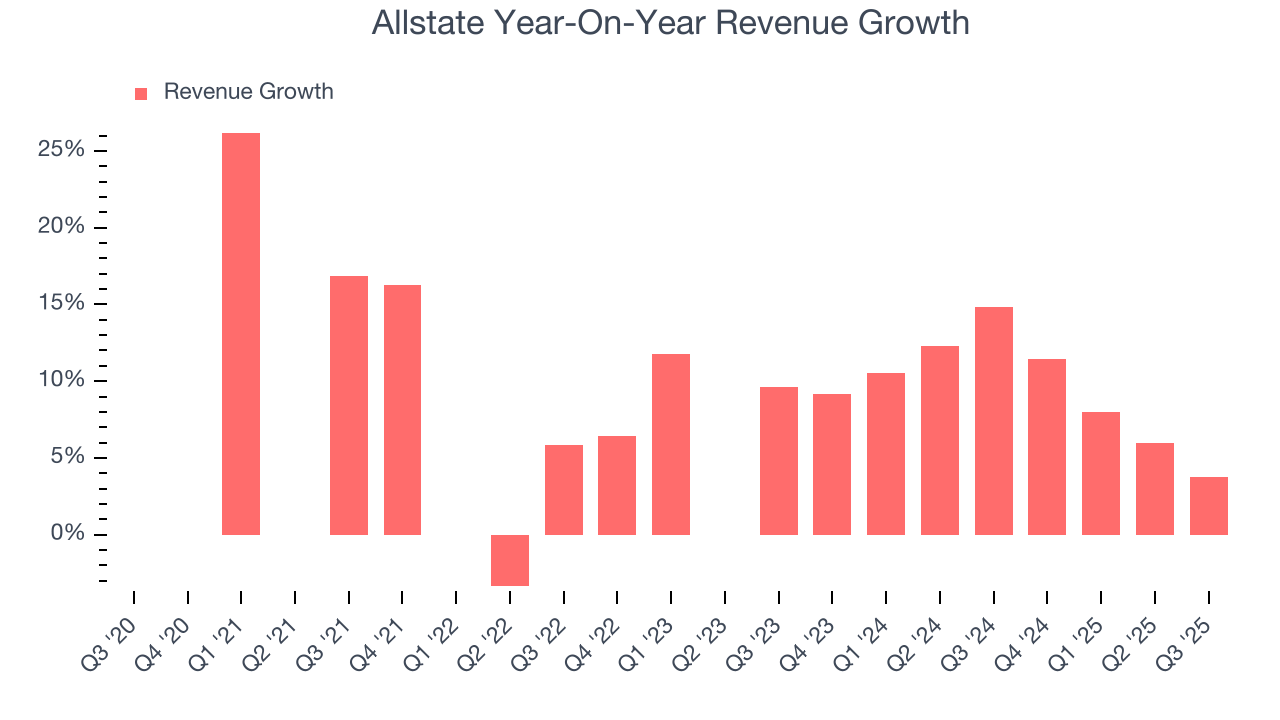 Note: Quarters not shown were determined to be outliers, impacted by outsized investment gains/losses that are not indicative of the recurring fundamentals of the business.
This quarter, Allstate reported modest year-on-year revenue growth of 3.8% but beat Wall Street’s estimates by 2.8%.
Net premiums earned made up 90.8% of the company’s total revenue during the last five years, meaning Allstate lives and dies by its underwriting activities because non-insurance operations barely move the needle.
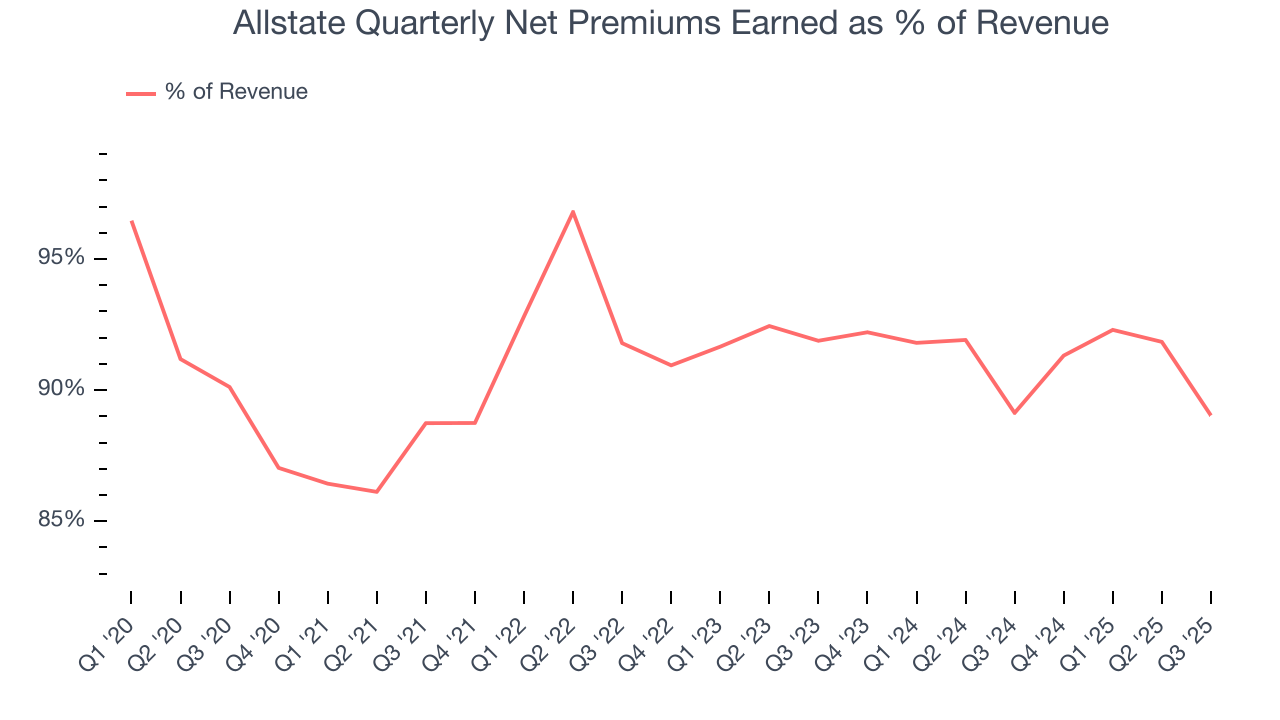
Our experience and research show the market cares primarily about an insurer’s net premiums earned growth as investment and fee income are considered more susceptible to market volatility and economic cycles.
6. Net Premiums Earned
When insurers sell policies, they protect themselves from extremely large losses or an outsized accumulation of losses with reinsurance (insurance for insurance companies). Net premiums earned are therefore net of what’s ceded to reinsurers as a risk mitigation and transfer strategy.
Allstate’s net premiums earned has grown at a 9.9% annualized rate over the last five years, a step above the broader insurance industry and in line with its total revenue.
When analyzing Allstate’s net premiums earned over the last two years, we can paint a similar picture as it recorded an annual growth rate of 9.1%. This performance was similar to its total revenue.
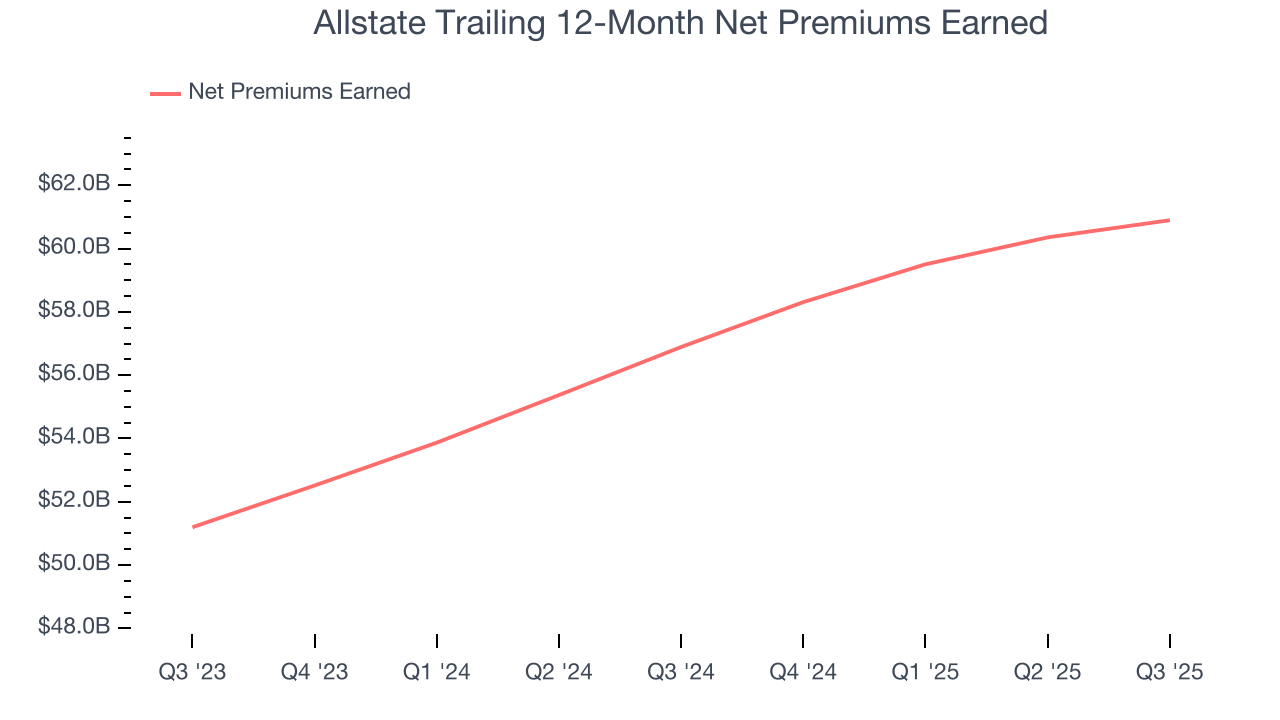
In Q3, Allstate produced $15.36 billion of net premiums earned, up 3.7% year on year and topping Wall Street Consensus estimates by 4.7%.
7. Combined Ratio
Revenue growth is one major determinant of business quality, and the efficiency of operations is another. For insurance companies, we look at the combined ratio rather than the operating expenses and margins that define sectors such as consumer, tech, and industrials.
Combined ratio = (costs of underwriting + what an insurer pays out in claims) / net premiums earned. If a company boasts a combined ratio under 100%, it is underwriting profitably. If above 100%, it is losing money on its core operations.
Given the calculation, a lower expense ratio is better. Over the last five years, Allstate’s combined ratio couldn’t build momentum, hanging around 89.1%. Luckily, it seems the company has recently taken steps to address its expense base as its combined ratio improved by 20.8 percentage points on a two-year basis.
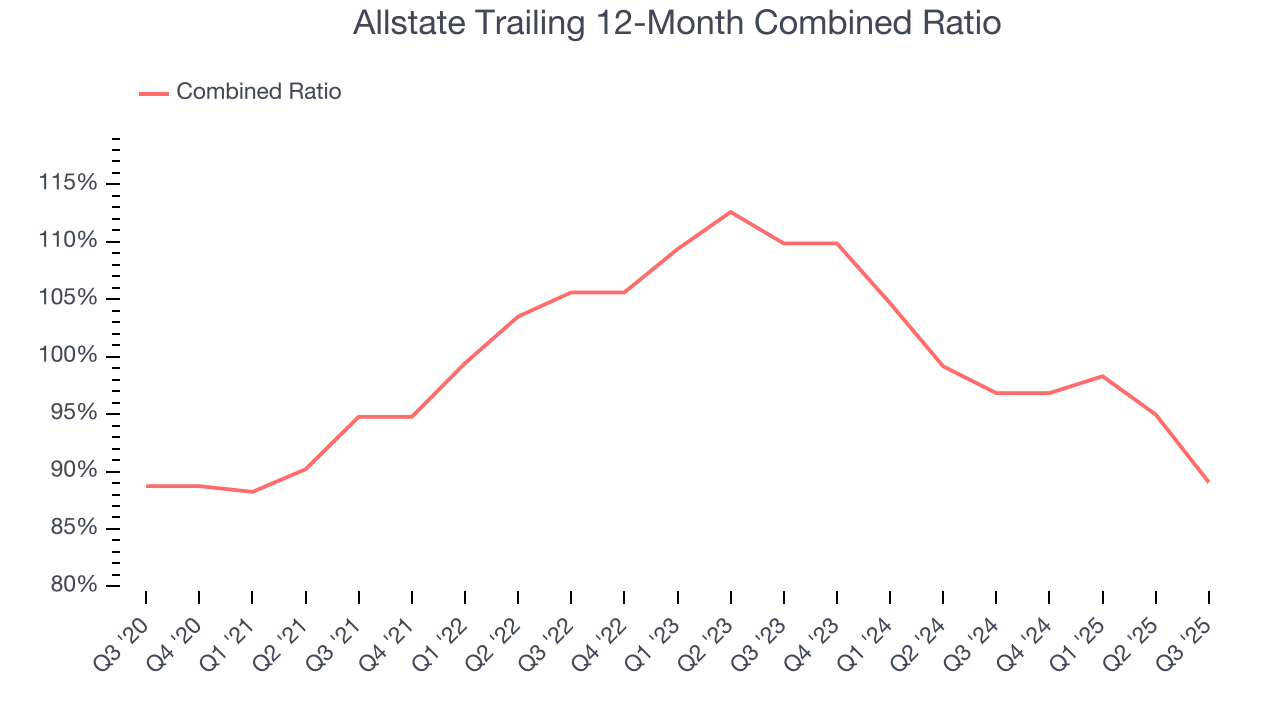
Allstate’s combined ratio came in at 78.7% this quarter, beating analysts’ expectations by 922.2 basis points (100 basis points = 1 percentage point). This result was 17.7 percentage points better than the same quarter last year.
8. Earnings Per Share
Revenue trends explain a company’s historical growth, but the long-term change in earnings per share (EPS) points to the profitability of that growth – for example, a company could inflate its sales through excessive spending on advertising and promotions.
Allstate’s EPS grew at a remarkable 18.6% compounded annual growth rate over the last five years, higher than its 9.9% annualized revenue growth. However, this alone doesn’t tell us much about its business quality because its combined ratio didn’t improve.
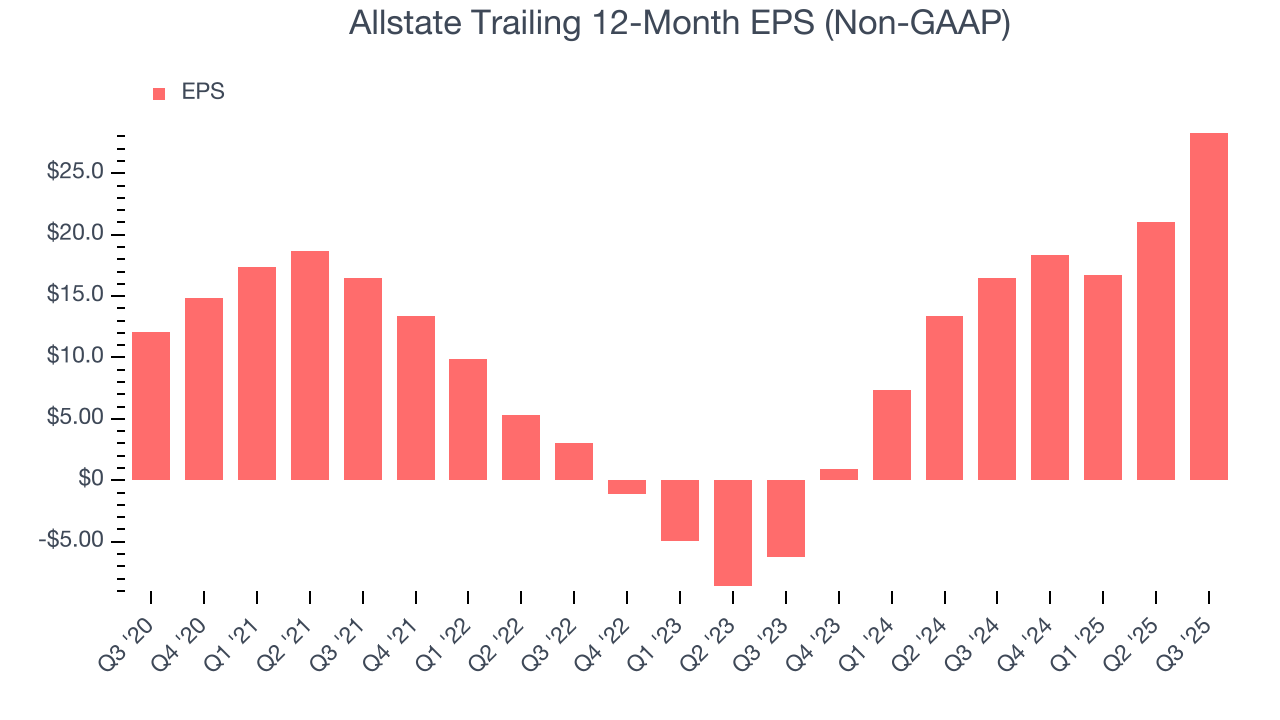
We can take a deeper look into Allstate’s earnings to better understand the drivers of its performance. A five-year view shows that Allstate has repurchased its stock, shrinking its share count by 15.2%. This tells us its EPS outperformed its revenue not because of increased operational efficiency but financial engineering, as buybacks boost per share earnings. 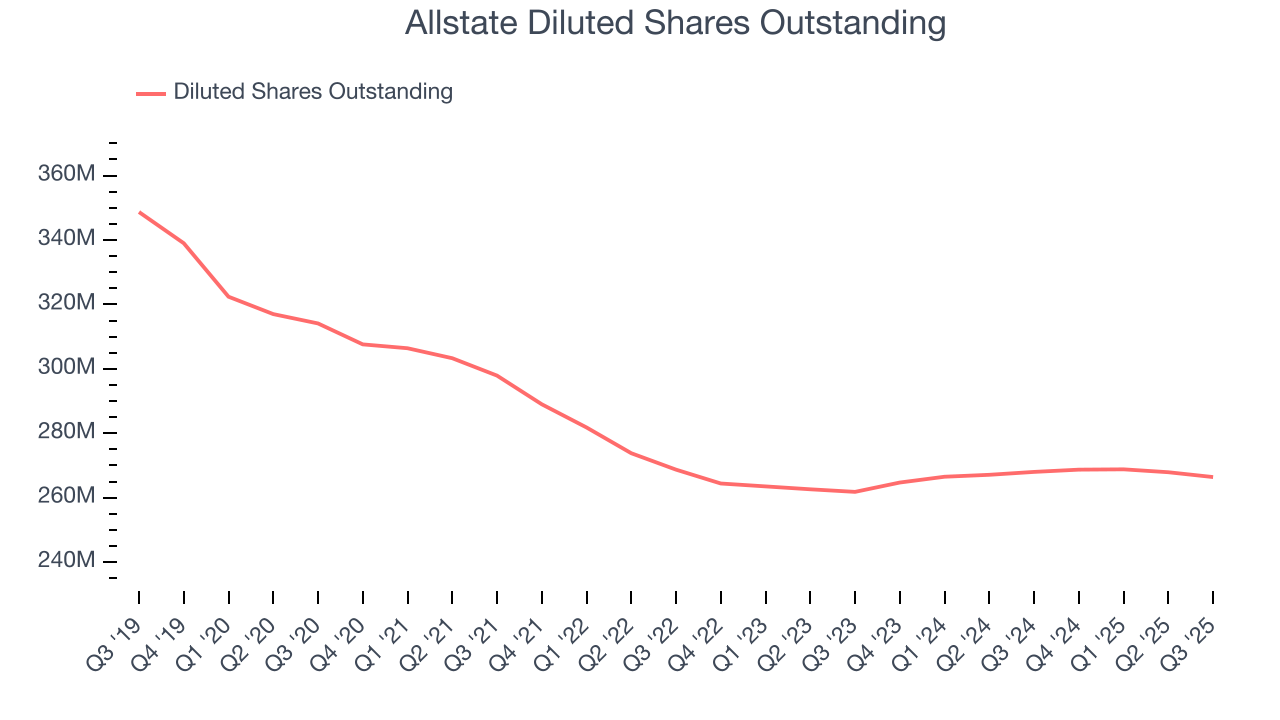
Like with revenue, we analyze EPS over a more recent period because it can provide insight into an emerging theme or development for the business.
For Allstate, its two-year annual EPS growth of 155% was higher than its five-year trend. We love it when earnings growth accelerates, especially when it accelerates off an already high base.
In Q3, Allstate reported adjusted EPS of $11.17, up from $3.91 in the same quarter last year. This print easily cleared analysts’ estimates, and shareholders should be content with the results. Over the next 12 months, Wall Street expects Allstate’s full-year EPS of $28.31 to shrink by 19.6%.
9. Book Value Per Share (BVPS)
Insurance companies are balance sheet businesses, collecting premiums upfront and paying out claims over time. The float – premiums collected but not yet paid out – are invested, creating an asset base supported by a liability structure. Book value captures this dynamic by measuring:
- Assets (investment portfolio, cash, reinsurance recoverables) - liabilities (claim reserves, debt, future policy benefits)
BVPS is essentially the residual value for shareholders.
We therefore consider BVPS very important to track for insurers and a metric that sheds light on business quality. While other (and more commonly known) per-share metrics like EPS can sometimes be lumpy due to reserve releases or one-time items and can be managed or skewed while still following accounting rules, BVPS reflects long-term capital growth and is harder to manipulate.
Allstate’s BVPS grew at a sluggish 3.2% annual clip over the last five years. However, BVPS growth has accelerated recently, growing by 42.3% annually over the last two years from $48.06 to $97.34 per share.
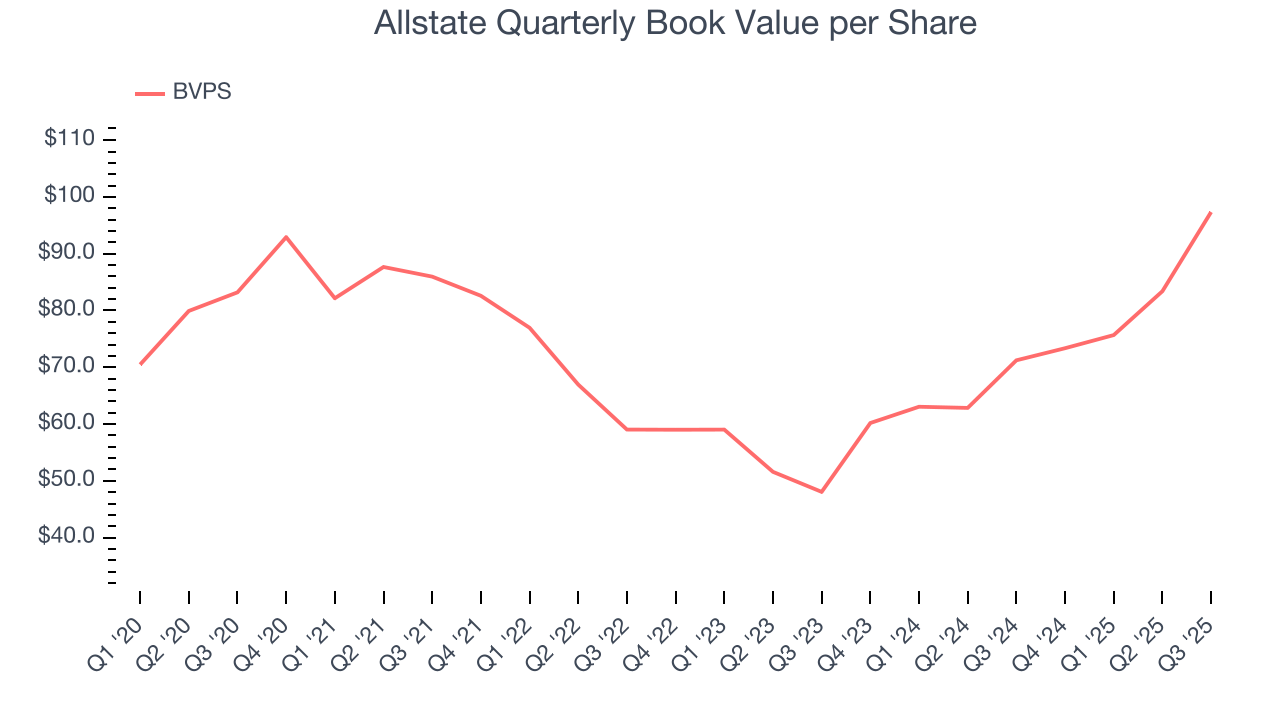
Over the next 12 months, Consensus estimates call for Allstate’s BVPS to grow by 9.2% to $94.20, mediocre growth rate.
10. Balance Sheet Assessment
The debt-to-equity ratio is a widely used measure to assess a company's balance sheet health. A higher ratio means that a business aggressively financed its growth with debt. This can result in higher earnings (if the borrowed funds are invested profitably) but also increases risk.
If debt levels are too high, there could be difficulties in meeting obligations, especially during economic downturns or periods of rising interest rates if the debt has variable-rate payments.
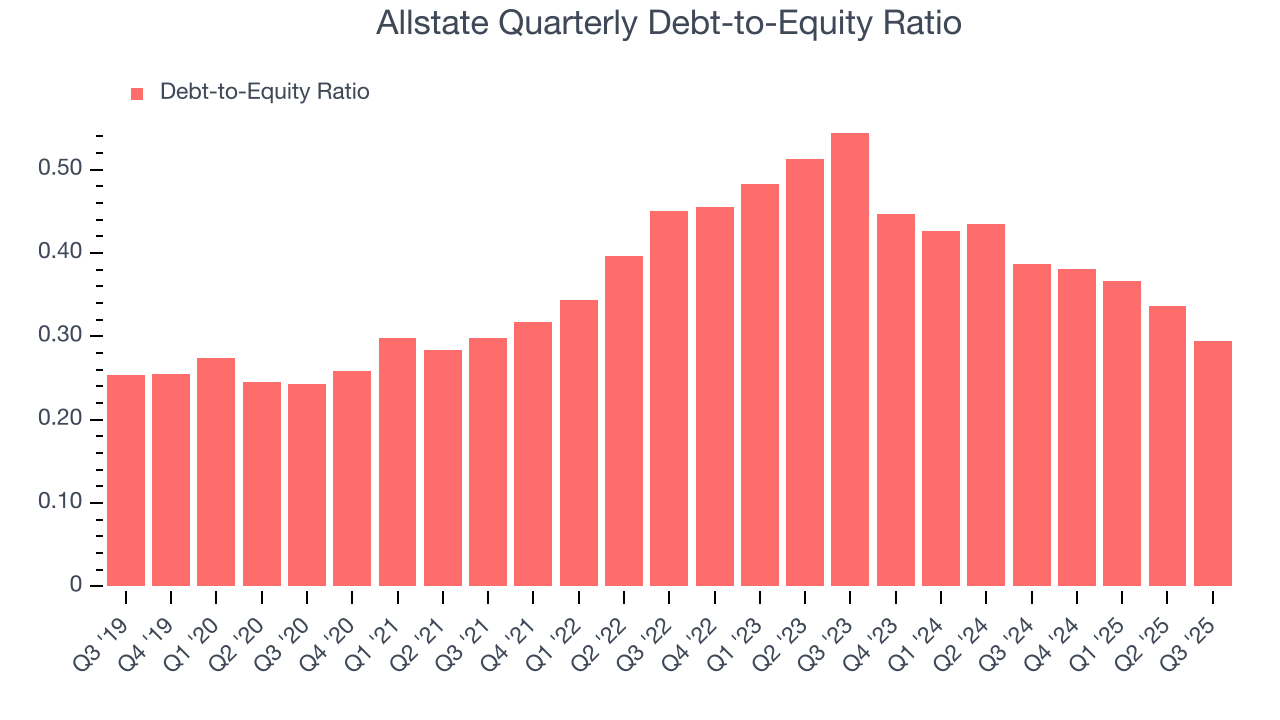
Allstate currently has $8.09 billion of debt and $27.51 billion of shareholder's equity on its balance sheet, and over the past four quarters, has averaged a debt-to-equity ratio of 0.3×. We think this is safe and raises no red flags. In general, we’re comfortable with any ratio below 1.0× for an insurance business. Anything below 0.5× is a bonus.
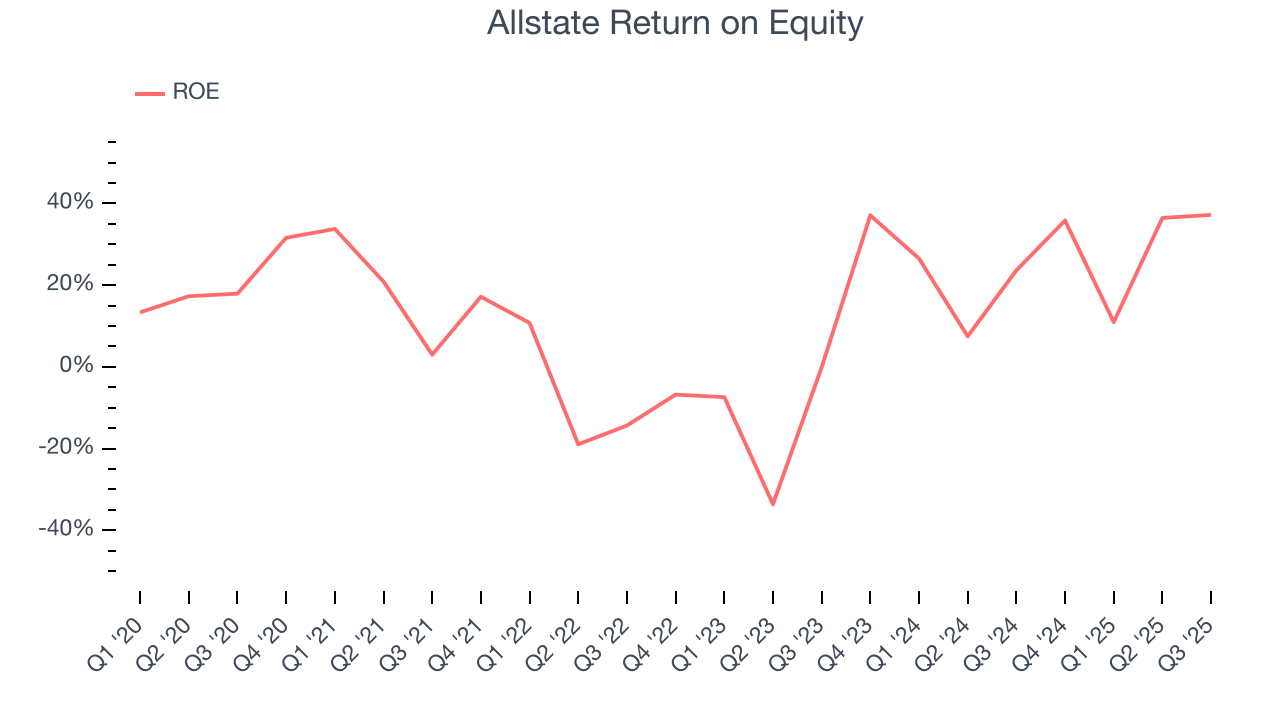
11. Return on Equity
Return on equity (ROE) is a crucial yardstick for insurance companies, measuring their ability to generate returns on the capital provided by shareholders. Insurers that consistently deliver superior ROE tend to create more value for their investors over time through strategic capital allocation and shareholder-friendly policies.
Over the last five years, Allstate has averaged an ROE of 12.6%, respectable for a company operating in a sector where the average shakes out around 12.5% and those putting up 20%+ are greatly admired.
12. Key Takeaways from Allstate’s Q3 Results
It was good to see Allstate beat analysts’ EPS expectations this quarter. We were also excited its net premiums earned outperformed Wall Street’s estimates by a wide margin. Zooming out, we think this was a solid print. The stock traded up 1.5% to $197.80 immediately after reporting.
13. Is Now The Time To Buy Allstate?
Updated: January 24, 2026 at 11:26 PM EST
The latest quarterly earnings matters, sure, but we actually think longer-term fundamentals and valuation matter more. Investors should consider all these pieces before deciding whether or not to invest in Allstate.
Allstate doesn’t top our investment wishlist, but we understand that it’s not a bad business. To kick things off, its revenue growth was solid over the last five years. And while Allstate’s projected EPS for the next year is lacking, its estimated BVPS growth for the next 12 months is great.
Allstate’s P/B ratio based on the next 12 months is 1.8x. While this valuation is reasonable, we don’t really see a big opportunity at the moment. We're fairly confident there are better stocks to buy right now.
Wall Street analysts have a consensus one-year price target of $236.76 on the company (compared to the current share price of $193.68).