
Allegion (ALLE)
Allegion doesn’t impress us. Its poor sales growth and falling returns on capital suggest its growth opportunities are shrinking.― StockStory Analyst Team
1. News
2. Summary
Why Allegion Is Not Exciting
Allegion plc (NYSE:ALLE) is a provider of security products and solutions that keep people and assets safe and secure in various environments.
- Organic sales performance over the past two years indicates the company may need to make strategic adjustments or rely on M&A to catalyze faster growth
- Estimated sales growth of 6.1% for the next 12 months is soft and implies weaker demand
- On the plus side, its disciplined cost controls and effective management have materialized in a strong operating margin, and it turbocharged its profits by achieving some fixed cost leverage


Allegion lacks the business quality we seek. Our attention is focused on better businesses.
Why There Are Better Opportunities Than Allegion


Allegion’s stock price of $165.38 implies a valuation ratio of 20.4x forward P/E. Allegion’s valuation may seem like a bargain, especially when stacked up against other industrials companies. We remind you that you often get what you pay for, though.
Cheap stocks can look like great bargains at first glance, but you often get what you pay for. These mediocre businesses often have less earnings power, meaning there is more reliance on a re-rating to generate good returns - an unlikely scenario for low-quality companies.
3. Allegion (ALLE) Research Report: Q4 CY2025 Update
Security hardware provider Allegion (NYSE:ALLE) met Wall Street’s revenue expectations in Q4 CY2025, with sales up 9.3% year on year to $1.03 billion. Its non-GAAP profit of $1.94 per share was 2% below analysts’ consensus estimates.
Allegion (ALLE) Q4 CY2025 Highlights:
- Revenue: $1.03 billion vs analyst estimates of $1.04 billion (9.3% year-on-year growth, in line)
- Adjusted EPS: $1.94 vs analyst expectations of $1.98 (2% miss)
- Adjusted EBITDA: $248.2 million vs analyst estimates of $269.4 million (24% margin, 7.9% miss)
- Adjusted EPS guidance for the upcoming financial year 2026 is $8.80 at the midpoint, missing analyst estimates by 0.6%
- Operating Margin: 20.3%, in line with the same quarter last year
- Free Cash Flow Margin: 19.4%, down from 20.6% in the same quarter last year
- Organic Revenue rose 3.3% year on year (miss)
- Market Capitalization: $15.44 billion
Company Overview
Allegion plc (NYSE:ALLE) is a provider of security products and solutions that keep people and assets safe and secure in various environments.
Allegion offers an extensive portfolio of security and access control products across a range of market-leading brands, serving commercial, institutional, and residential markets. The company's product offerings include locks, locksets, portable locks, key systems, electronic security products, time and attendance systems, door controls, exit devices, doors and accessories, and various services and software solutions.
Allegion operates through two main segments: Allegion Americas and Allegion International. The Americas segment focuses on North and South America, while the International segment covers Europe, Asia, and Oceania.
The largest portion of revenue comes from locks, locksets, and key systems, followed by electronic security products and access control systems. Additionally, Allegion has been expanding its service and software offerings, which provide a growing stream of recurring revenue. The company primarily sells through distribution and retail channels, including specialty distributors, e-commerce platforms, and wholesalers. Allegion also sells directly to end-users through some of its businesses, such as Access Technologies and Interflex.
A recent acquisition for the company is that of Stanley Access Technologies in 2022 expanded Allegion's presence in the automatic entrance solutions market.
4. Electrical Systems
Like many equipment and component manufacturers, electrical systems companies are buoyed by secular trends such as connectivity and industrial automation. More specific pockets of strong demand include Internet of Things (IoT) connectivity and the 5G telecom upgrade cycle, which can benefit companies whose cables and conduits fit those needs. But like the broader industrials sector, these companies are also at the whim of economic cycles. Interest rates, for example, can greatly impact projects that drive demand for these products.
Competitors in the security solutions industry include ASSA ABLOY (OTC:ASAZY), Fortune Brands (NYSE:FBHS), and Stanley Black & Decker (NYSE:SWK)
5. Revenue Growth
A company’s long-term sales performance can indicate its overall quality. Even a bad business can shine for one or two quarters, but a top-tier one grows for years. Luckily, Allegion’s sales grew at a decent 8.4% compounded annual growth rate over the last five years. Its growth was slightly above the average industrials company and shows its offerings resonate with customers.
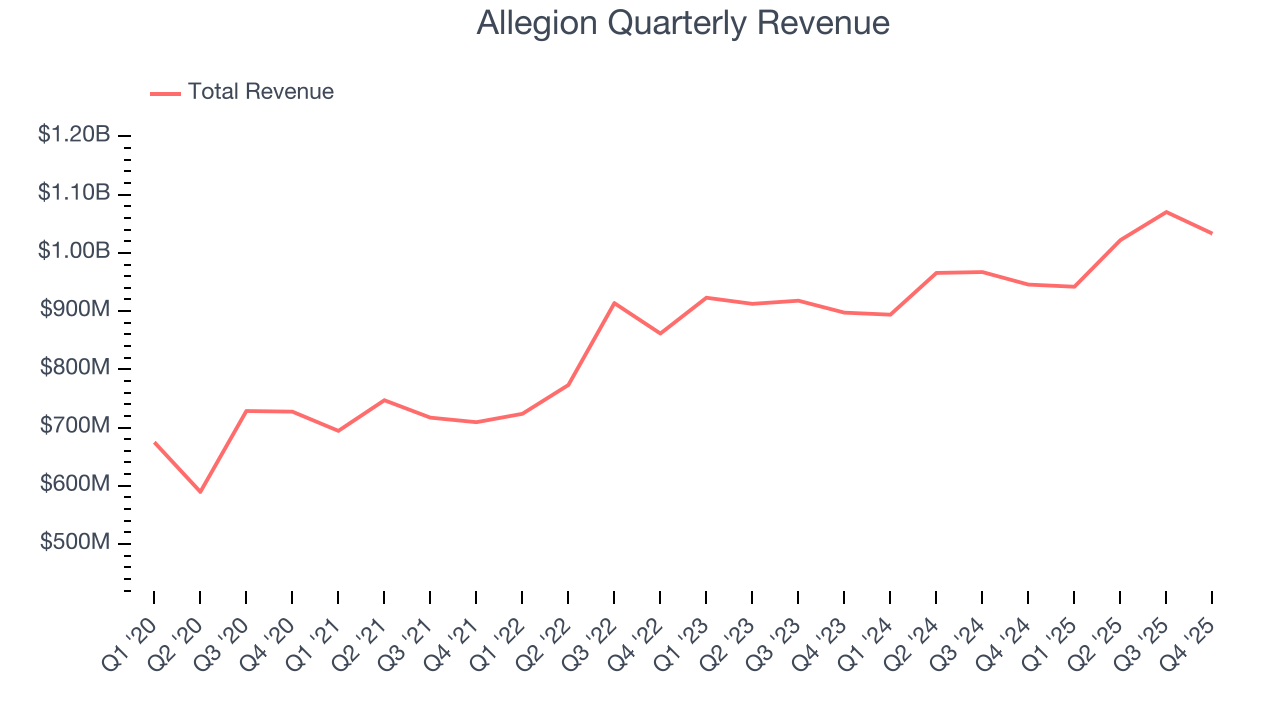
We at StockStory place the most emphasis on long-term growth, but within industrials, a half-decade historical view may miss cycles, industry trends, or a company capitalizing on catalysts such as a new contract win or a successful product line. Allegion’s recent performance shows its demand has slowed as its annualized revenue growth of 5.6% over the last two years was below its five-year trend. We’re wary when companies in the sector see decelerations in revenue growth, as it could signal changing consumer tastes aided by low switching costs. 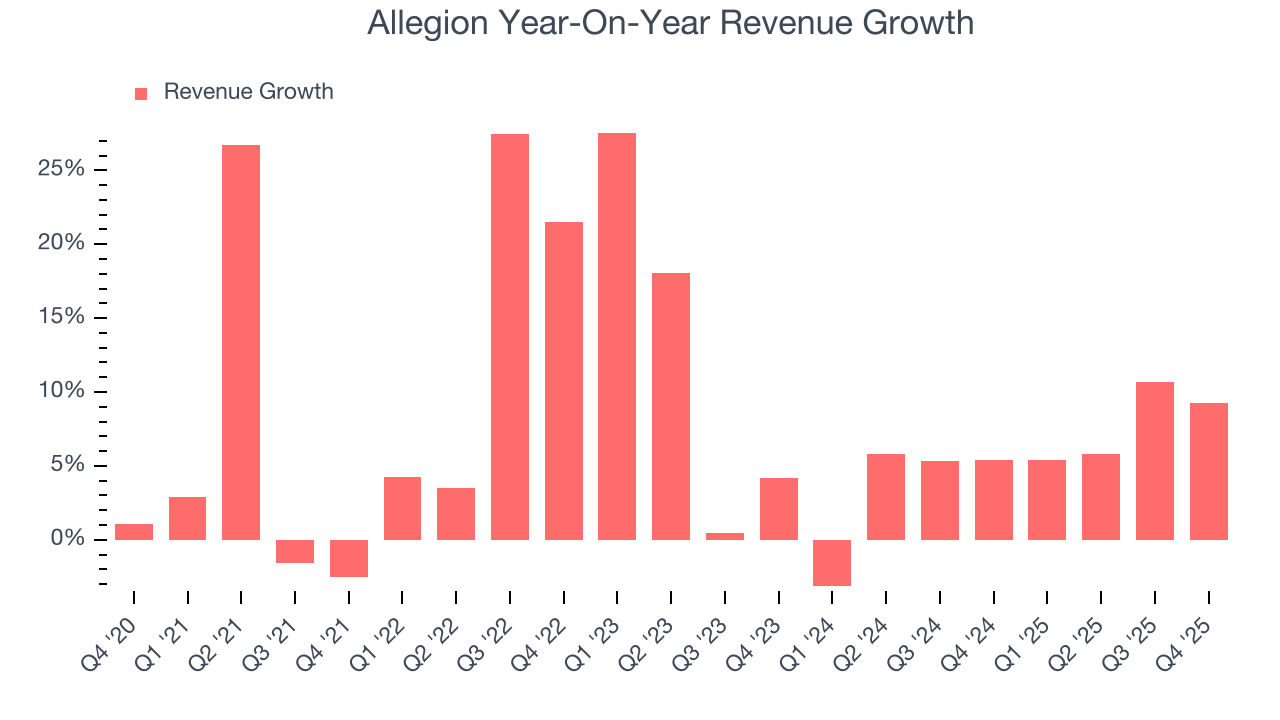
We can better understand the company’s sales dynamics by analyzing its organic revenue, which strips out one-time events like acquisitions and currency fluctuations that don’t accurately reflect its fundamentals. Over the last two years, Allegion’s organic revenue averaged 3.1% year-on-year growth. Because this number is lower than its two-year revenue growth, we can see that some mixture of acquisitions and foreign exchange rates boosted its headline results. 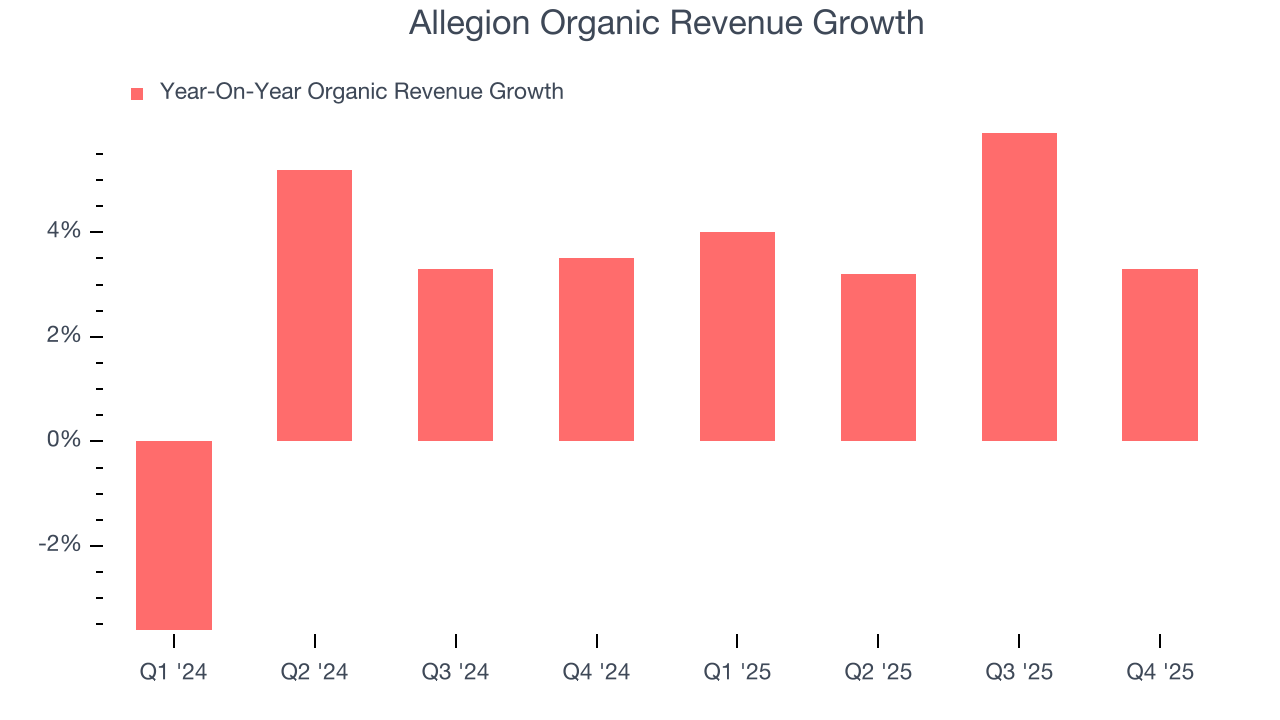
This quarter, Allegion grew its revenue by 9.3% year on year, and its $1.03 billion of revenue was in line with Wall Street’s estimates.
Looking ahead, sell-side analysts expect revenue to grow 5.9% over the next 12 months, similar to its two-year rate. This projection is underwhelming and indicates its newer products and services will not accelerate its top-line performance yet.
6. Gross Margin & Pricing Power
At StockStory, we prefer high gross margin businesses because they indicate the company has pricing power or differentiated products, giving it a chance to generate higher operating profits.
Allegion has best-in-class unit economics for an industrials company, enabling it to invest in areas such as research and development. Its margin also signals it sells differentiated products, not commodities. As you can see below, it averaged an elite 43.2% gross margin over the last five years. Said differently, roughly $43.20 was left to spend on selling, marketing, R&D, and general administrative overhead for every $100 in revenue. 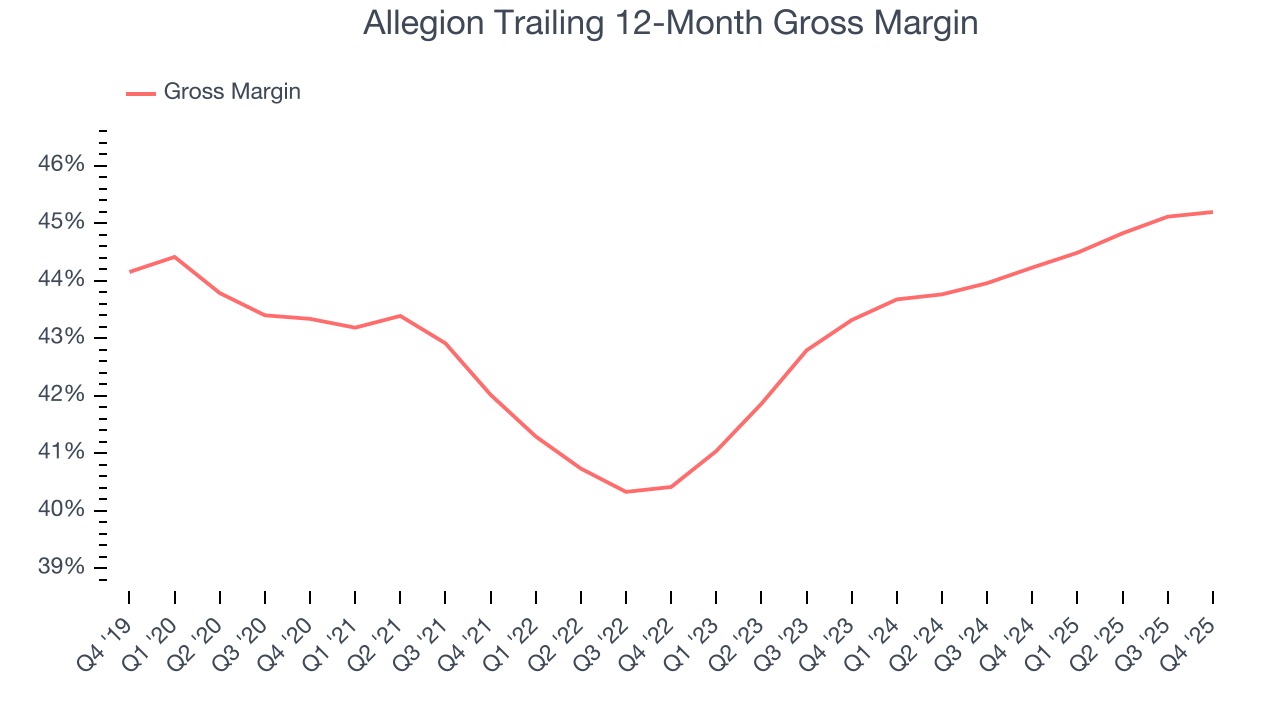
Allegion’s gross profit margin came in at 44.5% this quarter, in line with the same quarter last year. On a wider time horizon, the company’s full-year margin has remained steady over the past four quarters, suggesting its input costs (such as raw materials and manufacturing expenses) have been stable and it isn’t under pressure to lower prices.
7. Operating Margin
Operating margin is an important measure of profitability as it shows the portion of revenue left after accounting for all core expenses – everything from the cost of goods sold to advertising and wages. It’s also useful for comparing profitability across companies with different levels of debt and tax rates because it excludes interest and taxes.
Allegion has been a well-oiled machine over the last five years. It demonstrated elite profitability for an industrials business, boasting an average operating margin of 19.7%. This result isn’t surprising as its high gross margin gives it a favorable starting point.
Analyzing the trend in its profitability, Allegion’s operating margin rose by 2.6 percentage points over the last five years, as its sales growth gave it operating leverage.
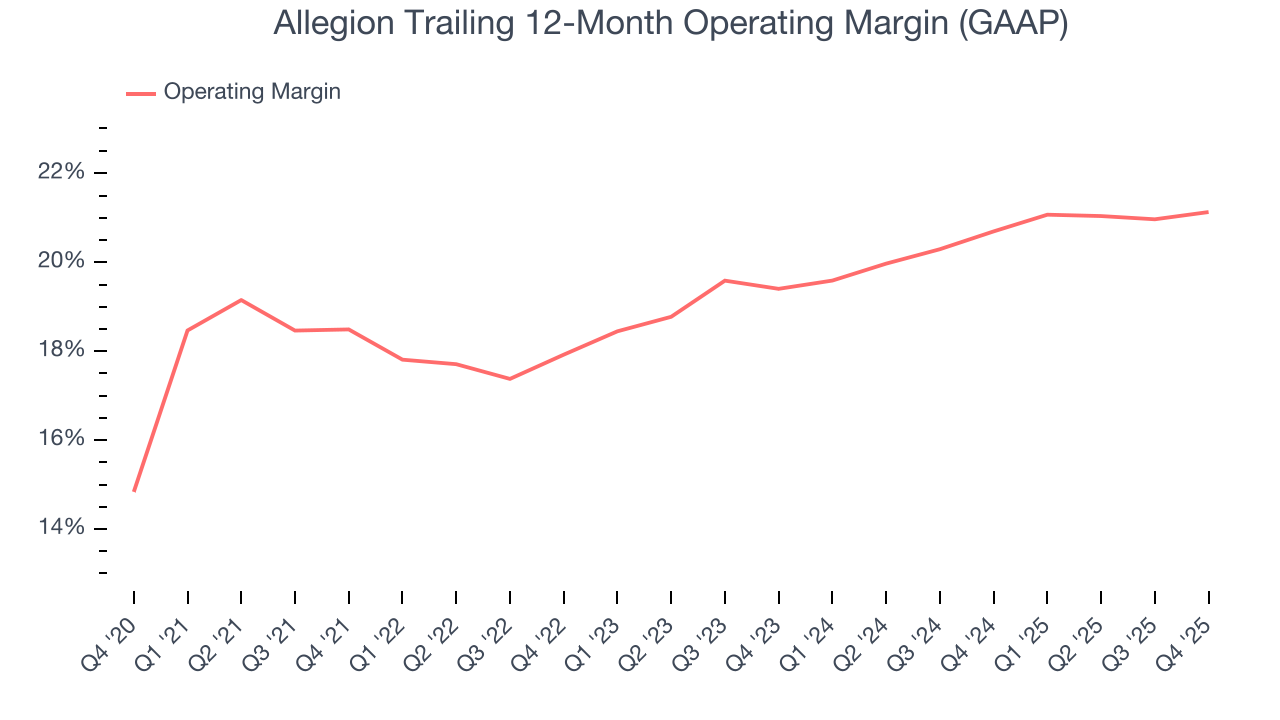
This quarter, Allegion generated an operating margin profit margin of 20.3%, in line with the same quarter last year. This indicates the company’s cost structure has recently been stable.
8. Earnings Per Share
Revenue trends explain a company’s historical growth, but the long-term change in earnings per share (EPS) points to the profitability of that growth – for example, a company could inflate its sales through excessive spending on advertising and promotions.
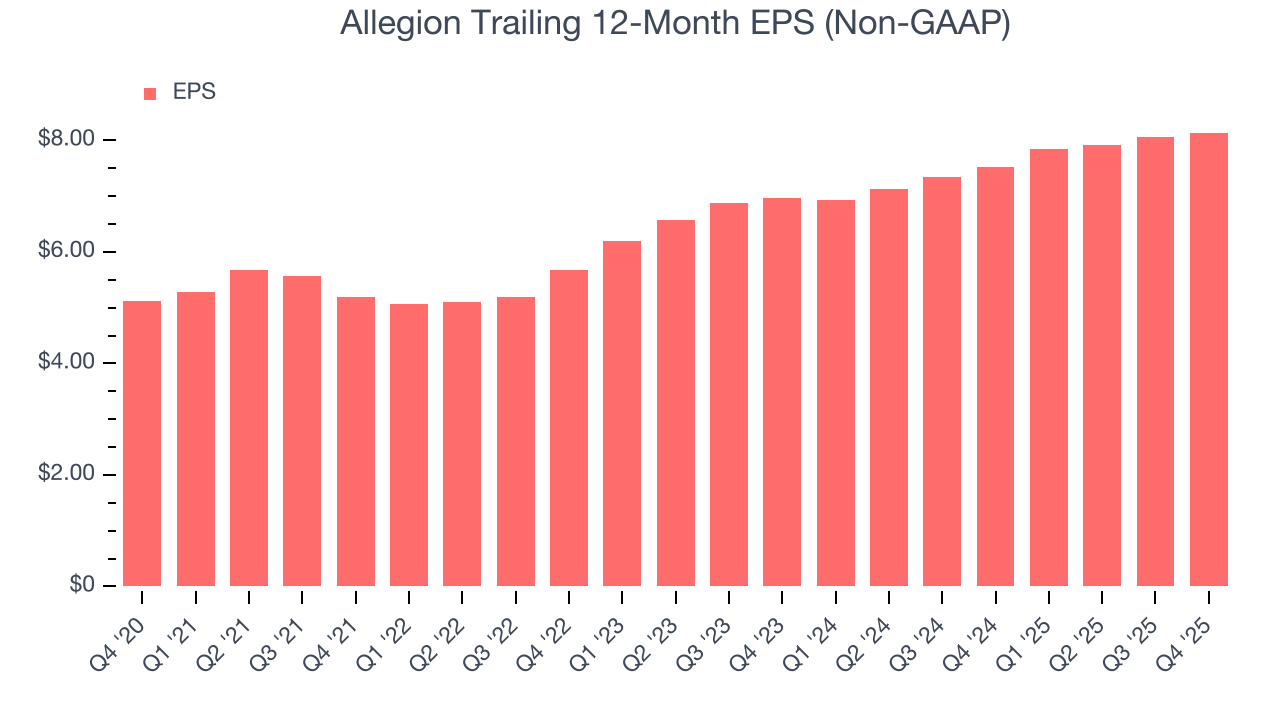
Allegion’s decent 9.7% annual EPS growth over the last five years aligns with its revenue performance. This tells us its incremental sales were profitable.
Like with revenue, we analyze EPS over a shorter period to see if we are missing a change in the business.
Allegion’s two-year annual EPS growth of 8.1% was decent and topped its 5.6% two-year revenue growth.
We can take a deeper look into Allegion’s earnings quality to better understand the drivers of its performance. While we mentioned earlier that Allegion’s operating margin was flat this quarter, a two-year view shows its margin has expandedwhile its share count has shrunk 1.8%. These are positive signs for shareholders because improving profitability and share buybacks turbocharge EPS growth relative to revenue growth. 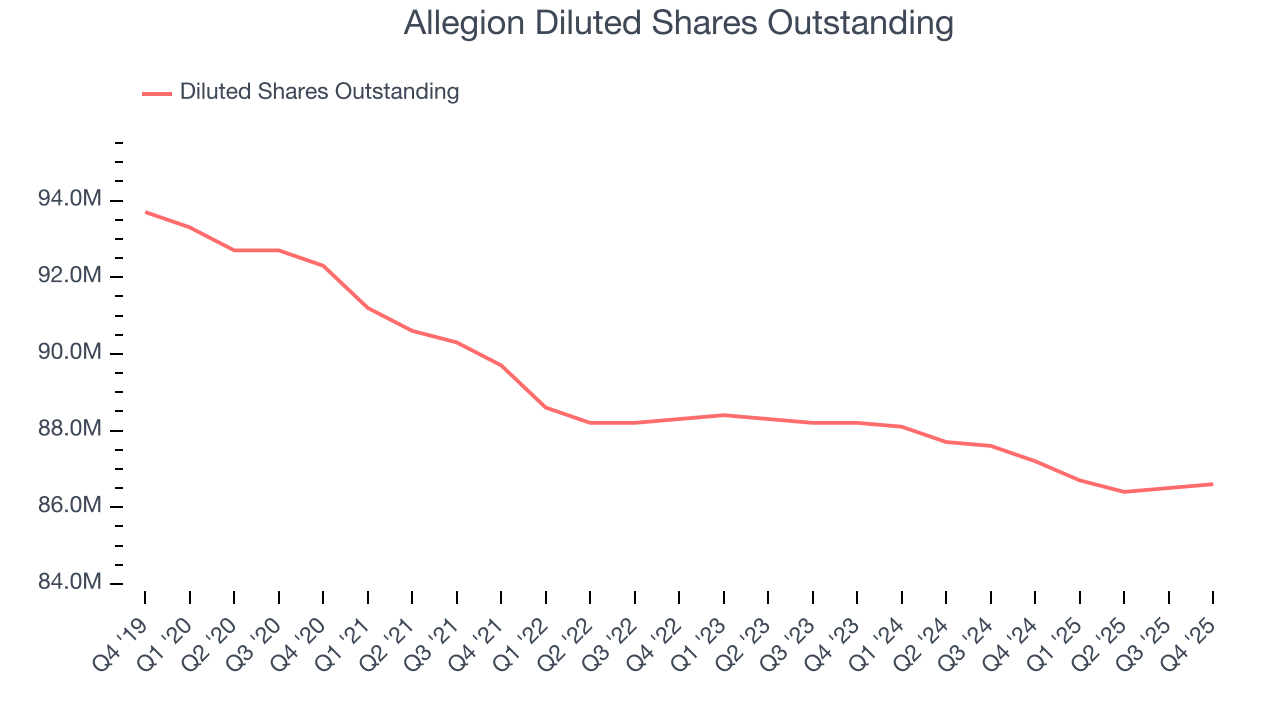
In Q4, Allegion reported adjusted EPS of $1.94, up from $1.86 in the same quarter last year. Despite growing year on year, this print missed analysts’ estimates, but we care more about long-term adjusted EPS growth than short-term movements. Over the next 12 months, Wall Street expects Allegion’s full-year EPS of $8.14 to grow 8.1%.
9. Cash Is King
Free cash flow isn't a prominently featured metric in company financials and earnings releases, but we think it's telling because it accounts for all operating and capital expenses, making it tough to manipulate. Cash is king.
Allegion has shown terrific cash profitability, putting it in an advantageous position to invest in new products, return capital to investors, and consolidate the market during industry downturns. The company’s free cash flow margin was among the best in the industrials sector, averaging 14.9% over the last five years.
Taking a step back, we can see that Allegion’s margin expanded by 1.4 percentage points during that time. This is encouraging because it gives the company more optionality.
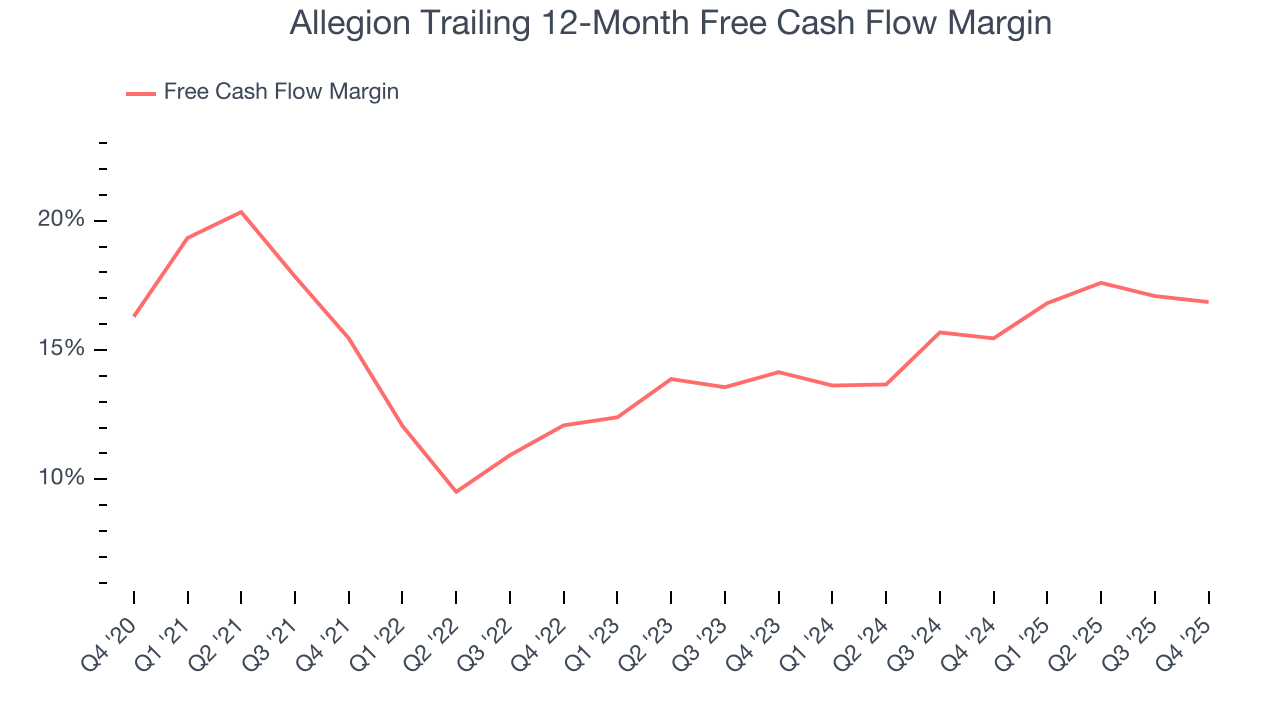
Allegion’s free cash flow clocked in at $200.5 million in Q4, equivalent to a 19.4% margin. The company’s cash profitability regressed as it was 1.2 percentage points lower than in the same quarter last year, but it’s still above its five-year average. We wouldn’t read too much into this quarter’s decline because investment needs can be seasonal, leading to short-term swings. Long-term trends are more important.
10. Return on Invested Capital (ROIC)
EPS and free cash flow tell us whether a company was profitable while growing its revenue. But was it capital-efficient? Enter ROIC, a metric showing how much operating profit a company generates relative to the money it has raised (debt and equity).
Although Allegion hasn’t been the highest-quality company lately, it found a few growth initiatives in the past that worked out wonderfully. Its five-year average ROIC was 22.7%, splendid for an industrials business.
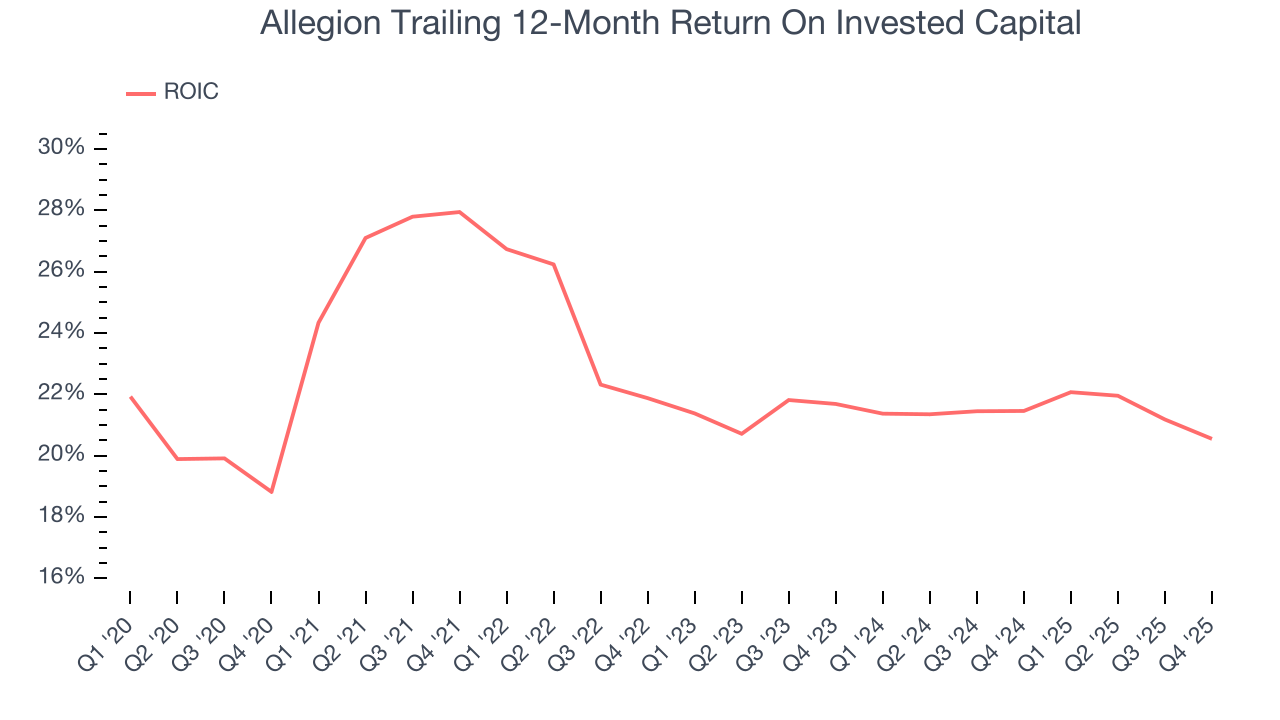
We like to invest in businesses with high returns, but the trend in a company’s ROIC is what often surprises the market and moves the stock price. Unfortunately, Allegion’s ROIC averaged 3.9 percentage point decreases each year over the last few years. We like what management has done in the past, but its declining returns are perhaps a symptom of fewer profitable growth opportunities.
11. Balance Sheet Assessment
Allegion reported $356.2 million of cash and $1.98 billion of debt on its balance sheet in the most recent quarter. As investors in high-quality companies, we primarily focus on two things: 1) that a company’s debt level isn’t too high and 2) that its interest payments are not excessively burdening the business.
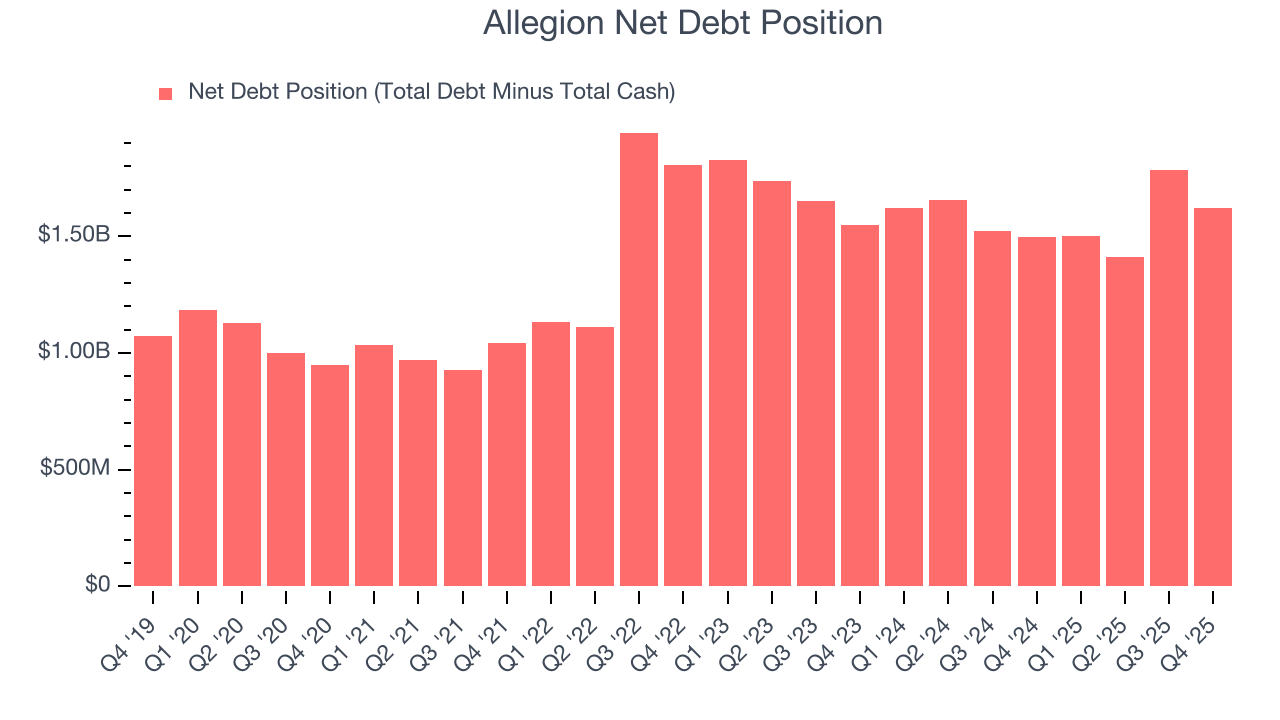
With $1.01 billion of EBITDA over the last 12 months, we view Allegion’s 1.6× net-debt-to-EBITDA ratio as safe. We also see its $40.5 million of annual interest expenses as appropriate. The company’s profits give it plenty of breathing room, allowing it to continue investing in growth initiatives.
12. Key Takeaways from Allegion’s Q4 Results
We struggled to find many positives in these results. Its EBITDA missed and its EPS fell short of Wall Street’s estimates. Overall, this was a weaker quarter. The stock traded down 4.2% to $172.00 immediately following the results.
13. Is Now The Time To Buy Allegion?
Updated: February 17, 2026 at 10:52 PM EST
We think that the latest earnings result is only one piece of the bigger puzzle. If you’re deciding whether to own Allegion, you should also grasp the company’s longer-term business quality and valuation.
Allegion has some positive attributes, but it isn’t one of our picks. First off, its revenue growth was good over the last five years. And while Allegion’s diminishing returns show management's prior bets haven't worked out, its impressive operating margins show it has a highly efficient business model.
Allegion’s P/E ratio based on the next 12 months is 20.4x. While this valuation is reasonable, we don’t really see a big opportunity at the moment. We're pretty confident there are superior stocks to buy right now.
Wall Street analysts have a consensus one-year price target of $180.36 on the company (compared to the current share price of $165.38).