
A. O. Smith (AOS)
We aren’t fans of A. O. Smith. Its poor sales growth and falling returns on capital suggest its growth opportunities are shrinking.― StockStory Analyst Team
1. News


2. Summary
Why We Think A. O. Smith Will Underperform
Credited with the invention of the glass-lined water heater, A.O. Smith (NYSE:AOS) manufactures water heating and treatment products for various industries.
- Estimated sales growth of 3.6% for the next 12 months is soft and implies weaker demand
- Annual revenue growth of 5.8% over the last five years was below our standards for the industrials sector
- A silver lining is that its healthy operating margin shows it’s a well-run company with efficient processes, and its operating leverage amplified its profits over the last five years


A. O. Smith doesn’t meet our quality standards. Better businesses are for sale in the market.
Why There Are Better Opportunities Than A. O. Smith


A. O. Smith is trading at $64.41 per share, or 16.1x forward P/E. A. O. Smith’s valuation may seem like a bargain, especially when stacked up against other industrials companies. We remind you that you often get what you pay for, though.
We’d rather pay up for companies with elite fundamentals than get a bargain on weak ones. Cheap stocks can be value traps, and as their performance deteriorates, they will stay cheap or get even cheaper.
3. A. O. Smith (AOS) Research Report: Q4 CY2025 Update
Water heating and treatment solutions company A.O. Smith (NYSE:AOS) fell short of the markets revenue expectations in Q4 CY2025, with sales flat year on year at $912.5 million. The company’s full-year revenue guidance of $3.96 billion at the midpoint came in 1.3% below analysts’ estimates. Its GAAP profit of $0.90 per share was 6.4% above analysts’ consensus estimates.
A. O. Smith (AOS) Q4 CY2025 Highlights:
- Revenue: $912.5 million vs analyst estimates of $926.8 million (flat year on year, 1.5% miss)
- EPS (GAAP): $0.90 vs analyst estimates of $0.85 (6.4% beat)
- Adjusted EBITDA: $199.9 million vs analyst estimates of $181.1 million (21.9% margin, 10.4% beat)
- EPS (GAAP) guidance for the upcoming financial year 2026 is $4 at the midpoint, missing analyst estimates by 1.2%
- Operating Margin: 18%, up from 15.2% in the same quarter last year
- Free Cash Flow Margin: 18.1%, down from 21% in the same quarter last year
- Market Capitalization: $9.68 billion
Company Overview
Credited with the invention of the glass-lined water heater, A.O. Smith (NYSE:AOS) manufactures water heating and treatment products for various industries.
The company addresses global water challenges by providing water heating and treatment solutions. Its products ensure access to clean and hot water for homes, businesses, and industries, which promotes the health, hygiene, and comfort levels of its customers.
The company’s products can be separated into two primary categories: water heating products and water treatment products. Its water heating products include gas and electric water heaters for residential uses and heavy-duty water heaters for commercial uses. Its water treatment products include water softeners, which are designed to reduce the “hardness” of the water (“water hardness” is a measure of the amount of dissolved calcium and magnesium in the water), and water filtration and purification products, which are designed to improve drinking water quality.
The company generates revenue through the sale of its products. A notable portion of its revenue is generated via sales in China, Europe and India, so it has international revenue generation, but North America makes up the majority of its revenue. The company relies on demand from the residential and commercial construction market for water heating and treatment solutions, so it has a simple business model.
4. HVAC and Water Systems
Many HVAC and water systems companies sell essential, non-discretionary infrastructure for buildings. Since the useful lives of these water heaters and vents are fairly standard, these companies have a portion of predictable replacement revenue. In the last decade, trends in energy efficiency and clean water are driving innovation that is leading to incremental demand. On the other hand, new installations for these companies are at the whim of residential and commercial construction volumes, which tend to be cyclical and can be impacted heavily by economic factors such as interest rates.
Competitors with the same product offers and market as A.O. Smith include Watts Water Technologies (NYSE:WTS), and privately-held companies Rheem Manufacturing and Vaillant.
5. Revenue Growth
Examining a company’s long-term performance can provide clues about its quality. Even a bad business can shine for one or two quarters, but a top-tier one grows for years. Unfortunately, A. O. Smith’s 5.8% annualized revenue growth over the last five years was tepid. This was below our standard for the industrials sector and is a rough starting point for our analysis.
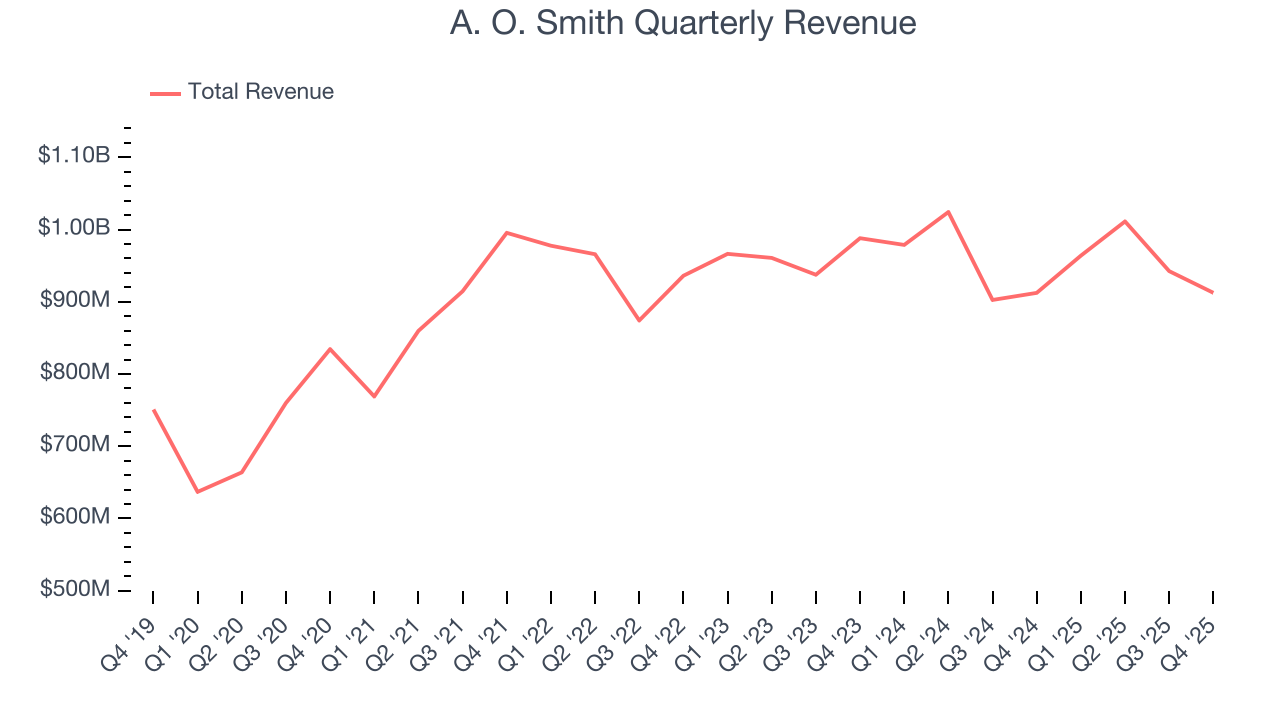
We at StockStory place the most emphasis on long-term growth, but within industrials, a half-decade historical view may miss cycles, industry trends, or a company capitalizing on catalysts such as a new contract win or a successful product line. A. O. Smith’s recent performance shows its demand has slowed as its revenue was flat over the last two years. 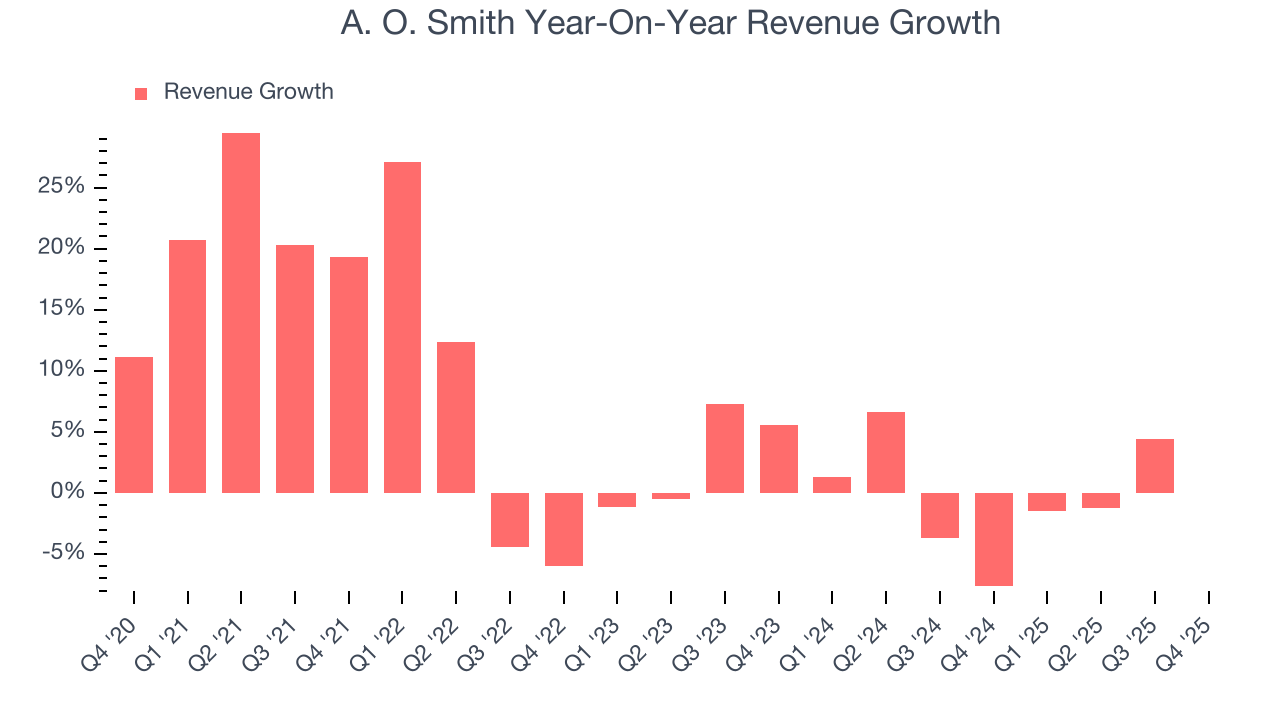
This quarter, A. O. Smith’s $912.5 million of revenue was flat year on year, falling short of Wall Street’s estimates.
Looking ahead, sell-side analysts expect revenue to grow 5% over the next 12 months. Although this projection suggests its newer products and services will spur better top-line performance, it is still below the sector average.
6. Gross Margin & Pricing Power
A. O. Smith’s unit economics are great compared to the broader industrials sector and signal that it enjoys product differentiation through quality or brand. As you can see below, it averaged an excellent 37.6% gross margin over the last five years. Said differently, roughly $37.61 was left to spend on selling, marketing, R&D, and general administrative overhead for every $100 in revenue. 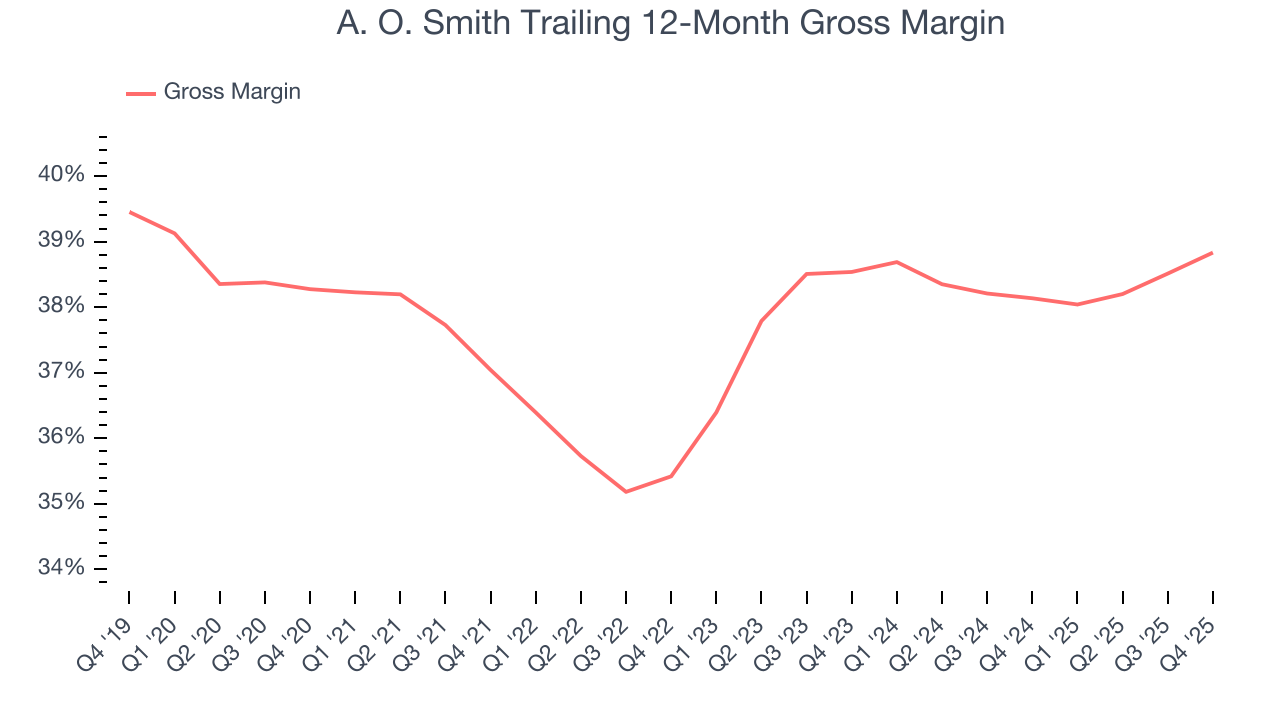
In Q4, A. O. Smith produced a 38.4% gross profit margin, up 1.3 percentage points year on year. On a wider time horizon, the company’s full-year margin has remained steady over the past four quarters, suggesting its input costs (such as raw materials and manufacturing expenses) have been stable and it isn’t under pressure to lower prices.
7. Operating Margin
A. O. Smith has been a well-oiled machine over the last five years. It demonstrated elite profitability for an industrials business, boasting an average operating margin of 18.1%. This result isn’t surprising as its high gross margin gives it a favorable starting point.
Analyzing the trend in its profitability, A. O. Smith’s operating margin rose by 1.8 percentage points over the last five years, as its sales growth gave it operating leverage.
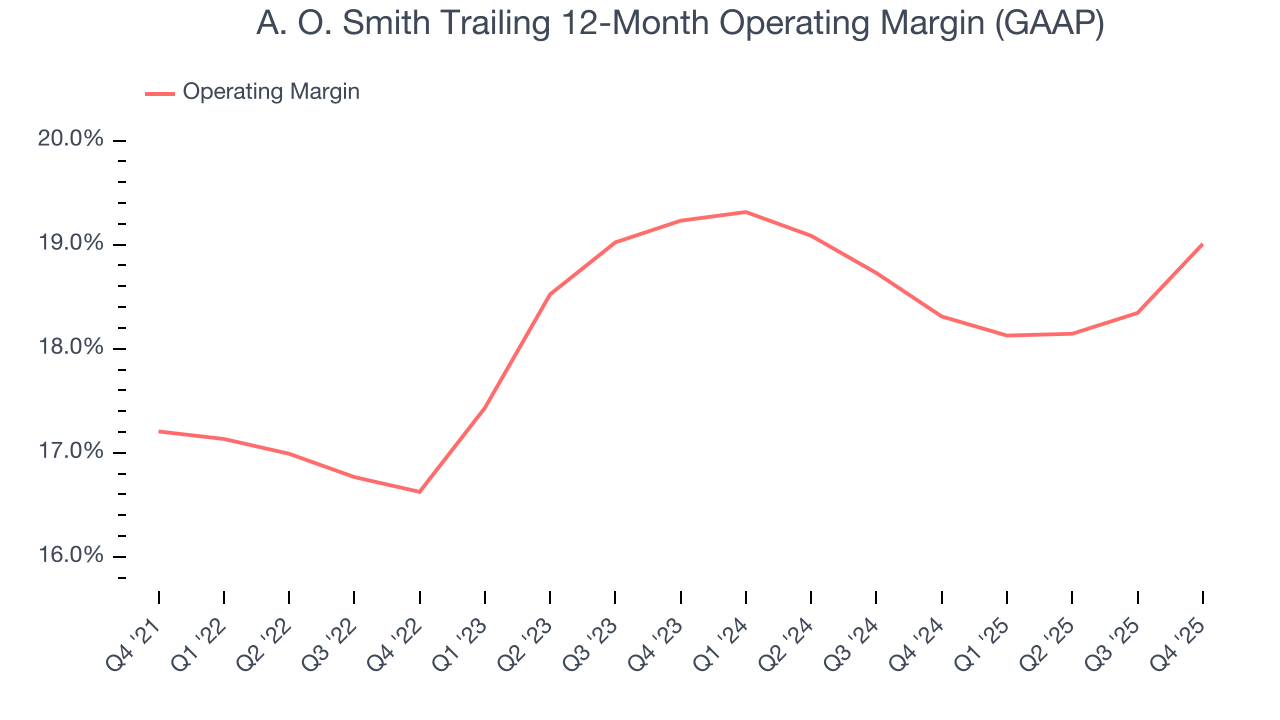
In Q4, A. O. Smith generated an operating margin profit margin of 18%, up 2.8 percentage points year on year. The increase was encouraging, and because its operating margin rose more than its gross margin, we can infer it was more efficient with expenses such as marketing, R&D, and administrative overhead.
8. Earnings Per Share
We track the long-term change in earnings per share (EPS) for the same reason as long-term revenue growth. Compared to revenue, however, EPS highlights whether a company’s growth is profitable.
A. O. Smith’s EPS grew at a remarkable 12.7% compounded annual growth rate over the last five years, higher than its 5.8% annualized revenue growth. This tells us the company became more profitable on a per-share basis as it expanded.
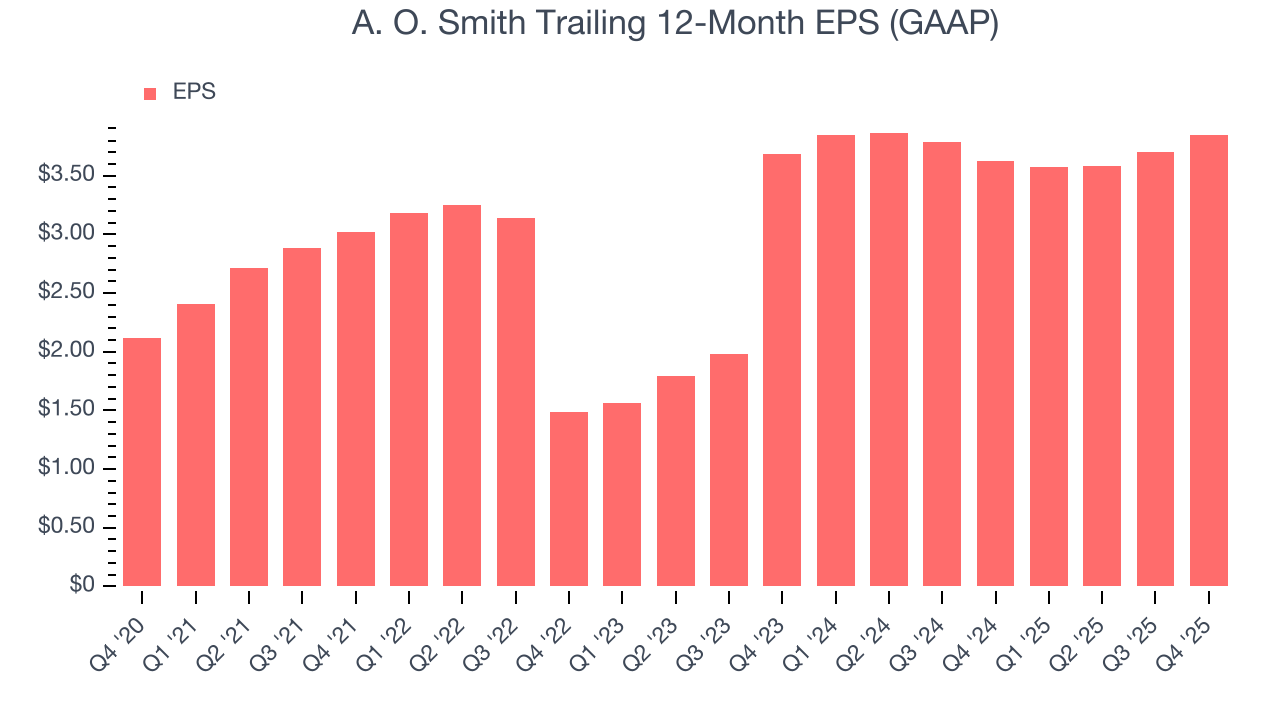
Diving into the nuances of A. O. Smith’s earnings can give us a better understanding of its performance. As we mentioned earlier, A. O. Smith’s operating margin expanded by 1.8 percentage points over the last five years. On top of that, its share count shrank by 14.1%. These are positive signs for shareholders because improving profitability and share buybacks turbocharge EPS growth relative to revenue growth. 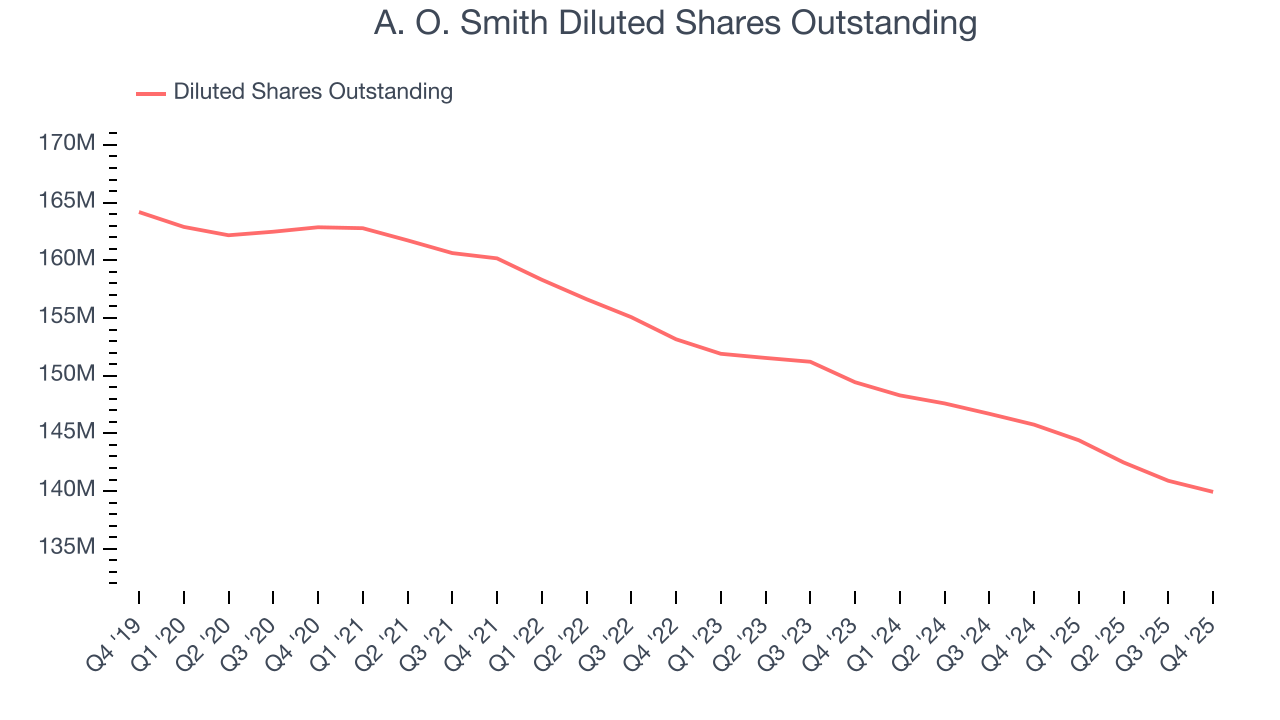
Like with revenue, we analyze EPS over a shorter period to see if we are missing a change in the business.
For A. O. Smith, its two-year annual EPS growth of 2.2% was lower than its five-year trend. We hope its growth can accelerate in the future.
In Q4, A. O. Smith reported EPS of $0.90, up from $0.75 in the same quarter last year. This print beat analysts’ estimates by 6.4%. Over the next 12 months, Wall Street expects A. O. Smith’s full-year EPS of $3.85 to grow 8.5%.
9. Cash Is King
If you’ve followed StockStory for a while, you know we emphasize free cash flow. Why, you ask? We believe that in the end, cash is king, and you can’t use accounting profits to pay the bills.
A. O. Smith has shown terrific cash profitability, putting it in an advantageous position to invest in new products, return capital to investors, and consolidate the market during industry downturns. The company’s free cash flow margin was among the best in the industrials sector, averaging 13.3% over the last five years.
Taking a step back, we can see that A. O. Smith’s margin dropped by 1.7 percentage points during that time. If its declines continue, it could signal increasing investment needs and capital intensity.
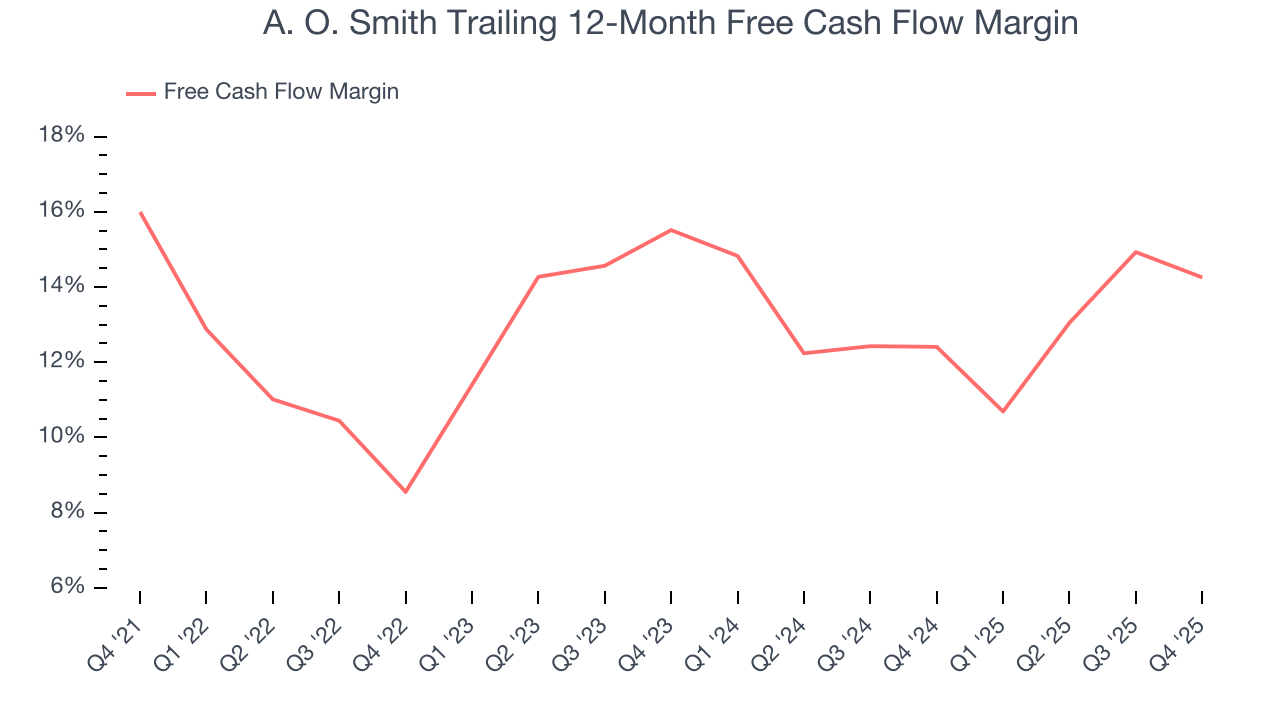
A. O. Smith’s free cash flow clocked in at $165.5 million in Q4, equivalent to a 18.1% margin. The company’s cash profitability regressed as it was 2.8 percentage points lower than in the same quarter last year, but it’s still above its five-year average. We wouldn’t read too much into this quarter’s decline because investment needs can be seasonal, leading to short-term swings. Long-term trends trump temporary fluctuations.
10. Return on Invested Capital (ROIC)
EPS and free cash flow tell us whether a company was profitable while growing its revenue. But was it capital-efficient? A company’s ROIC explains this by showing how much operating profit it makes compared to the money it has raised (debt and equity).
Although A. O. Smith hasn’t been the highest-quality company lately, it found a few growth initiatives in the past that worked out wonderfully. Its five-year average ROIC was 31.3%, splendid for an industrials business.
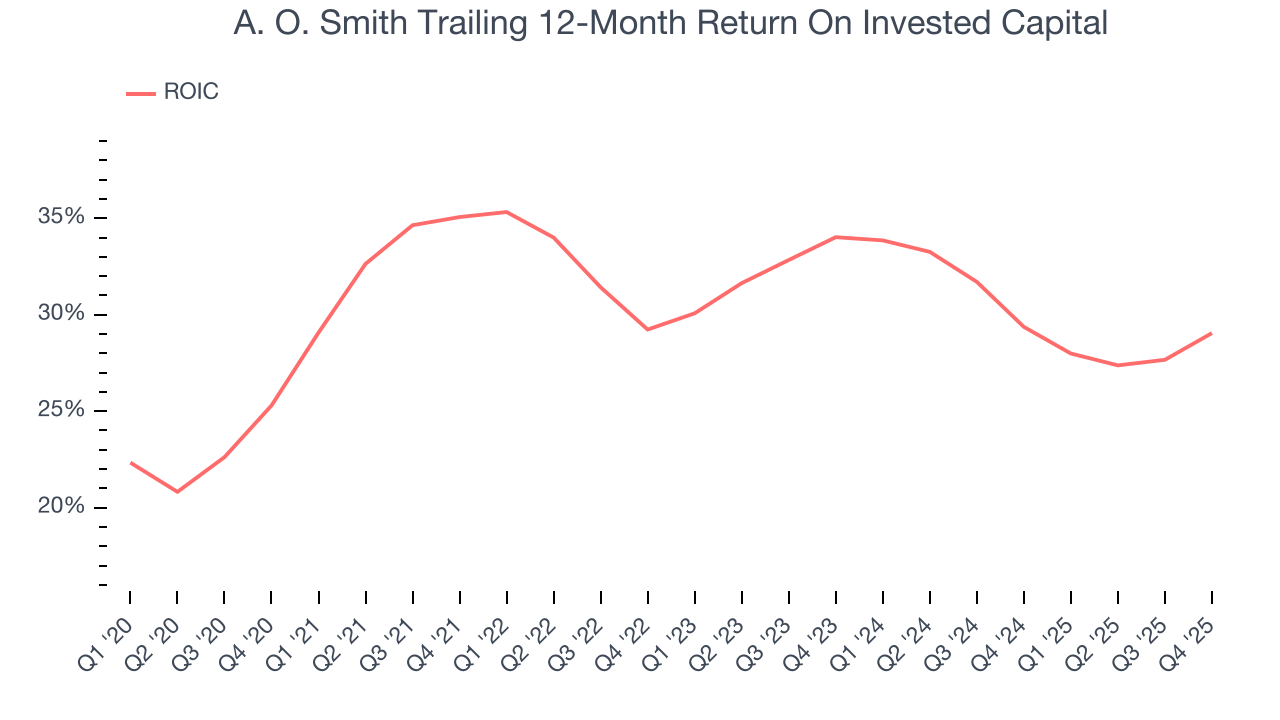
We like to invest in businesses with high returns, but the trend in a company’s ROIC is what often surprises the market and moves the stock price. Unfortunately, A. O. Smith’s ROIC averaged 2.9 percentage point decreases over the last few years. We like what management has done in the past, but its declining returns are perhaps a symptom of fewer profitable growth opportunities.
11. Balance Sheet Assessment
One of the best ways to mitigate bankruptcy risk is to hold more cash than debt.
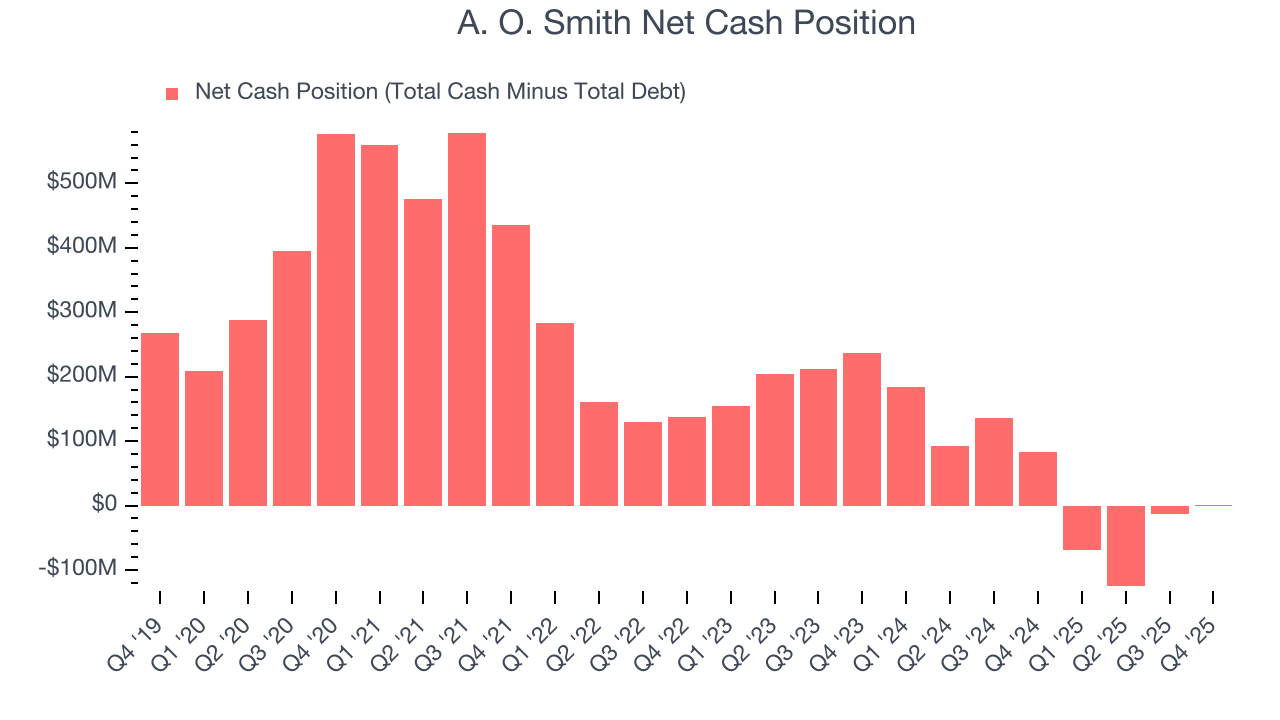
A. O. Smith is a profitable, well-capitalized company with $193.2 million of cash and $192.1 million of debt on its balance sheet. This $1.1 million net cash position gives it the freedom to borrow money, return capital to shareholders, or invest in growth initiatives. Leverage is not an issue here.
12. Key Takeaways from A. O. Smith’s Q4 Results
We were impressed by how significantly A. O. Smith blew past analysts’ EBITDA expectations this quarter. We were also glad its EPS outperformed Wall Street’s estimates. On the other hand, its revenue missed and its full-year revenue guidance fell slightly short of Wall Street’s estimates. Overall, this was a softer quarter. The stock traded down 2.3% to $67.93 immediately after reporting.
13. Is Now The Time To Buy A. O. Smith?
Updated: March 21, 2026 at 12:03 AM EDT
We think that the latest earnings result is only one piece of the bigger puzzle. If you’re deciding whether to own A. O. Smith, you should also grasp the company’s longer-term business quality and valuation.
A. O. Smith’s business quality ultimately falls short of our standards. For starters, its revenue growth was uninspiring over the last five years, and analysts expect its demand to deteriorate over the next 12 months. While its impressive operating margins show it has a highly efficient business model, the downside is its diminishing returns show management's prior bets haven't worked out. On top of that, its projected EPS for the next year is lacking.
A. O. Smith’s P/E ratio based on the next 12 months is 16.1x. This valuation multiple is fair, but we don’t have much faith in the company. We're pretty confident there are superior stocks to buy right now.
Wall Street analysts have a consensus one-year price target of $79.91 on the company (compared to the current share price of $64.41).
Although the price target is bullish, readers should exercise caution because analysts tend to be overly optimistic. The firms they work for, often big banks, have relationships with companies that extend into fundraising, M&A advisory, and other rewarding business lines. As a result, they typically hesitate to say bad things for fear they will lose out. We at StockStory do not suffer from such conflicts of interest, so we’ll always tell it like it is.