
APi (APG)
APi is intriguing. Its impressive revenue growth indicates the value of its offerings.― StockStory Analyst Team
1. News


2. Summary
Why APi Is Interesting
Started in 1926 as an insulation contractor, APi (NYSE:APG) provides life safety solutions and specialty services for buildings and infrastructure.
- Annual revenue growth of 17.7% over the last five years was superb and indicates its market share increased during this cycle
- Earnings growth has easily exceeded the peer group average over the last five years as its EPS has compounded at 13.6% annually
- On the flip side, its low returns on capital reflect management’s struggle to allocate funds effectively


APi almost passes our quality test. If you’re a believer, the valuation seems fair.
Why Is Now The Time To Buy APi?


At $39.50 per share, APi trades at 24.8x forward P/E. After scanning the names across industrials, we conclude that the multiple is deserved for the revenue growth you get.
If you think the market is not giving the company enough credit for its fundamentals, now could be a good time to invest.
3. APi (APG) Research Report: Q4 CY2025 Update
Safety and specialty services provider APi (NYSE:APG) reported Q4 CY2025 results topping the market’s revenue expectations, with sales up 13.7% year on year to $2.12 billion. Guidance for next quarter’s revenue was optimistic at $1.93 billion at the midpoint, 3% above analysts’ estimates. Its non-GAAP profit of $0.44 per share was 6.4% above analysts’ consensus estimates.
APi (APG) Q4 CY2025 Highlights:
- Revenue: $2.12 billion vs analyst estimates of $2.09 billion (13.7% year-on-year growth, 1.4% beat)
- Adjusted EPS: $0.44 vs analyst estimates of $0.41 (6.4% beat)
- Adjusted EBITDA: $295 million vs analyst estimates of $288.2 million (13.9% margin, 2.3% beat)
- Revenue Guidance for Q1 CY2026 is $1.93 billion at the midpoint, above analyst estimates of $1.87 billion
- EBITDA guidance for the upcoming financial year 2026 is $1.17 billion at the midpoint, below analyst estimates of $1.18 billion
- Operating Margin: 7.7%, up from 6.3% in the same quarter last year
- Free Cash Flow Margin: 16.8%, up from 14.2% in the same quarter last year
- Organic Revenue rose 11.1% year on year (beat)
- Market Capitalization: $19.4 billion
Company Overview
Started in 1926 as an insulation contractor, APi (NYSE:APG) provides life safety solutions and specialty services for buildings and infrastructure.
The company addresses the need for safety, fire protection systems, and maintenance for buildings and infrastructure. Much of what APi does is statutorily mandated, which means its services are often non-discretionary and predictable. For example, a state may require fire escapes to be inspected and maintained every five years.
APi’s designs, installs, and maintains fire suppression and sprinkler systems; mechanical, electrical, and plumbing systems; heating, ventilation, and air conditioning systems. Additionally, the company also offers engineering and maintenance services for infrastructure such as bridges, roads, and water systems. APi will go in and inspect the structural integrity of these structures as well as maintain coatings for corrosion protection, among other services and products.
The company's revenue is made up of contract service work, like the design and installation of its various fire protection or other systems, large-scale project-based work on construction and infrastructure projects, and ongoing maintenance and inspection contracts (which area reliable source of recurring revenue). Product sales also make up a portion of its revenue. APi sells through direct sales, contractual agreements, and a network of subsidiaries, with focusing on long-term client relationships.
4. Construction and Maintenance Services
Construction and maintenance services companies not only boast technical know-how in specialized areas but also may hold special licenses and permits. Those who work in more regulated areas can enjoy more predictable revenue streams - for example, fire escapes need to be inspected every five years. More recently, services to address energy efficiency and labor availability are also creating incremental demand. But like the broader industrials sector, construction and maintenance services companies are at the whim of economic cycles as external factors like interest rates can greatly impact the new construction that drives incremental demand for these companies’ offerings.
Companies that compete with APi include EMCOR (NYSE:EME), Comfort Systems USA (NYES:FIX), and private company Tyco.
5. Revenue Growth
Examining a company’s long-term performance can provide clues about its quality. Any business can put up a good quarter or two, but the best consistently grow over the long haul. Luckily, APi’s sales grew at an incredible 17.7% compounded annual growth rate over the last five years. Its growth beat the average industrials company and shows its offerings resonate with customers.
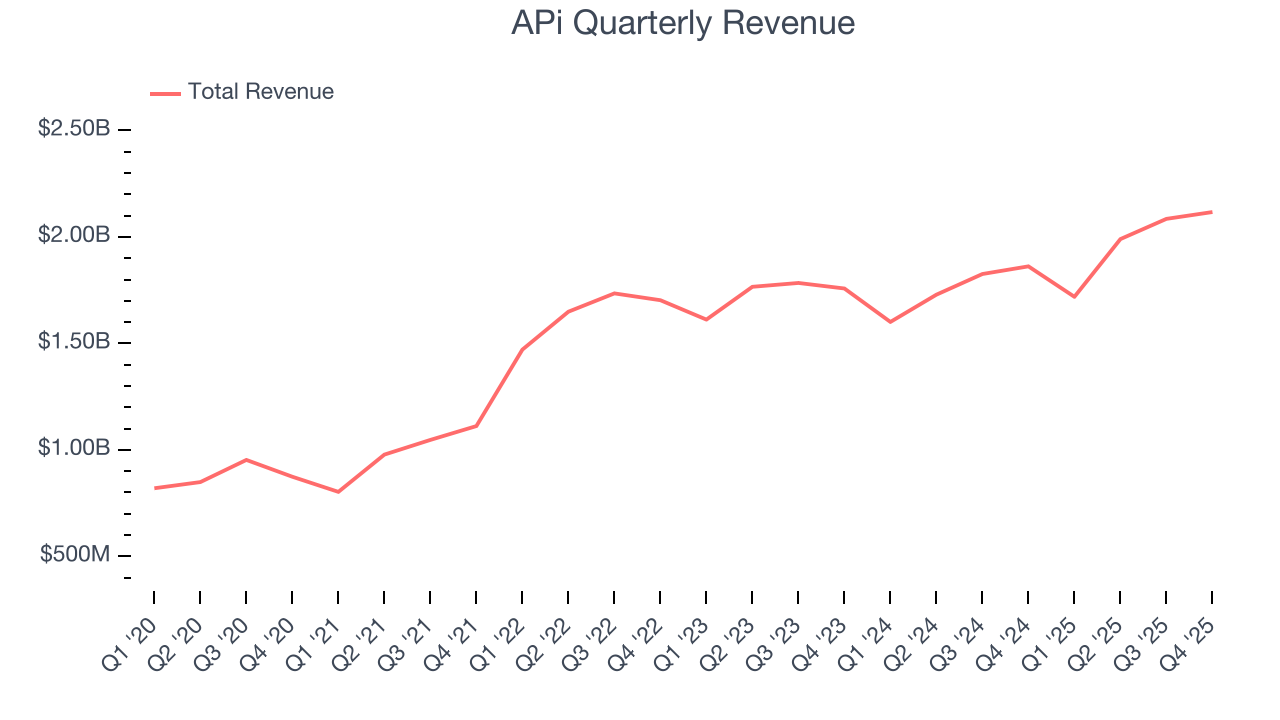
Long-term growth is the most important, but within industrials, a half-decade historical view may miss new industry trends or demand cycles. APi’s recent performance shows its demand has slowed significantly as its annualized revenue growth of 6.9% over the last two years was well below its five-year trend. 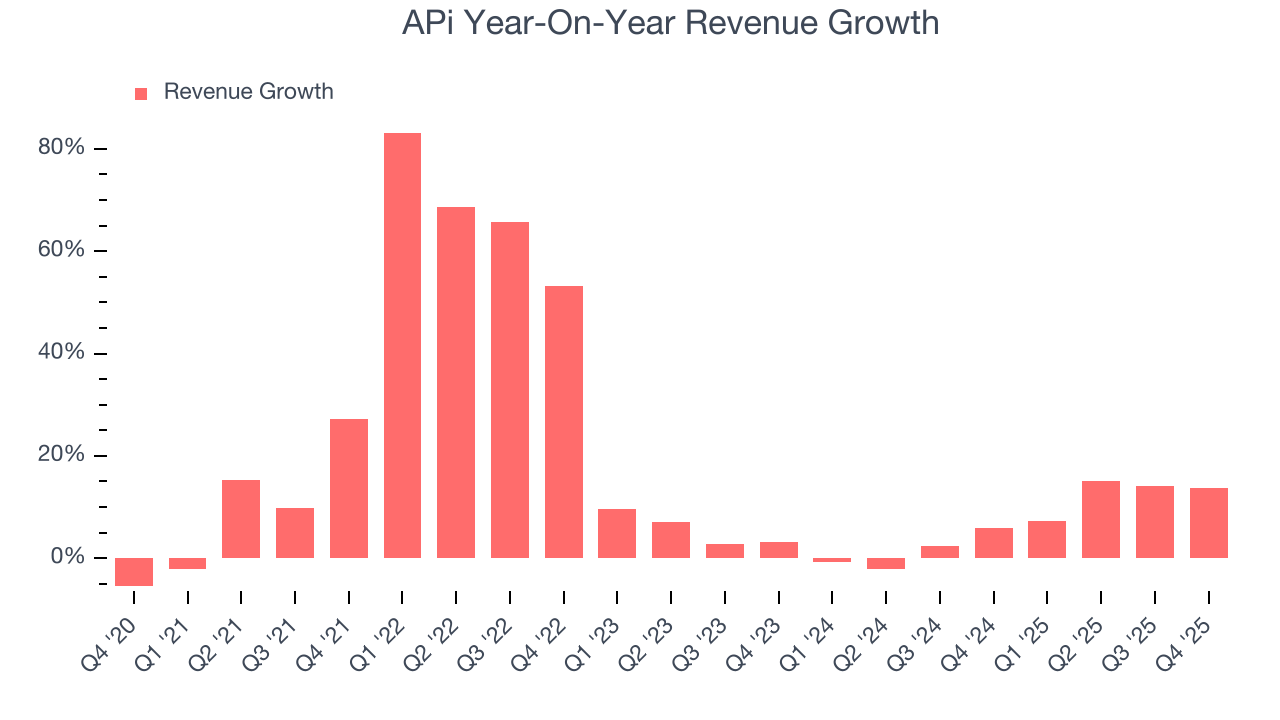
We can better understand the company’s sales dynamics by analyzing its organic revenue, which strips out one-time events like acquisitions and currency fluctuations that don’t accurately reflect its fundamentals. Over the last two years, APi’s organic revenue averaged 3.5% year-on-year growth. Because this number is lower than its two-year revenue growth, we can see that some mixture of acquisitions and foreign exchange rates boosted its headline results. 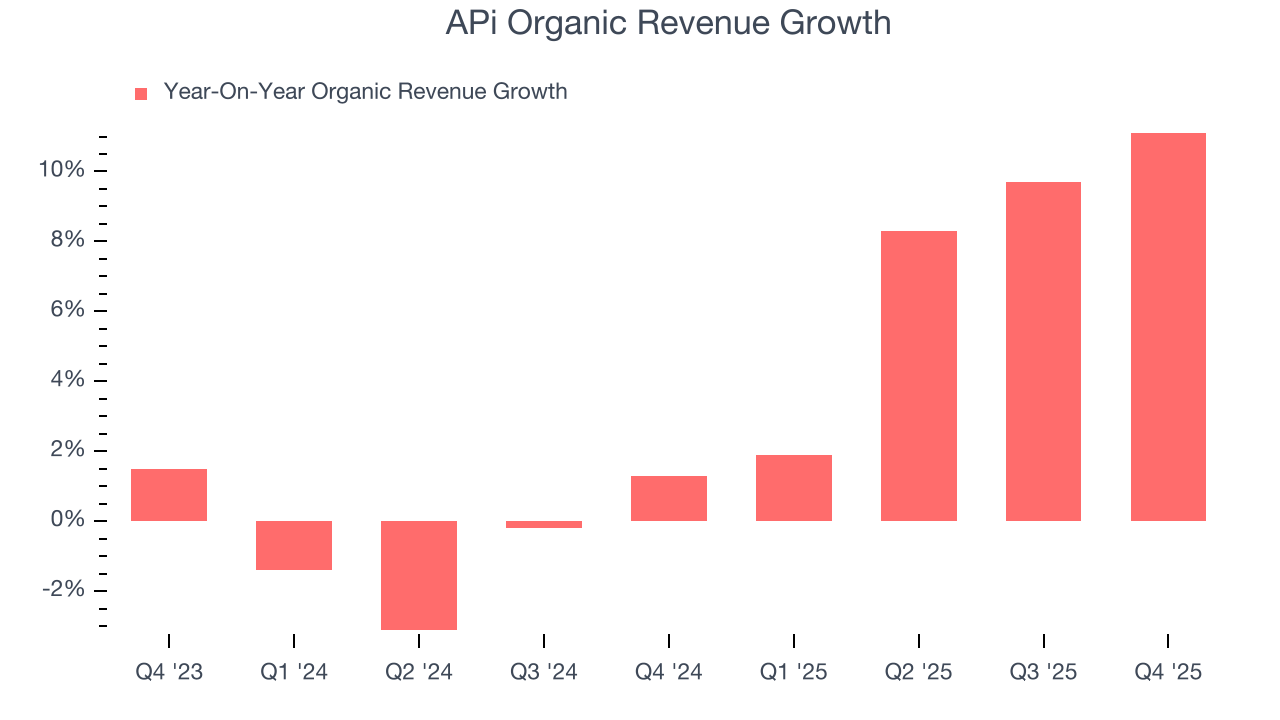
This quarter, APi reported year-on-year revenue growth of 13.7%, and its $2.12 billion of revenue exceeded Wall Street’s estimates by 1.4%. Company management is currently guiding for a 12% year-on-year increase in sales next quarter.
Looking further ahead, sell-side analysts expect revenue to grow 6.2% over the next 12 months, similar to its two-year rate. This projection is underwhelming and indicates its newer products and services will not lead to better top-line performance yet.
6. Gross Margin & Pricing Power
APi’s gross margin is slightly below the average industrials company, giving it less room to invest in areas such as research and development. As you can see below, it averaged a 28.6% gross margin over the last five years. Said differently, APi had to pay a chunky $71.40 to its suppliers for every $100 in revenue. 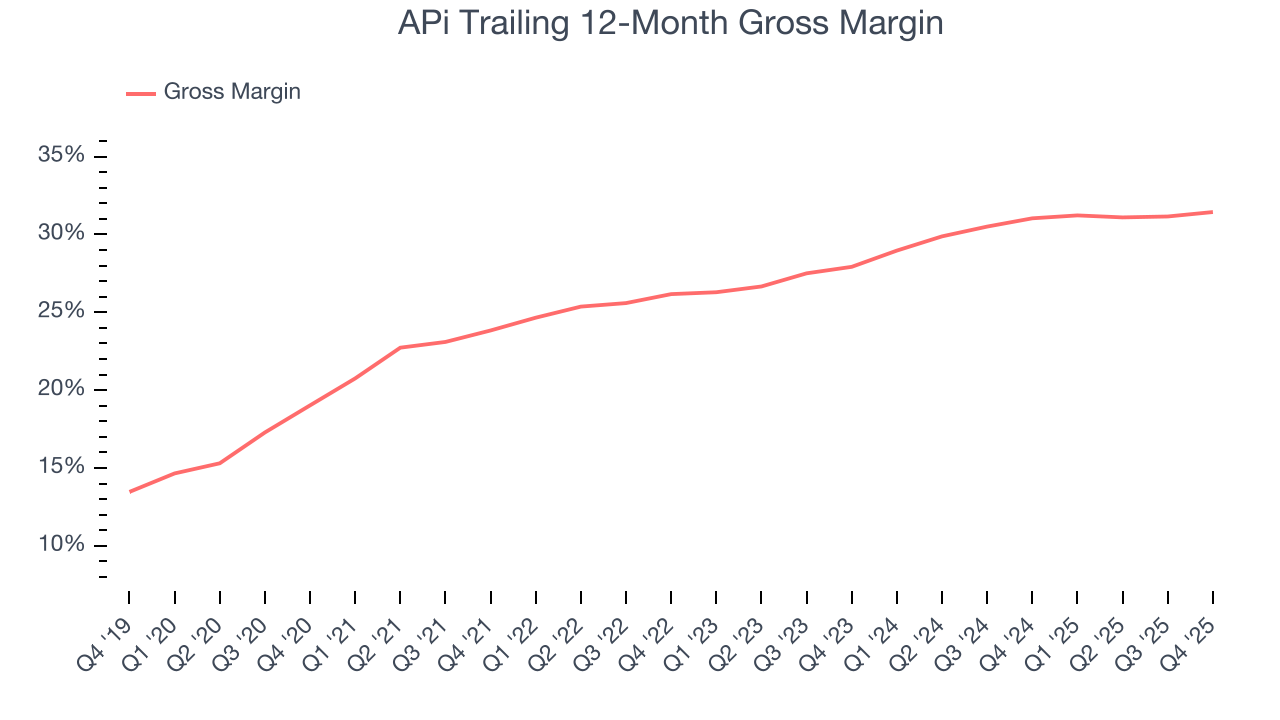
This quarter, APi’s gross profit margin was 32%, up 1.1 percentage points year on year. Zooming out, the company’s full-year margin has remained steady over the past 12 months, suggesting its input costs (such as raw materials and manufacturing expenses) have been stable and it isn’t under pressure to lower prices.
7. Operating Margin
Operating margin is one of the best measures of profitability because it tells us how much money a company takes home after procuring and manufacturing its products, marketing and selling those products, and most importantly, keeping them relevant through research and development.
APi was profitable over the last five years but held back by its large cost base. Its average operating margin of 5.2% was weak for an industrials business. This result isn’t too surprising given its low gross margin as a starting point.
On the plus side, APi’s operating margin rose by 3.6 percentage points over the last five years, as its sales growth gave it operating leverage.
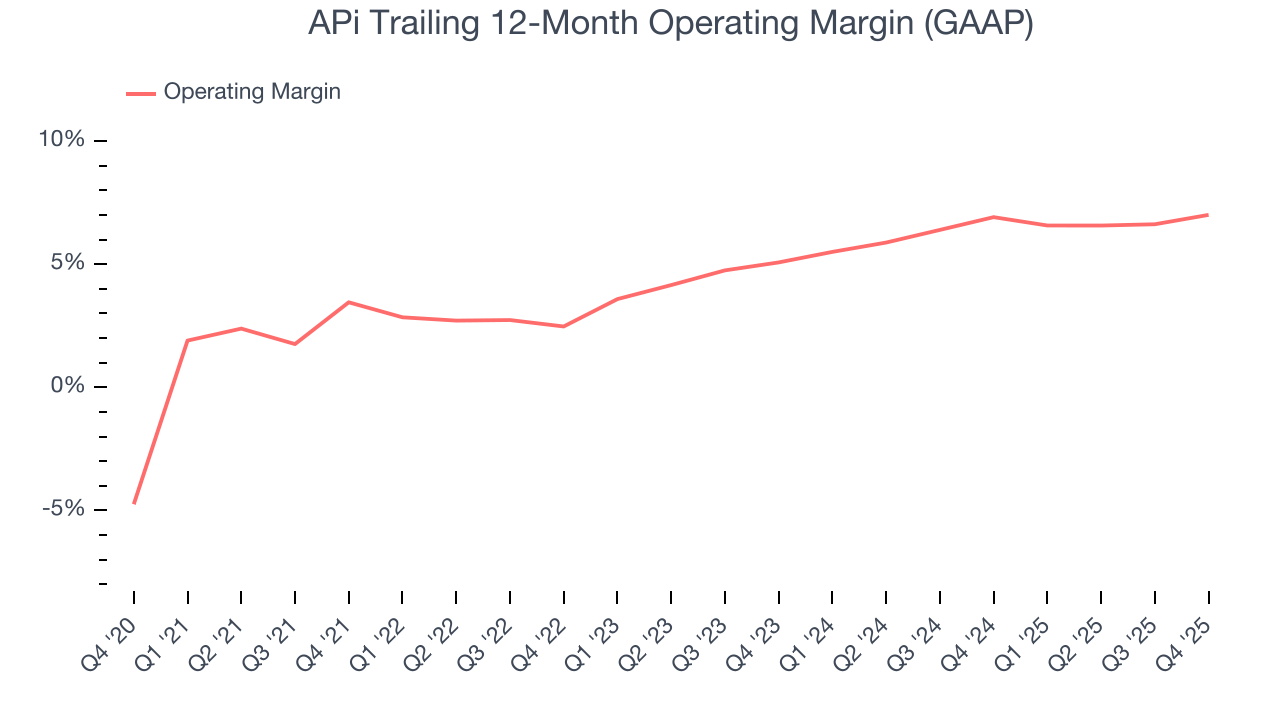
This quarter, APi generated an operating margin profit margin of 7.7%, up 1.5 percentage points year on year. The increase was encouraging, and because its operating margin rose more than its gross margin, we can infer it was more efficient with expenses such as marketing, R&D, and administrative overhead.
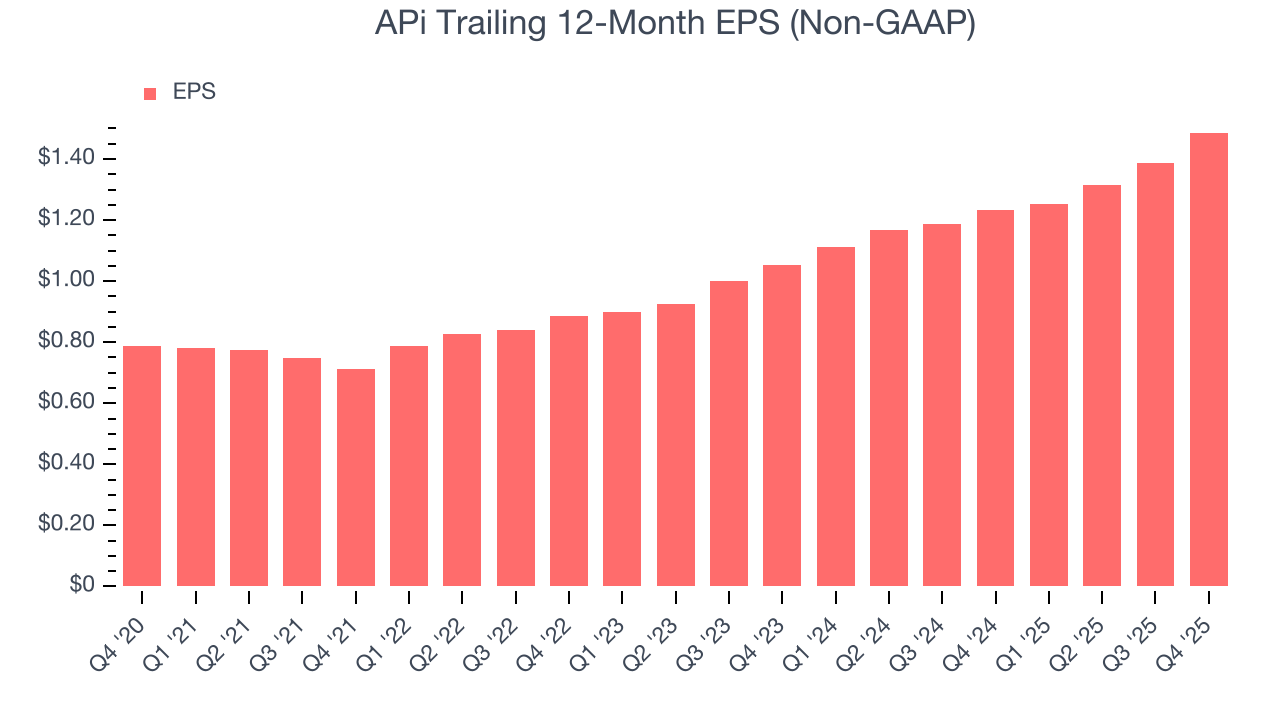
8. Earnings Per Share
We track the long-term change in earnings per share (EPS) for the same reason as long-term revenue growth. Compared to revenue, however, EPS highlights whether a company’s growth is profitable.
APi’s EPS grew at a remarkable 13.6% compounded annual growth rate over the last five years. Despite its operating margin improvement during that time, this performance was lower than its 17.7% annualized revenue growth, telling us that non-fundamental factors such as interest and taxes affected its ultimate earnings.
Diving into APi’s quality of earnings can give us a better understanding of its performance. A five-year view shows APi has diluted its shareholders, growing its share count by 64.1%. This dilution overshadowed its increased operational efficiency and has led to lower per share earnings. Taxes and interest expenses can also affect EPS but don’t tell us as much about a company’s fundamentals. 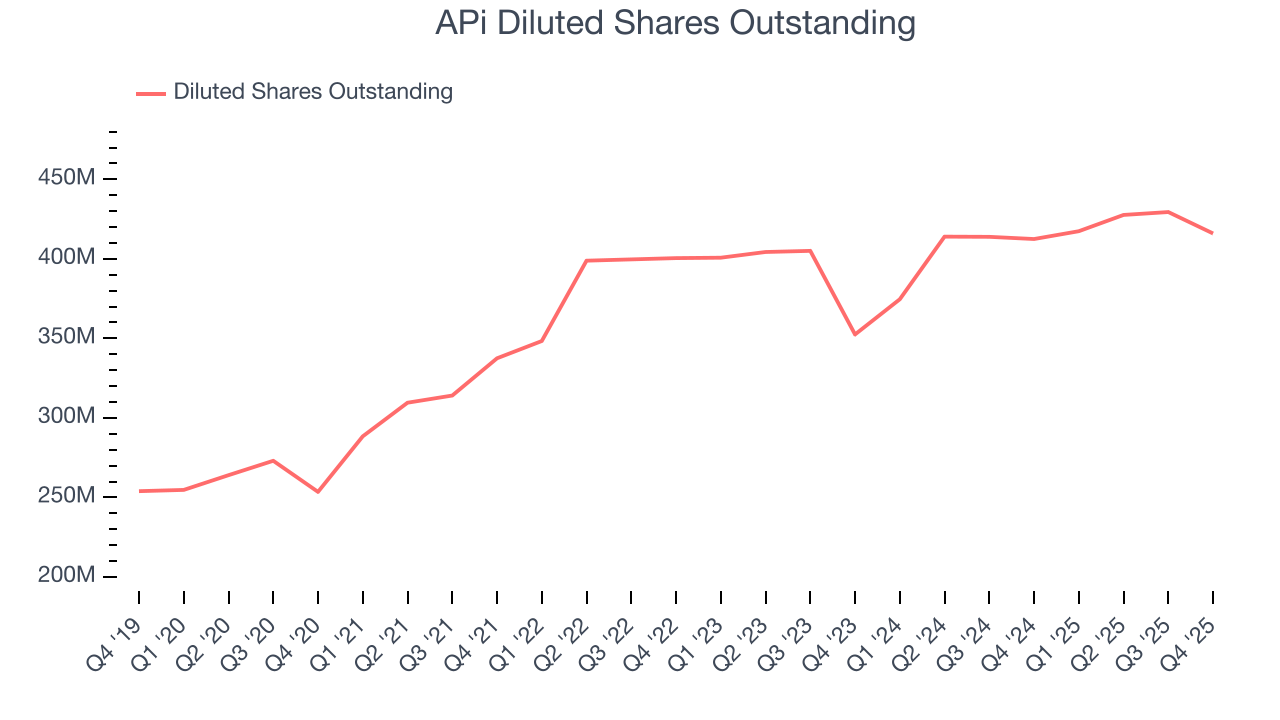
Like with revenue, we analyze EPS over a shorter period to see if we are missing a change in the business.
For APi, its two-year annual EPS growth of 18.8% was higher than its five-year trend. We love it when earnings growth accelerates, especially when it accelerates off an already high base.
In Q4, APi reported adjusted EPS of $0.44, up from $0.34 in the same quarter last year. This print beat analysts’ estimates by 6.4%. Over the next 12 months, Wall Street expects APi’s full-year EPS of $1.49 to grow 13.6%.
9. Cash Is King
Although earnings are undoubtedly valuable for assessing company performance, we believe cash is king because you can’t use accounting profits to pay the bills.
APi has shown decent cash profitability, giving it some flexibility to reinvest or return capital to investors. The company’s free cash flow margin averaged 6% over the last five years, slightly better than the broader industrials sector.
Taking a step back, we can see that APi’s margin expanded by 5.2 percentage points during that time. This is encouraging, and we can see it became a less capital-intensive business because its free cash flow profitability rose more than its operating profitability.
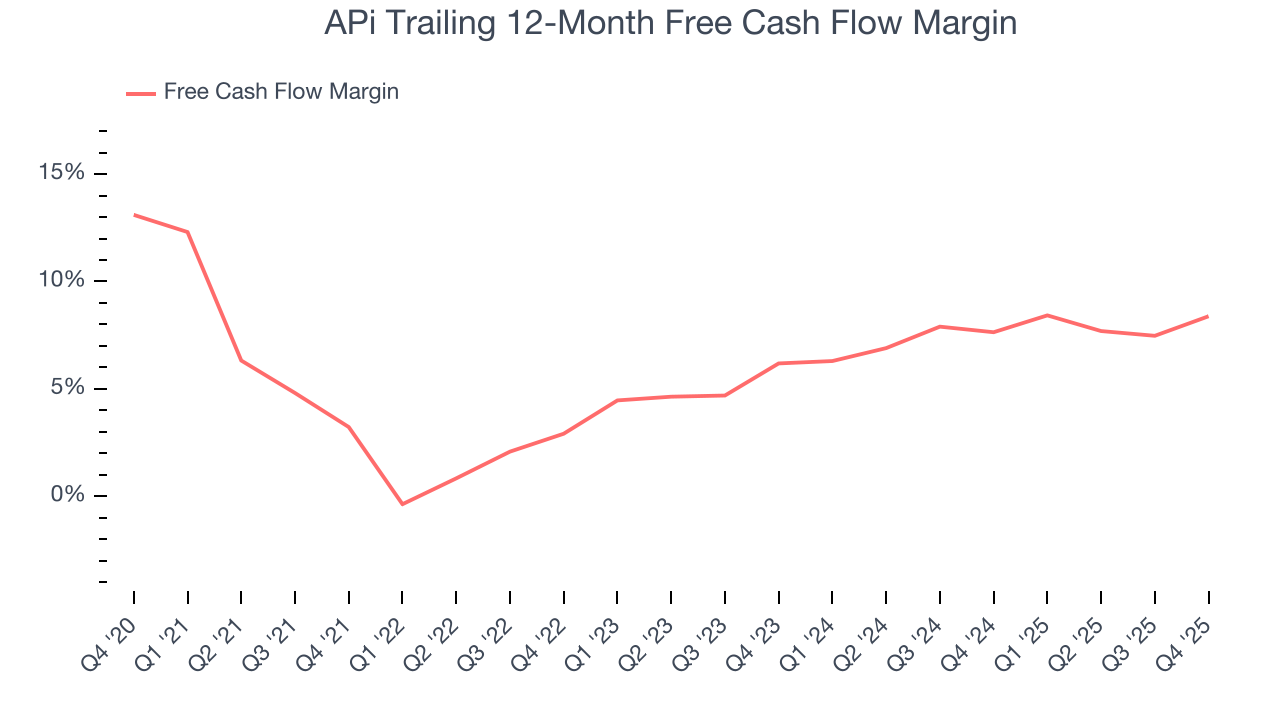
APi’s free cash flow clocked in at $356 million in Q4, equivalent to a 16.8% margin. This result was good as its margin was 2.6 percentage points higher than in the same quarter last year, building on its favorable historical trend.
10. Return on Invested Capital (ROIC)
EPS and free cash flow tell us whether a company was profitable while growing its revenue. But was it capital-efficient? A company’s ROIC explains this by showing how much operating profit it makes compared to the money it has raised (debt and equity).
APi historically did a mediocre job investing in profitable growth initiatives. Its five-year average ROIC was 4.2%, lower than the typical cost of capital (how much it costs to raise money) for industrials companies.
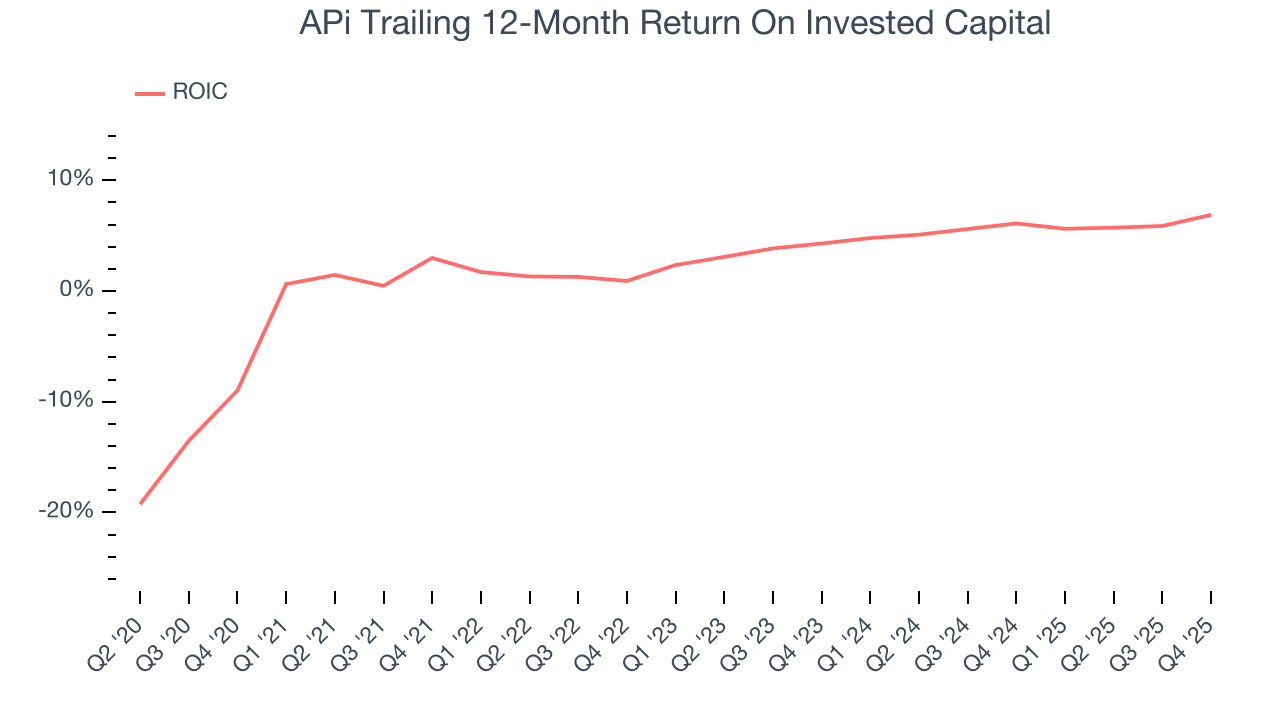
We like to invest in businesses with high returns, but the trend in a company’s ROIC is what often surprises the market and moves the stock price. On average, APi’s ROIC increased by 4.5 percentage points annually each year over the last few years. This is a good sign, and if its returns keep rising, there’s a chance it could evolve into an investable business.
11. Balance Sheet Assessment
APi reported $912 million of cash and $3.07 billion of debt on its balance sheet in the most recent quarter. As investors in high-quality companies, we primarily focus on two things: 1) that a company’s debt level isn’t too high and 2) that its interest payments are not excessively burdening the business.
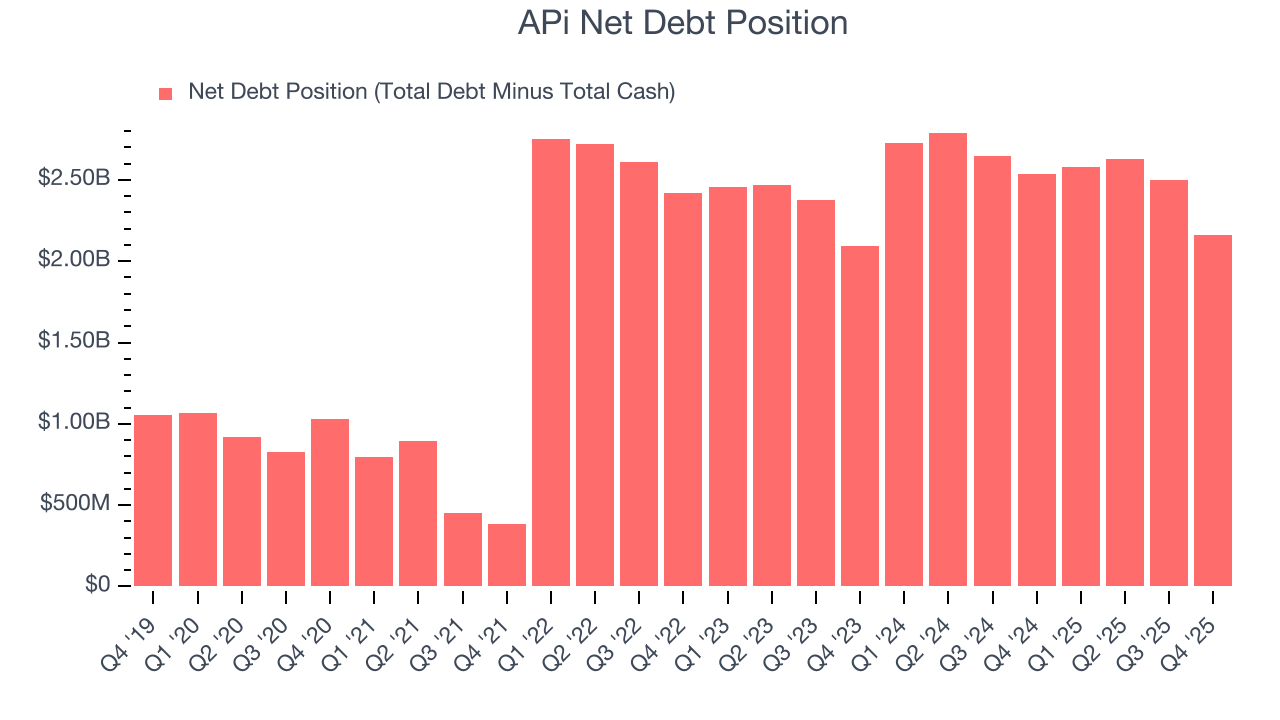
With $1.04 billion of EBITDA over the last 12 months, we view APi’s 2.1× net-debt-to-EBITDA ratio as safe. We also see its $109 million of annual interest expenses as appropriate. The company’s profits give it plenty of breathing room, allowing it to continue investing in growth initiatives.
12. Key Takeaways from APi’s Q4 Results
We enjoyed seeing APi beat analysts’ organic revenue expectations this quarter. We were also glad its revenue guidance for next quarter exceeded Wall Street’s estimates. On the other hand, its full-year EBITDA guidance slightly missed. Overall, this print was mixed. The stock remained flat at $44.94 immediately following the results.
13. Is Now The Time To Buy APi?
Updated: March 21, 2026 at 10:59 PM EDT
Before making an investment decision, investors should account for APi’s business fundamentals and valuation in addition to what happened in the latest quarter.
There are definitely a lot of things to like about APi. First off, its revenue growth was exceptional over the last five years. And while its relatively low ROIC suggests management has struggled to find compelling investment opportunities, its rising cash profitability gives it more optionality. On top of that, its expanding operating margin shows the business has become more efficient.
APi’s P/E ratio based on the next 12 months is 24.8x. Looking at the industrials space right now, APi trades at a compelling valuation. For those confident in the business and its management team, this is a good time to invest.
Wall Street analysts have a consensus one-year price target of $52 on the company (compared to the current share price of $39.50), implying they see 31.6% upside in buying APi in the short term.