
Acuity Brands (AYI)
Acuity Brands is a sound business. It consistently invests in attractive growth opportunities, generating substantial cash flows and returns.― StockStory Analyst Team
1. News


2. Summary
Why Acuity Brands Is Interesting
One of the pioneers of smart lights, Acuity (NYSE:AYI) designs and manufactures light fixtures and building management systems used in various industries.
- Earnings per share have massively outperformed its peers over the last five years, increasing by 18.1% annually
- Offerings are difficult to replicate at scale and result in a stellar gross margin of 44.8%
- A drawback is its estimated sales growth of 5.7% for the next 12 months implies demand will slow from its two-year trend


Acuity Brands shows some potential. If you like the story, the valuation looks reasonable.
Why Is Now The Time To Buy Acuity Brands?


Acuity Brands is trading at $260.83 per share, or 12.8x forward P/E. This multiple is lower than most industrials companies, and we think the valuation is reasonable for the quality you get.
If you think the market is not giving the company enough credit for its fundamentals, now could be a good time to invest.
3. Acuity Brands (AYI) Research Report: Q4 CY2025 Update
Intelligent lighting and space solutions provider Acuity Brands (NYSE:AYI) met Wall Streets revenue expectations in Q4 CY2025, with sales up 20.2% year on year to $1.14 billion. Its non-GAAP profit of $4.69 per share was 2.2% above analysts’ consensus estimates.
Acuity Brands (AYI) Q4 CY2025 Highlights:
- Revenue: $1.14 billion vs analyst estimates of $1.14 billion (20.2% year-on-year growth, in line)
- Adjusted EPS: $4.69 vs analyst estimates of $4.59 (2.2% beat)
- Adjusted EBITDA: $211.2 million vs analyst estimates of $197.8 million (18.5% margin, 6.8% beat)
- Operating Margin: 14%, in line with the same quarter last year
- Free Cash Flow Margin: 10%, down from 11.9% in the same quarter last year
- Market Capitalization: $11.25 billion
Company Overview
One of the pioneers of smart lights, Acuity (NYSE:AYI) designs and manufactures light fixtures and building management systems used in various industries.
The company operates through two primary business segments: Acuity Brands Lighting and Lighting Controls (ABL) and the Intelligent Spaces Group (ISG). These segments focus on designing, manufacturing, and bringing to market products and services.
The ABL segment forms a substantial part of Acuity's business, offering a wide range of lighting solutions including commercial, architectural, and specialty lighting, as well as lighting controls and components. This segment's portfolio predominantly features LED technology designed to optimize energy efficiency and comfort for various indoor and outdoor applications.
The ISG segment focuses on making spaces smarter, safer, and greener by connecting edge devices to the cloud. This segment offers building management solutions and software, including products for controlling HVAC, lighting, shades, refrigeration, and building access. ISG's intelligent building software aims to improve building system management and automate labor-intensive tasks while delivering operational energy efficiency and cost reductions.
Acuity Brands' revenue structure is primarily based on the sale of its lighting and building management products and solutions. The company serves including electrical distributors, retail home improvement centers, electric utilities, national accounts, original equipment manufacturers, digital retailers, lighting showrooms, and energy service companies. Acuity's products are sold through multiple avenues, including independent sales agencies, internal sales representatives, consumer retail channels, and directly to large corporate accounts and OEM customers.
The company's manufacturing and distribution has eighteen manufacturing facilities spread across the United States, Mexico, Europe, and Canada. A significant portion of the company's manufacturing takes place in Mexico, where it operates several facilities under Maquiladora status, allowing for duty-free import of raw materials.
4. Electrical Systems
Like many equipment and component manufacturers, electrical systems companies are buoyed by secular trends such as connectivity and industrial automation. More specific pockets of strong demand include Internet of Things (IoT) connectivity and the 5G telecom upgrade cycle, which can benefit companies whose cables and conduits fit those needs. But like the broader industrials sector, these companies are also at the whim of economic cycles. Interest rates, for example, can greatly impact projects that drive demand for these products.
Competitors offering lighting and lighting systems solutions include Eaton (NYSE:ETN), Signify (OTCMKTS:PHPPY), and Osram Licht AG (OSAGF:OTCPK)
5. Revenue Growth
A company’s long-term sales performance is one signal of its overall quality. Any business can put up a good quarter or two, but the best consistently grow over the long haul. Unfortunately, Acuity Brands’s 6.7% annualized revenue growth over the last five years was mediocre. This wasn’t a great result compared to the rest of the industrials sector, but there are still things to like about Acuity Brands.
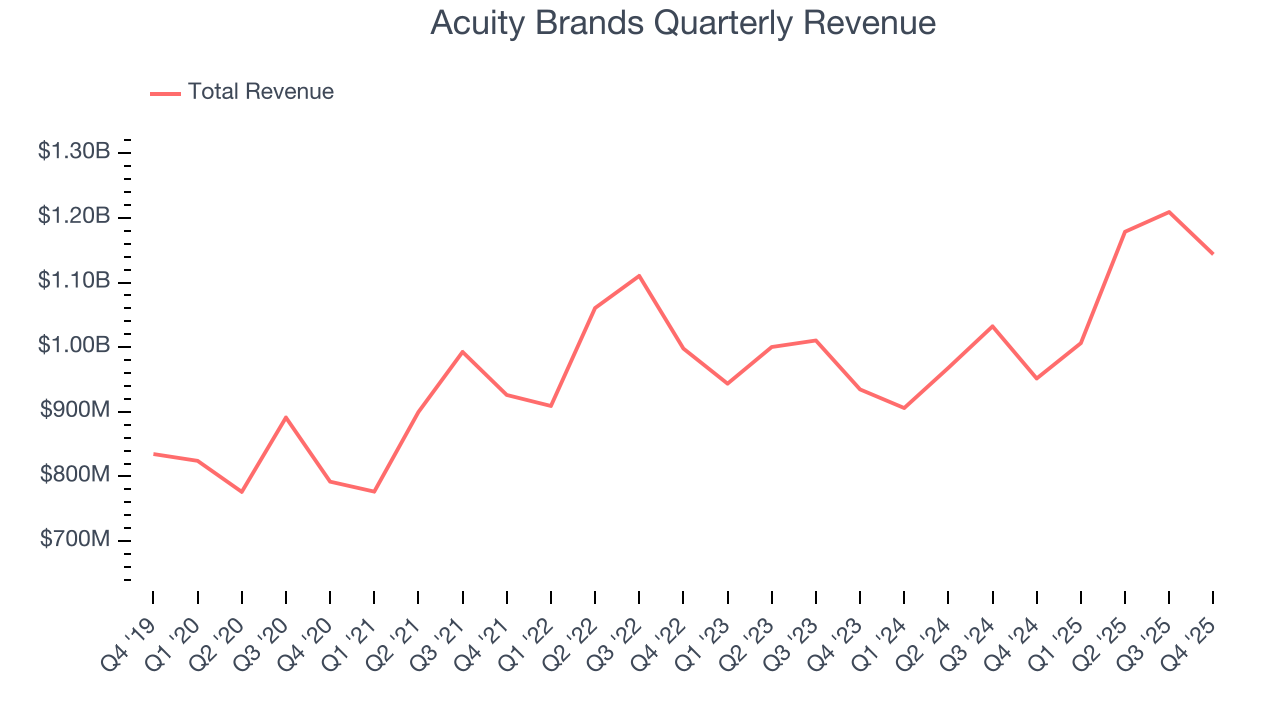
Long-term growth is the most important, but within industrials, a half-decade historical view may miss new industry trends or demand cycles. Acuity Brands’s annualized revenue growth of 8% over the last two years is above its five-year trend, suggesting some bright spots. 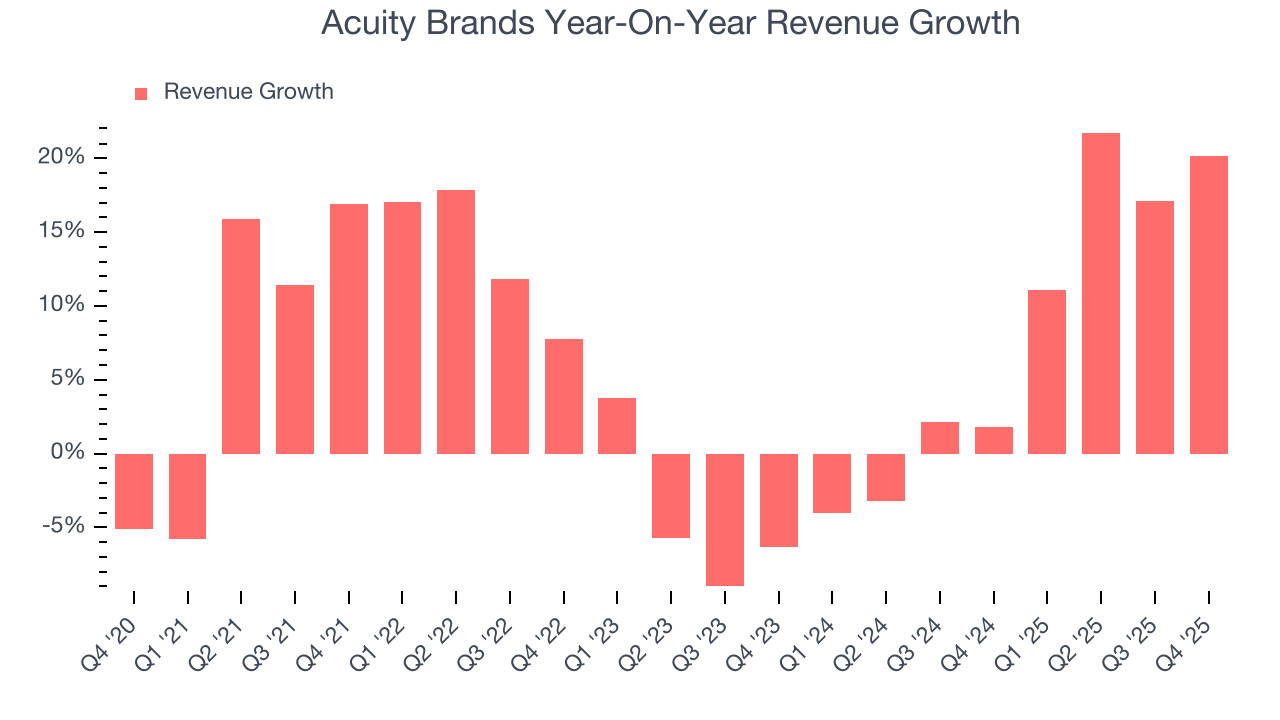
This quarter, Acuity Brands’s year-on-year revenue growth of 20.2% was excellent, and its $1.14 billion of revenue was in line with Wall Street’s estimates.
Looking ahead, sell-side analysts expect revenue to grow 6.3% over the next 12 months, a slight deceleration versus the last two years. This projection is underwhelming and implies its products and services will see some demand headwinds. At least the company is tracking well in other measures of financial health.
6. Gross Margin & Pricing Power
Acuity Brands has best-in-class unit economics for an industrials company, enabling it to invest in areas such as research and development. Its margin also signals it sells differentiated products, not commodities. As you can see below, it averaged an elite 44.8% gross margin over the last five years. Said differently, roughly $44.81 was left to spend on selling, marketing, R&D, and general administrative overhead for every $100 in revenue. 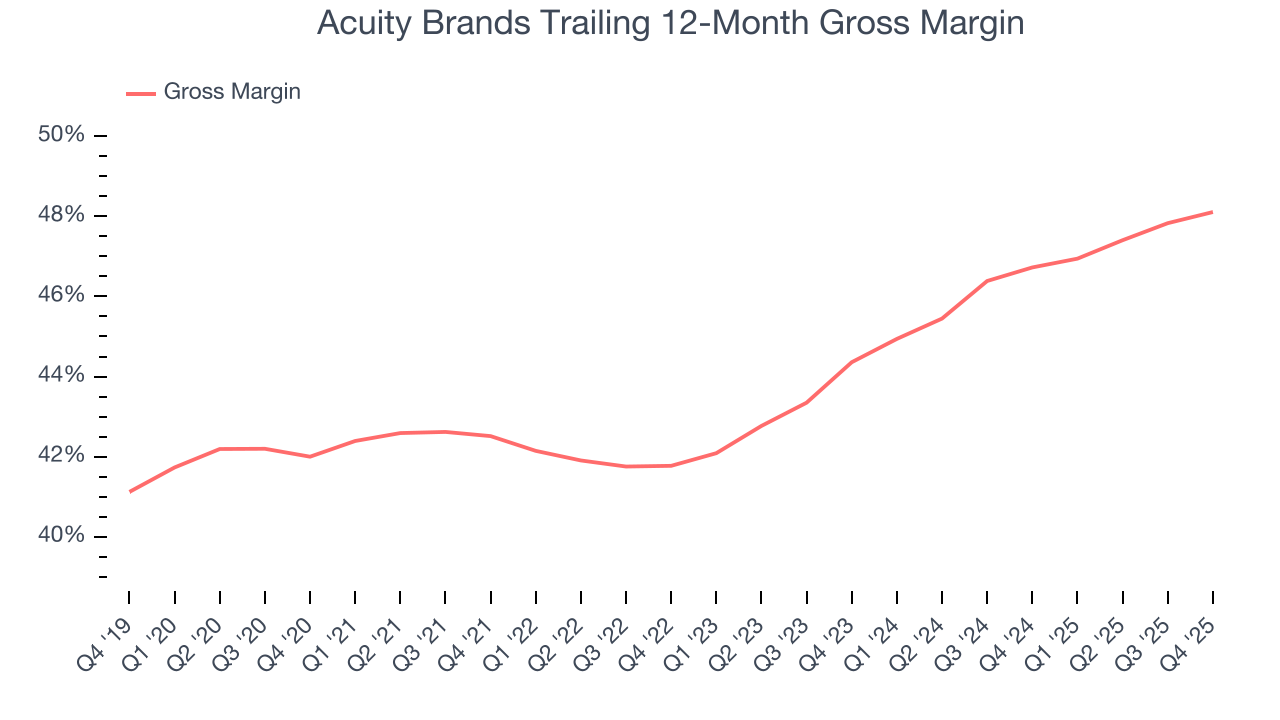
Acuity Brands produced a 48.4% gross profit margin in Q4, up 1.2 percentage points year on year. Acuity Brands’s full-year margin has also been trending up over the past 12 months, increasing by 1.4 percentage points. If this move continues, it could suggest better unit economics due to more leverage from its growing sales on the fixed portion of its cost of goods sold (such as manufacturing expenses).
7. Operating Margin
Operating margin is an important measure of profitability as it shows the portion of revenue left after accounting for all core expenses – everything from the cost of goods sold to advertising and wages. It’s also useful for comparing profitability across companies with different levels of debt and tax rates because it excludes interest and taxes.
Acuity Brands’s operating margin might fluctuated slightly over the last 12 months but has remained more or less the same, averaging 13% over the last five years. This profitability was top-notch for an industrials business, showing it’s an well-run company with an efficient cost structure. This result isn’t surprising as its high gross margin gives it a favorable starting point.
Analyzing the trend in its profitability, Acuity Brands’s operating margin might fluctuated slightly but has generally stayed the same over the last five years. This raises questions about the company’s expense base because its revenue growth should have given it leverage on its fixed costs, resulting in better economies of scale and profitability.
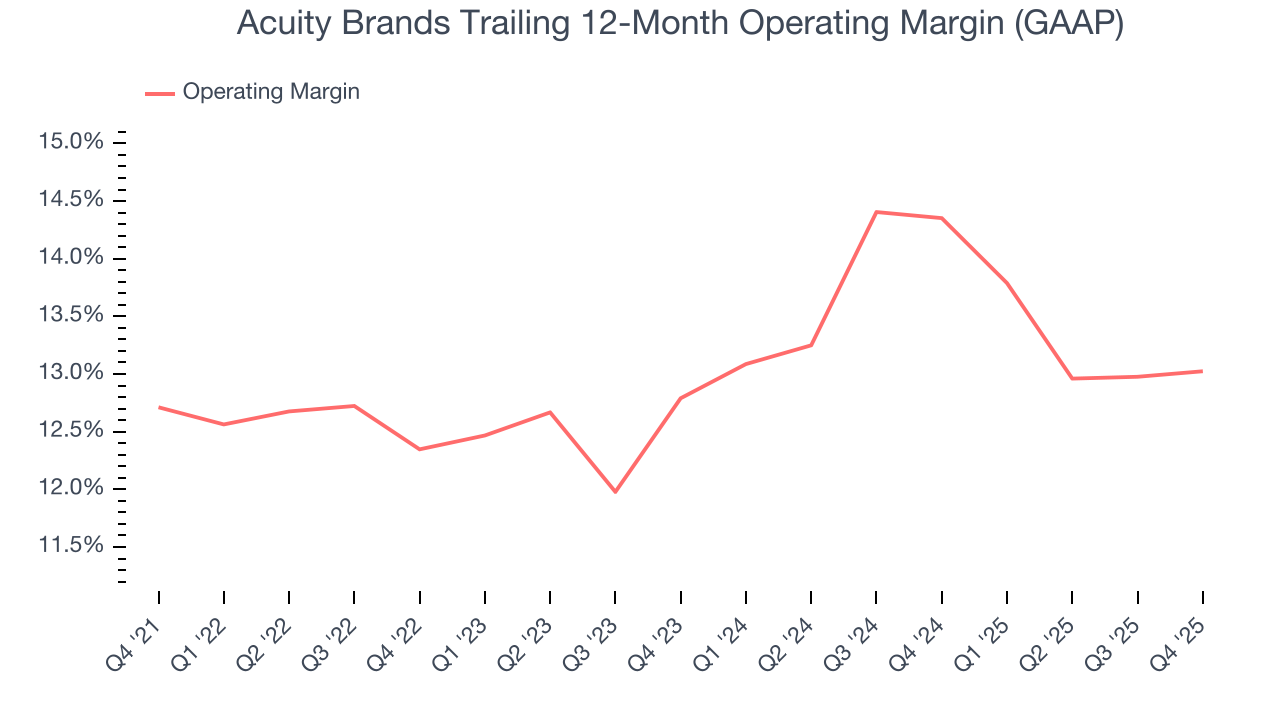
This quarter, Acuity Brands generated an operating margin profit margin of 14%, in line with the same quarter last year. This indicates the company’s cost structure has recently been stable.
8. Earnings Per Share
Revenue trends explain a company’s historical growth, but the long-term change in earnings per share (EPS) points to the profitability of that growth – for example, a company could inflate its sales through excessive spending on advertising and promotions.
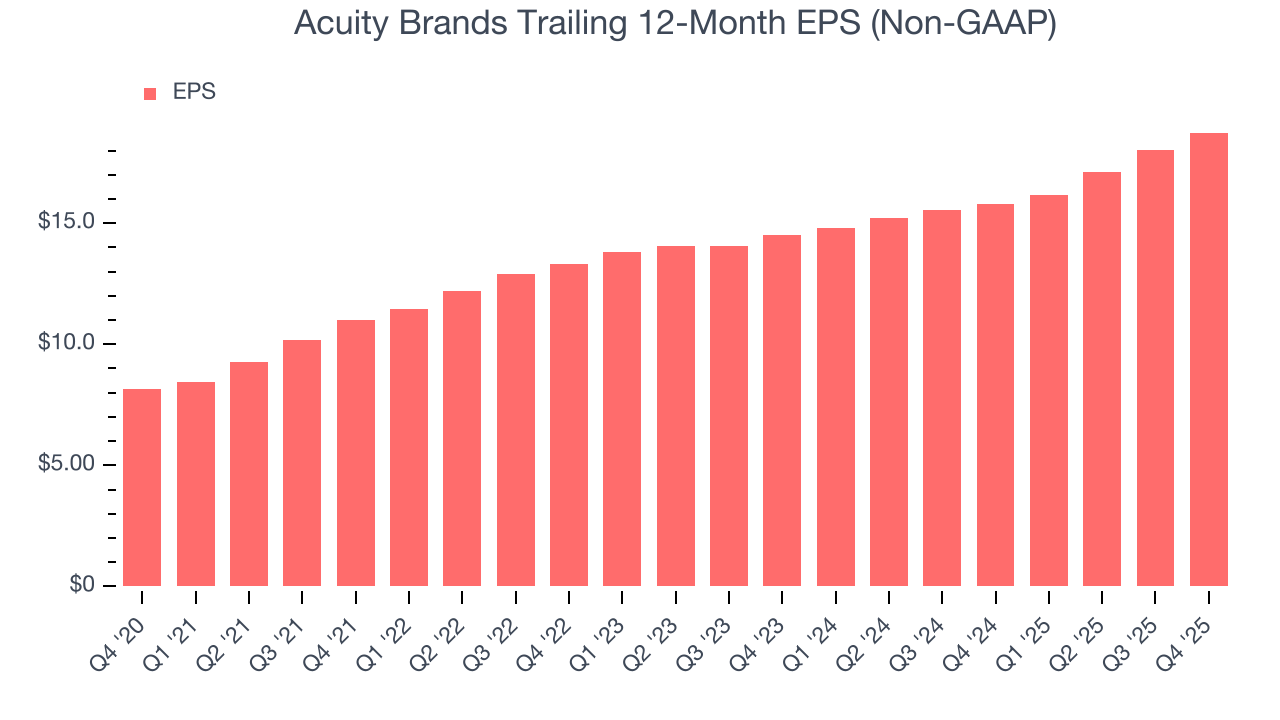
Acuity Brands’s EPS grew at an astounding 18.1% compounded annual growth rate over the last five years, higher than its 6.7% annualized revenue growth. This tells us the company became more profitable on a per-share basis as it expanded.
We can take a deeper look into Acuity Brands’s earnings to better understand the drivers of its performance. A five-year view shows that Acuity Brands has repurchased its stock, shrinking its share count by 16.5%. This tells us its EPS outperformed its revenue not because of increased operational efficiency but financial engineering, as buybacks boost per share earnings. 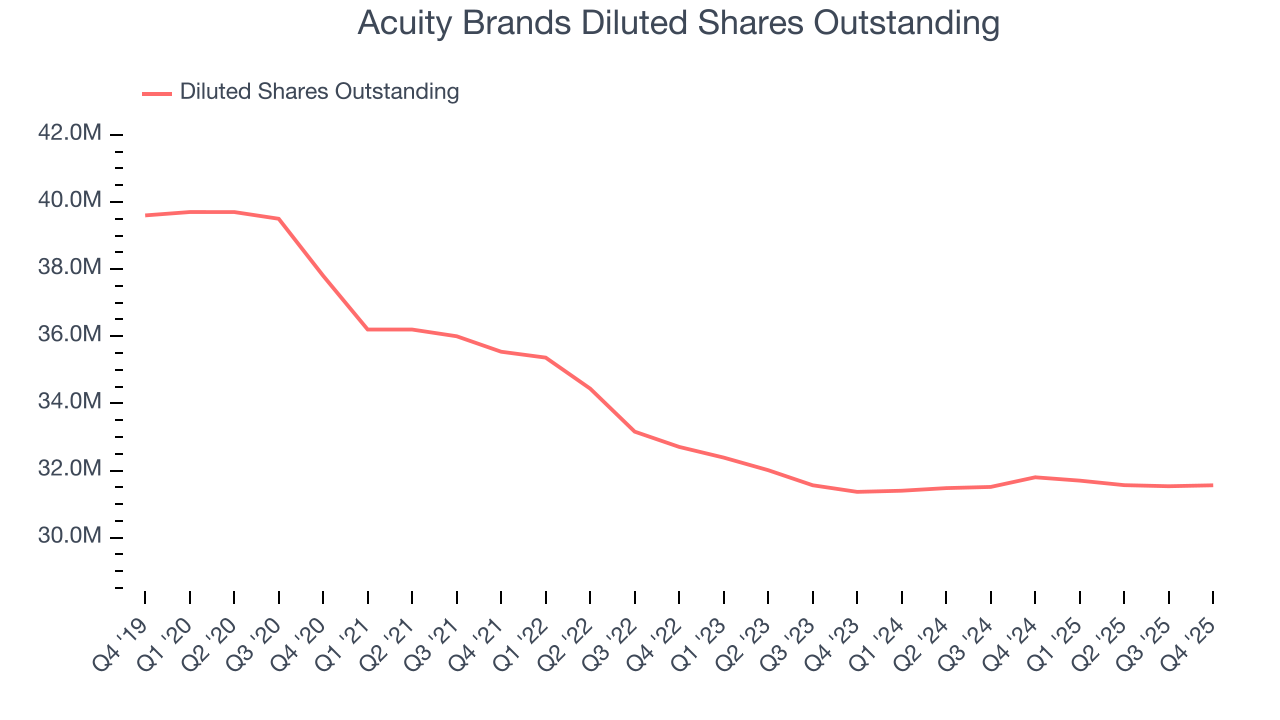
Like with revenue, we analyze EPS over a shorter period to see if we are missing a change in the business.
For Acuity Brands, its two-year annual EPS growth of 13.7% was lower than its five-year trend. We still think its growth was good and hope it can accelerate in the future.
In Q4, Acuity Brands reported adjusted EPS of $4.69, up from $3.97 in the same quarter last year. This print beat analysts’ estimates by 2.2%. Over the next 12 months, Wall Street expects Acuity Brands’s full-year EPS of $18.74 to grow 9.2%.
9. Cash Is King
Free cash flow isn't a prominently featured metric in company financials and earnings releases, but we think it's telling because it accounts for all operating and capital expenses, making it tough to manipulate. Cash is king.
Acuity Brands has shown robust cash profitability, enabling it to comfortably ride out cyclical downturns while investing in plenty of new offerings and returning capital to investors. The company’s free cash flow margin averaged 11.2% over the last five years, quite impressive for an industrials business.
Taking a step back, we can see that Acuity Brands’s margin expanded by 2.7 percentage points during that time. This shows the company is heading in the right direction, and we can see it became a less capital-intensive business because its free cash flow profitability rose while its operating profitability was flat.
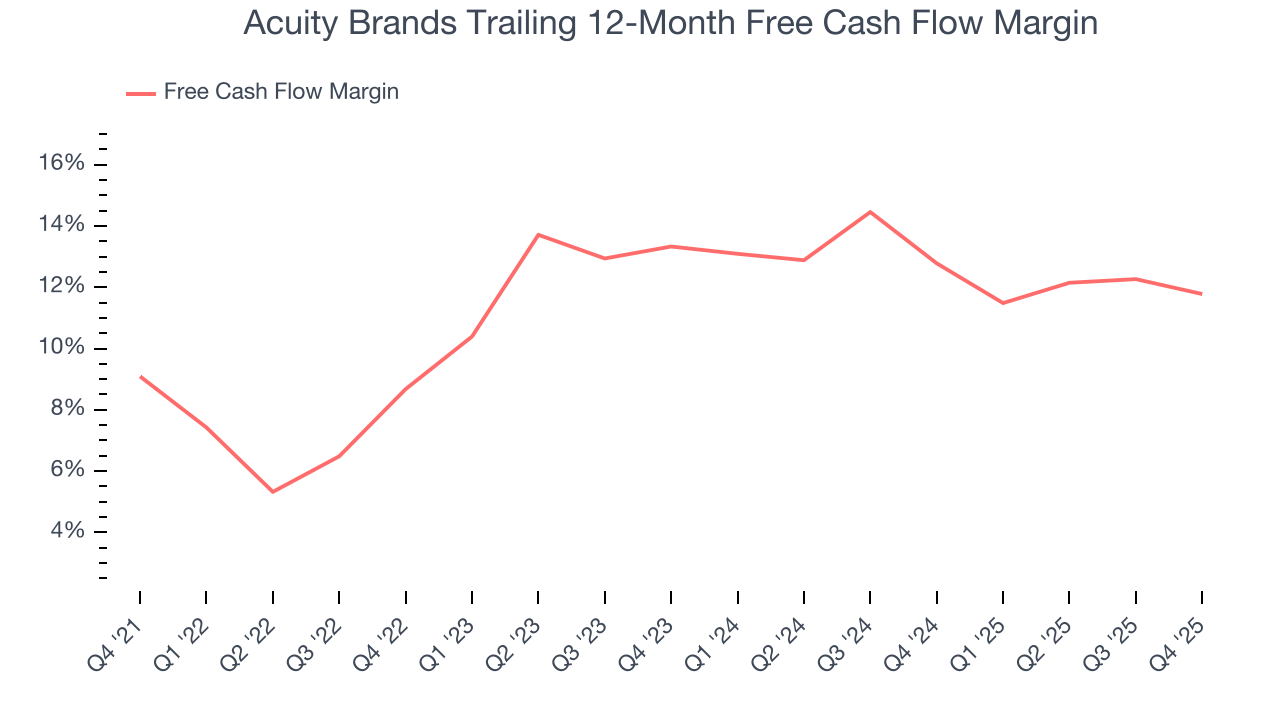
Acuity Brands’s free cash flow clocked in at $114.8 million in Q4, equivalent to a 10% margin. The company’s cash profitability regressed as it was 1.9 percentage points lower than in the same quarter last year, but we wouldn’t read too much into the short term because investment needs can be seasonal, causing temporary swings. Long-term trends carry greater meaning.
10. Return on Invested Capital (ROIC)
EPS and free cash flow tell us whether a company was profitable while growing its revenue. But was it capital-efficient? A company’s ROIC explains this by showing how much operating profit it makes compared to the money it has raised (debt and equity).
Acuity Brands’s five-year average ROIC was 16.8%, beating other industrials companies by a wide margin. This illustrates its management team’s ability to invest in attractive growth opportunities and produce tangible results for shareholders.
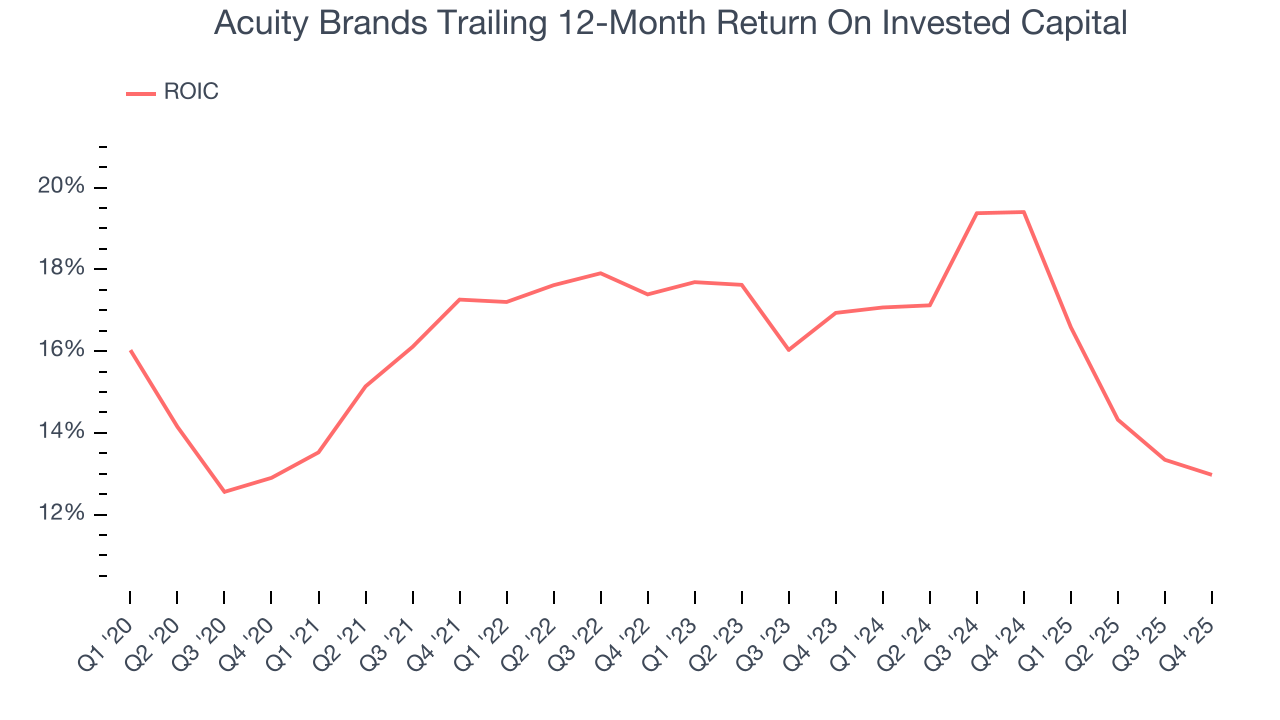
We like to invest in businesses with high returns, but the trend in a company’s ROIC is what often surprises the market and moves the stock price. Over the last few years, Acuity Brands’s ROIC averaged 1.1 percentage point decreases each year. Only time will tell if its new bets can bear fruit and potentially reverse the trend.
11. Balance Sheet Assessment
Acuity Brands reported $376.1 million of cash and $910.1 million of debt on its balance sheet in the most recent quarter. As investors in high-quality companies, we primarily focus on two things: 1) that a company’s debt level isn’t too high and 2) that its interest payments are not excessively burdening the business.
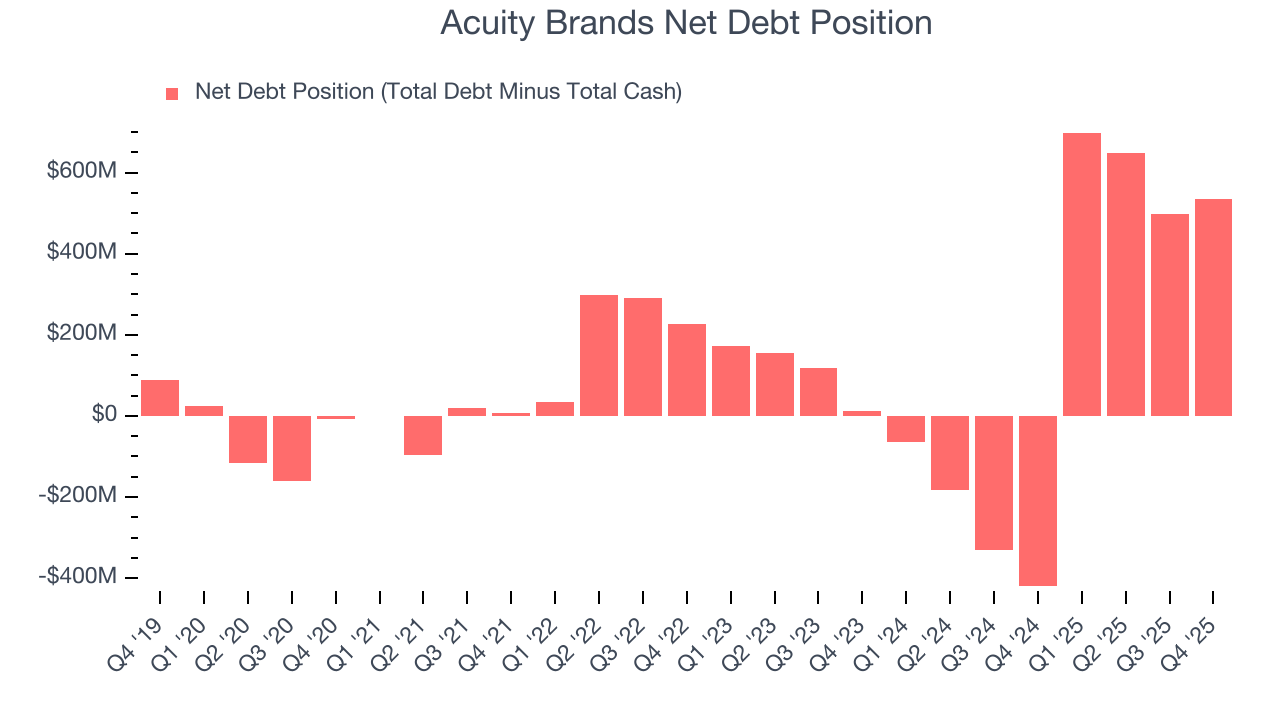
With $864.8 million of EBITDA over the last 12 months, we view Acuity Brands’s 0.6× net-debt-to-EBITDA ratio as safe. We also see its $17.6 million of annual interest expenses as appropriate. The company’s profits give it plenty of breathing room, allowing it to continue investing in growth initiatives.
12. Key Takeaways from Acuity Brands’s Q4 Results
Revenue was just in line, although EPS managed to beat. Overall, we think this was a decent quarter, the market seemed to be hoping for more, and shares traded down 4.3% to $353.80 immediately following the results.
13. Is Now The Time To Buy Acuity Brands?
Updated: March 15, 2026 at 10:08 PM EDT
The latest quarterly earnings matters, sure, but we actually think longer-term fundamentals and valuation matter more. Investors should consider all these pieces before deciding whether or not to invest in Acuity Brands.
There are definitely a lot of things to like about Acuity Brands. Although its revenue growth was mediocre over the last five years and analysts expect growth to slow over the next 12 months, its astounding EPS growth over the last five years shows its profits are trickling down to shareholders. On top of that, its admirable gross margins indicate the mission-critical nature of its offerings.
Acuity Brands’s P/E ratio based on the next 12 months is 12.8x. Looking at the industrials landscape right now, Acuity Brands trades at a pretty interesting price. If you’re a fan of the business and management team, now is a good time to scoop up some shares.
Wall Street analysts have a consensus one-year price target of $389.38 on the company (compared to the current share price of $260.83), implying they see 49.3% upside in buying Acuity Brands in the short term.