
Bright Horizons (BFAM)
Bright Horizons faces an uphill battle. Its sales have underperformed and its low returns on capital show it has few growth opportunities.― StockStory Analyst Team
1. News


2. Summary
Why We Think Bright Horizons Will Underperform
Founded in 1986, Bright Horizons (NYSE:BFAM) is a global provider of child care, early education, and workforce support solutions.
- 14.1% annual revenue growth over the last five years was slower than its consumer discretionary peers
- Subpar operating margin constrains its ability to invest in process improvements or effectively respond to new competitive threats
- Poor free cash flow generation means it has few chances to reinvest for growth, repurchase shares, or distribute capital


Bright Horizons lacks the business quality we seek. Better businesses are for sale in the market.
Why There Are Better Opportunities Than Bright Horizons


Bright Horizons is trading at $79.76 per share, or 15.7x forward P/E. This multiple is lower than most consumer discretionary companies, but for good reason.
We’d rather pay up for companies with elite fundamentals than get a bargain on weak ones. Cheap stocks can be value traps, and as their performance deteriorates, they will stay cheap or get even cheaper.
3. Bright Horizons (BFAM) Research Report: Q4 CY2025 Update
Child care and education company Bright Horizons (NYSE:BFAM) reported revenue ahead of Wall Street’s expectations in Q4 CY2025, with sales up 8.8% year on year to $733.7 million. On the other hand, the company’s full-year revenue guidance of $3.1 billion at the midpoint came in 0.8% below analysts’ estimates. Its non-GAAP profit of $1.15 per share was 2.5% above analysts’ consensus estimates.
Bright Horizons (BFAM) Q4 CY2025 Highlights:
- Revenue: $733.7 million vs analyst estimates of $726.3 million (8.8% year-on-year growth, 1% beat)
- Adjusted EPS: $1.15 vs analyst estimates of $1.12 (2.5% beat)
- Adjusted EBITDA: $123.5 million vs analyst estimates of $121.5 million (16.8% margin, 1.6% beat)
- Adjusted EPS guidance for the upcoming financial year 2026 is $5 at the midpoint, missing analyst estimates by 2%
- Operating Margin: 6.2%, in line with the same quarter last year
- Free Cash Flow Margin: 15.7%, up from 13.2% in the same quarter last year
- Market Capitalization: $4.61 billion
Company Overview
Founded in 1986, Bright Horizons (NYSE:BFAM) is a global provider of child care, early education, and workforce support solutions.
At the core of Bright Horizons’s offerings are its child care and early education services. The company’s care facilities are designed to provide safe, nurturing, and engaging environments for children, fostering their development and learning from infancy through preschool. Bright Horizons adopts a research-based curriculum that emphasizes holistic child development, focusing on building cognitive, emotional, social, and physical skills.
In addition to child care, Bright Horizons provides a range of family-focused solutions. These include backup care services for times when regular care arrangements fall through, educational advisory services to help families navigate school and college admissions, and special needs services offering support for children with developmental challenges.
Bright Horizons also works with corporations to enhance employee well-being and productivity. The company collaborates with businesses to offer child care and work-life solutions as part of employee benefits packages. This partnership not only aids in attracting and retaining talent for corporate customers but also supports employees in achieving a better work-life balance, ultimately contributing to a more engaged and productive workforce.
4. Consumer Discretionary - Education Services
The Consumer Discretionary sector, by definition, is made up of companies selling non-essential goods and services. When economic conditions deteriorate or tastes shift, consumers can easily cut back or eliminate these purchases. For long-term investors with five-year holding periods, this creates a structural challenge: the sector is inherently hit-driven, with low switching costs and fickle customers. As a result, only a handful of companies can reliably grow demand and compound earnings over long periods, which is why our bar is high and High Quality ratings are rare.
Education services companies provide postsecondary instruction, professional certifications, test preparation, and corporate training, both online and in-person. Tailwinds include lifelong-learning demand driven by rapid technological change, employer-sponsored upskilling programs, and growing acceptance of online credentials. Headwinds are substantial: heavy regulatory oversight—particularly around student-loan eligibility and enrollment practices—can abruptly alter business models. Reputational risk from scrutiny over student outcomes and debt burdens constrains marketing strategies. Competition from free or low-cost digital alternatives (MOOCs, employer-built academies) pressures pricing, while enrollment is countercyclical to employment, making revenue streams unpredictable across economic cycles.
Bright Horizons's primary competitors include K12 Inc. (NYSE: LRN), G8 Education (ASX:GEM), Grand Canyon Education (NASDAQ: LOPE), and private companies KinderCare Education, Learning Care Group, Goddard Systems, and Primrose Schools.
5. Revenue Growth
Reviewing a company’s long-term sales performance reveals insights into its quality. Any business can experience short-term success, but top-performing ones enjoy sustained growth for years. Over the last five years, Bright Horizons grew its sales at a 14.1% compounded annual growth rate. Though this growth is acceptable on an absolute basis, we need to see more than just topline growth for the consumer discretionary sector, which can display significant earnings volatility. This means our bar for the sector is particularly high, reflecting the non-essential and hit-driven nature of the products and services offered. Additionally, five-year CAGR starts around Covid, when revenue was depressed then rebounded.
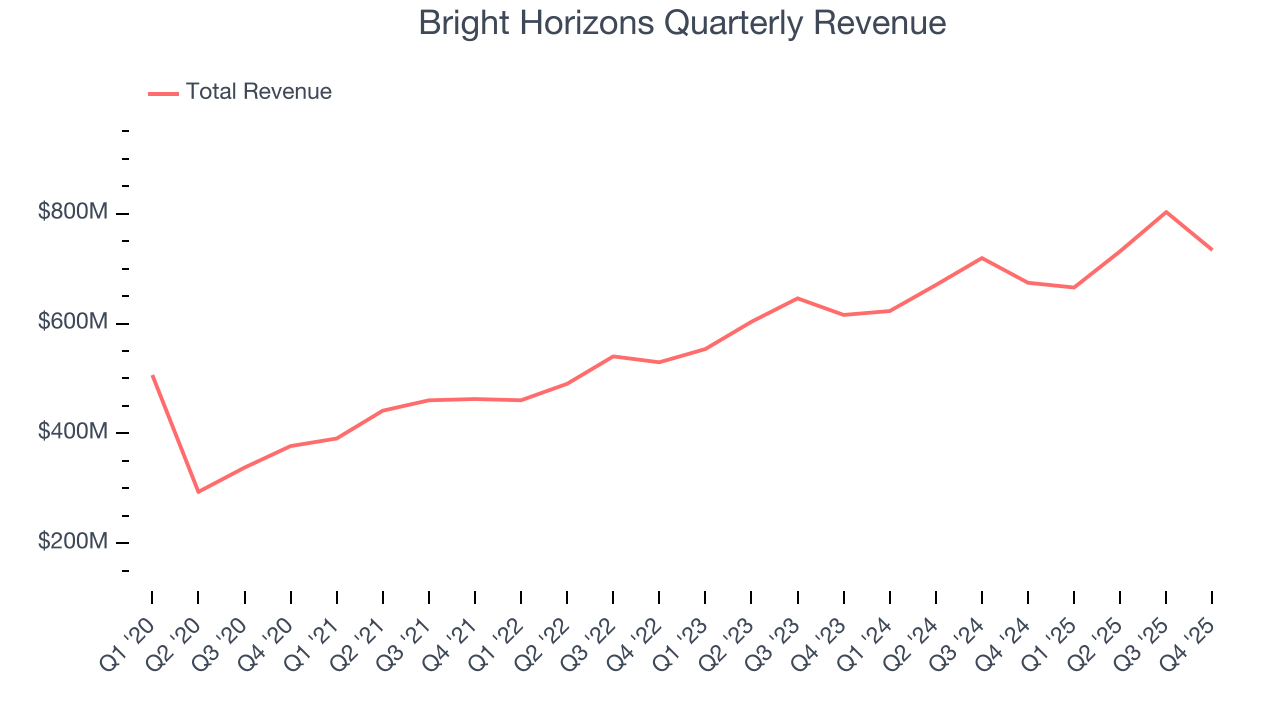
We at StockStory place the most emphasis on long-term growth, but within consumer discretionary, a stretched historical view may miss a company riding a successful new product or trend. Bright Horizons’s recent performance shows its demand has slowed as its annualized revenue growth of 10.1% over the last two years was below its five-year trend. We’re wary when companies in the sector see decelerations in revenue growth, as it could signal changing consumer tastes aided by low switching costs. 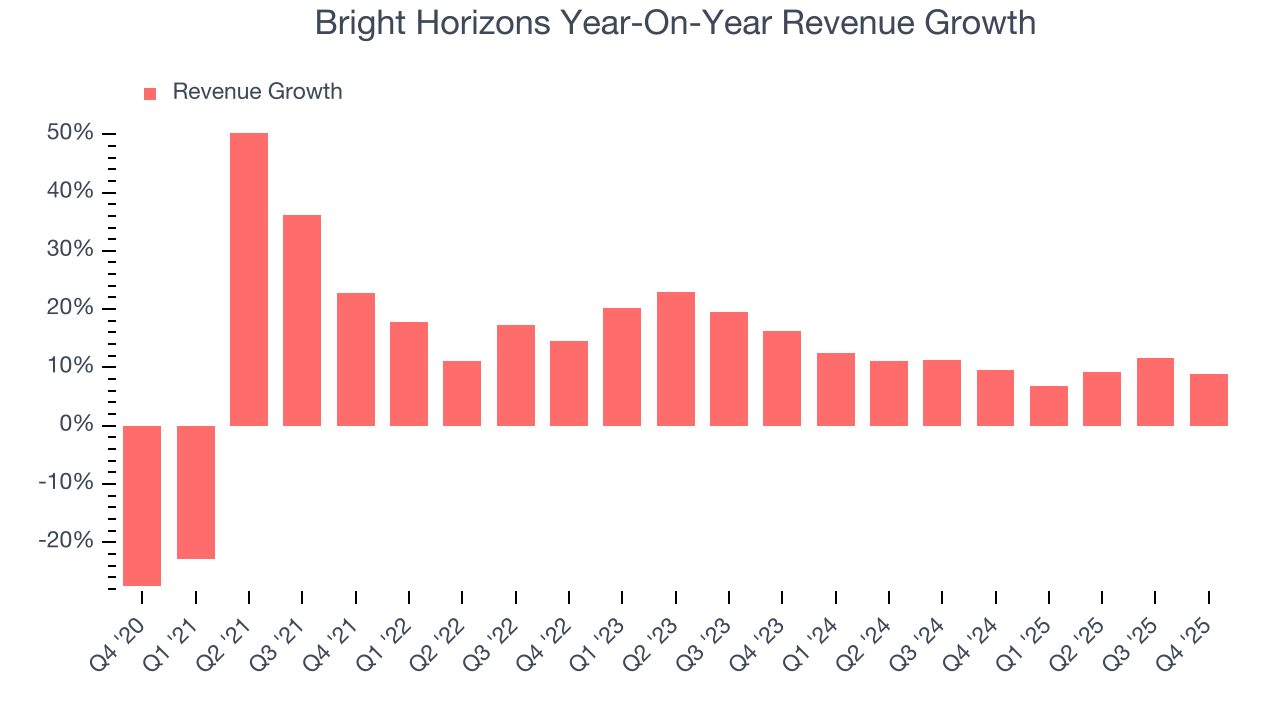
This quarter, Bright Horizons reported year-on-year revenue growth of 8.8%, and its $733.7 million of revenue exceeded Wall Street’s estimates by 1%.
Looking ahead, sell-side analysts expect revenue to grow 6.4% over the next 12 months, a deceleration versus the last two years. This projection doesn't excite us and indicates its products and services will see some demand headwinds.
6. Operating Margin
Bright Horizons’s operating margin has risen over the last 12 months and averaged 10% over the last two years. The company’s higher efficiency is a breath of fresh air, but its suboptimal cost structure means it still sports inadequate profitability for a consumer discretionary business.
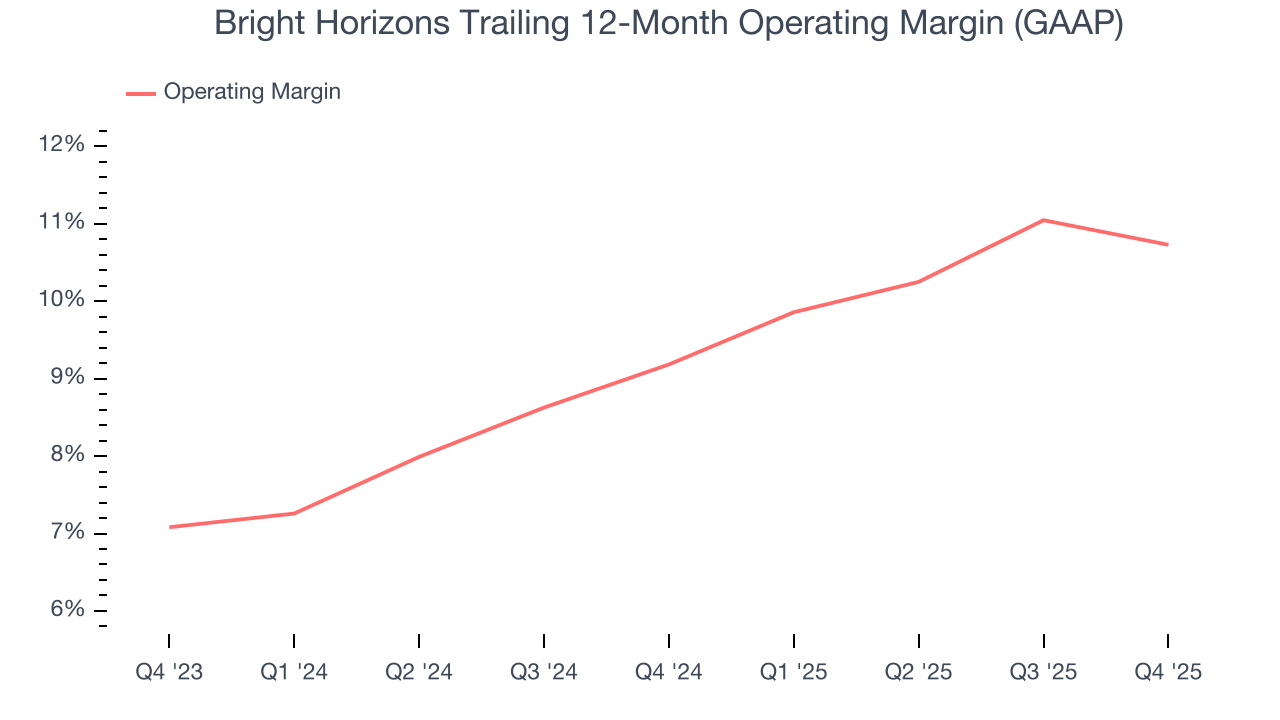
In Q4, Bright Horizons generated an operating margin profit margin of 6.2%, in line with the same quarter last year. This indicates the company’s overall cost structure has been relatively stable.
7. Earnings Per Share
We track the long-term change in earnings per share (EPS) for the same reason as long-term revenue growth. Compared to revenue, however, EPS highlights whether a company’s growth is profitable.
Bright Horizons’s EPS grew at an unimpressive 23.9% compounded annual growth rate over the last five years. On the bright side, this performance was better than its 14.1% annualized revenue growth and tells us the company became more profitable on a per-share basis as it expanded.
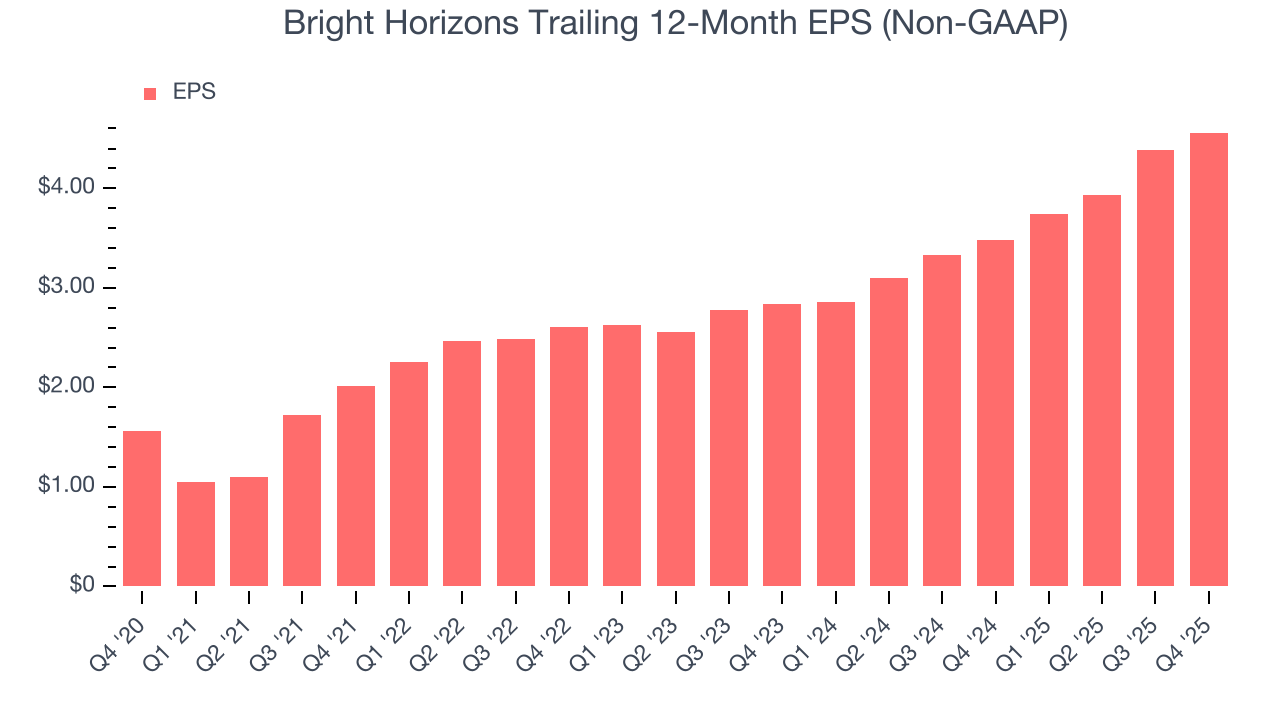
In Q4, Bright Horizons reported adjusted EPS of $1.15, up from $0.98 in the same quarter last year. This print beat analysts’ estimates by 2.5%. Over the next 12 months, Wall Street expects Bright Horizons’s full-year EPS of $4.56 to grow 11.4%.
8. Cash Is King
Free cash flow isn't a prominently featured metric in company financials and earnings releases, but we think it's telling because it accounts for all operating and capital expenses, making it tough to manipulate. Cash is king.
Bright Horizons has shown poor cash profitability over the last two years, giving the company limited opportunities to return capital to shareholders. Its free cash flow margin averaged 8.9%, lousy for a consumer discretionary business.
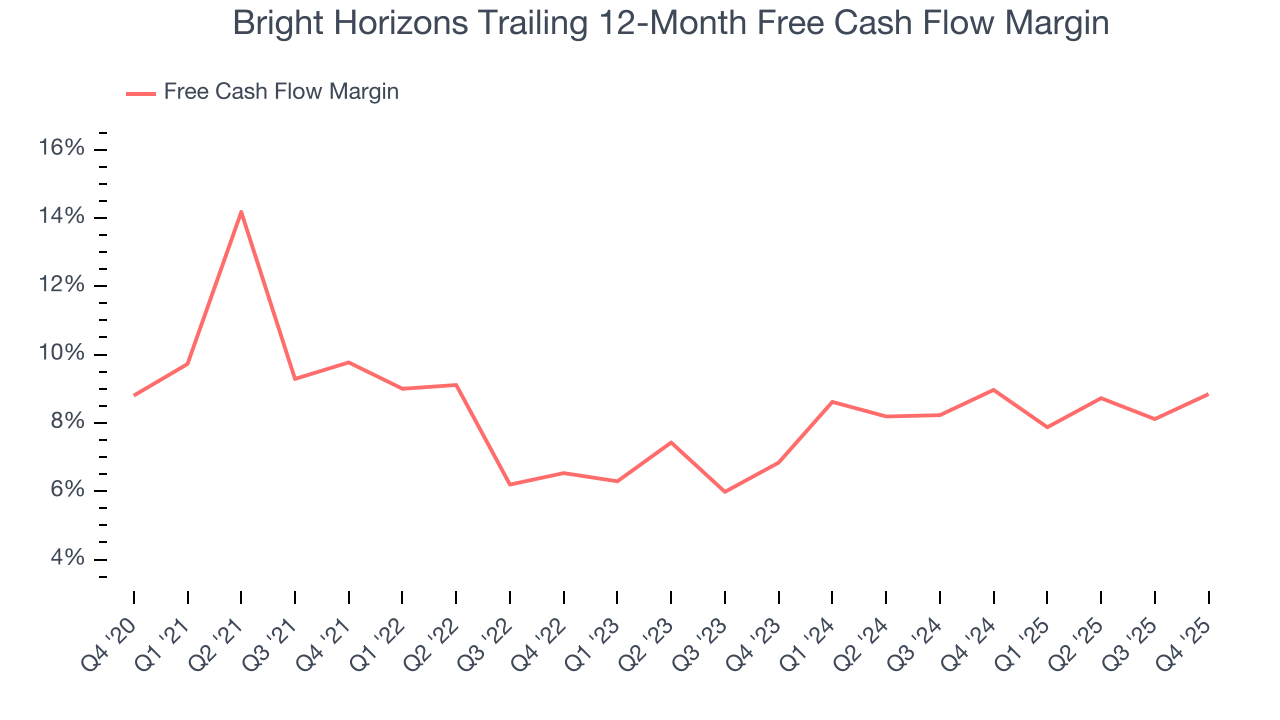
Bright Horizons’s free cash flow clocked in at $115.5 million in Q4, equivalent to a 15.7% margin. This result was good as its margin was 2.5 percentage points higher than in the same quarter last year, but we wouldn’t read too much into the short term because investment needs can be seasonal, leading to temporary swings. Long-term trends carry greater meaning.
Over the next year, analysts’ consensus estimates show they’re expecting Bright Horizons’s free cash flow margin of 8.8% for the last 12 months to remain the same.
9. Return on Invested Capital (ROIC)
EPS and free cash flow tell us whether a company was profitable while growing its revenue. But was it capital-efficient? A company’s ROIC explains this by showing how much operating profit it makes compared to the money it has raised (debt and equity).
Bright Horizons historically did a mediocre job investing in profitable growth initiatives. Its five-year average ROIC was 5.6%, somewhat low compared to the best consumer discretionary companies that consistently pump out 25%+.
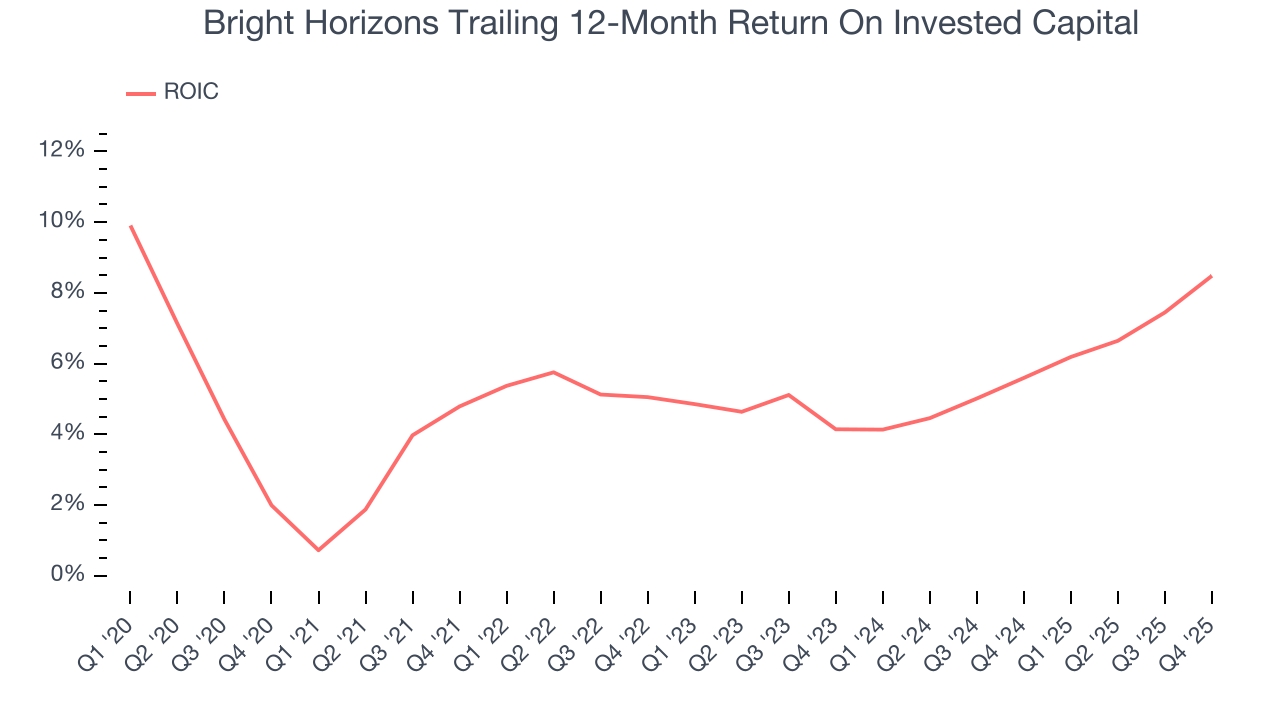
We like to invest in businesses with high returns, but the trend in a company’s ROIC is what often surprises the market and moves the stock price. Fortunately, Bright Horizons’s ROIC averaged 2.1 percentage point increases each year over the last few years. This is a good sign, and we hope the company can continue improving.
10. Balance Sheet Assessment
Bright Horizons reported $140.1 million of cash and $1.76 billion of debt on its balance sheet in the most recent quarter. As investors in high-quality companies, we primarily focus on two things: 1) that a company’s debt level isn’t too high and 2) that its interest payments are not excessively burdening the business.
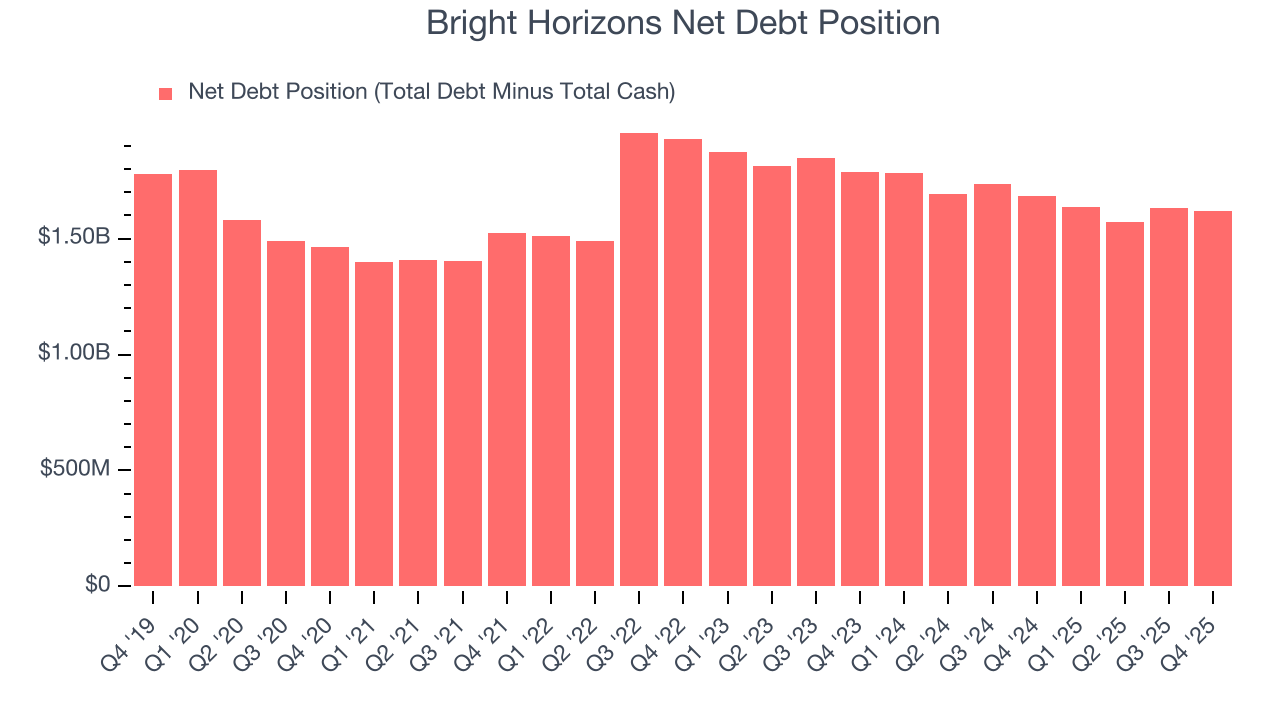
With $487.4 million of EBITDA over the last 12 months, we view Bright Horizons’s 3.3× net-debt-to-EBITDA ratio as safe. We also see its $44.76 million of annual interest expenses as appropriate. The company’s profits give it plenty of breathing room, allowing it to continue investing in growth initiatives.
11. Key Takeaways from Bright Horizons’s Q4 Results
It was good to see Bright Horizons narrowly top analysts’ revenue expectations this quarter. On the other hand, its full-year revenue guidance slightly missed and its full-year EPS guidance fell short of Wall Street’s estimates. Overall, this quarter could have been better. The stock traded down 3.5% to $79 immediately following the results.
12. Is Now The Time To Buy Bright Horizons?
Updated: March 25, 2026 at 11:19 PM EDT
A common mistake we notice when investors are deciding whether to buy a stock or not is that they simply look at the latest earnings results. Business quality and valuation matter more, so we urge you to understand these dynamics as well.
We see the value of companies helping consumers, but in the case of Bright Horizons, we’re out. On top of that, Bright Horizons’s Forecasted free cash flow margin for next year suggests the company will fail to improve its cash conversion, and its relatively low ROIC suggests management has struggled to find compelling investment opportunities.
Bright Horizons’s P/E ratio based on the next 12 months is 15.7x. This valuation tells us it’s a bit of a market darling with a lot of good news priced in - you can find more timely opportunities elsewhere.
Wall Street analysts have a consensus one-year price target of $97.11 on the company (compared to the current share price of $79.76).
Although the price target is bullish, readers should exercise caution because analysts tend to be overly optimistic. The firms they work for, often big banks, have relationships with companies that extend into fundraising, M&A advisory, and other rewarding business lines. As a result, they typically hesitate to say bad things for fear they will lose out. We at StockStory do not suffer from such conflicts of interest, so we’ll always tell it like it is.