
BNY (BK)
We’re wary of BNY. Its sales have underperformed and its low returns on capital show it has few growth opportunities.― StockStory Analyst Team
1. News


2. Summary
Why BNY Is Not Exciting
Tracing its roots back to 1784 when it was founded by Alexander Hamilton, BNY (NYSE:BK) is a global financial institution that provides asset servicing, wealth management, and investment services to institutions, corporations, and high-net-worth individuals.
- Sizable asset base leads to capital growth challenges as its 3.2% annual tangible book value per share increases over the last five years fell short of other financials companies
- The company has faced growth challenges as its 4.7% annual revenue increases over the last five years fell short of other financials companies
- On the plus side, its incremental sales over the last five years have been more profitable as its earnings per share increased by 13.4% annually, topping its revenue gains


BNY’s quality is insufficient. There are more profitable opportunities elsewhere.
Why There Are Better Opportunities Than BNY


BNY is trading at $114.35 per share, or 13.9x forward P/E. This multiple rich for the business quality. Not a great combination.
We’d rather pay up for companies with elite fundamentals than get a decent price on a poor one. High-quality businesses often have more durable earnings power, helping us sleep well at night.
3. BNY (BK) Research Report: Q4 CY2025 Update
Global financial services company BNY NYSE:BK) beat Wall Street’s revenue expectations in Q4 CY2025, with sales up 6.8% year on year to $5.18 billion. Its GAAP profit of $2.02 per share was 6.3% above analysts’ consensus estimates.
BNY (BK) Q4 CY2025 Highlights:
- Advisory and Services Fees: $2.61 billion (9.4% year-on-year growth)
- Revenue: $5.18 billion vs analyst estimates of $5.14 billion (6.8% year-on-year growth, 0.7% beat)
- Pre-tax Profit: $1.85 billion (35.6% margin)
- EPS (GAAP): $2.02 vs analyst estimates of $1.90 (6.3% beat)
- Tangible Book Value per Share: $31.64 vs analyst estimates of $30.73 (52.9% year-on-year growth, 2.9% beat)
- New medium-term targets unveiled
- Market Capitalization: $84.14 billion
Company Overview
Tracing its roots back to 1784 when it was founded by Alexander Hamilton, BNY (NYSE:BK) is a global financial institution that provides asset servicing, wealth management, and investment services to institutions, corporations, and high-net-worth individuals.
BNY operates through three main business segments: Securities Services, Market and Wealth Services, and Investment and Wealth Management. The Securities Services segment offers custody, fund administration, and issuer services, acting as a safeguard for trillions in assets across global capital markets. The company serves as a crucial intermediary in the financial ecosystem, processing transactions, maintaining records, and providing operational support for investment activities worldwide.
The Market and Wealth Services segment includes Pershing, which provides clearing and custody solutions to broker-dealers and wealth managers; Treasury Services, which handles global payments and liquidity management; and Clearance and Collateral Management, where BNY serves as the primary clearer of U.S. government securities. For example, when a pension fund needs to settle a large U.S. Treasury purchase, BNY's systems ensure the transaction completes securely and efficiently.
In its Investment and Wealth Management segment, BNY operates through multiple specialist investment firms offering various investment strategies across asset classes. The company's wealth management services cater to high-net-worth individuals and families, providing personalized investment management, estate planning, and private banking services.
BNY generates revenue primarily through fees based on assets under custody, administration, or management, as well as through transaction fees, foreign exchange services, and securities lending. With operations spanning the Americas, Europe, and Asia-Pacific, the company maintains a global footprint while adapting to local regulatory requirements in each jurisdiction where it operates.
4. Custody Bank
Custody banks safeguard financial assets and provide services like settlement, accounting, and regulatory compliance for institutional investors. Growth opportunities stem from increasing global assets under custody, demand for data analytics, and blockchain technology adoption for settlement efficiency. Challenges include fee pressure from large clients, substantial technology investment requirements, and competition from both traditional players and fintech firms entering the space.
BNY's primary competitors include other global custody banks and financial services firms such as State Street Corporation (NYSE:STT), JPMorgan Chase (NYSE:JPM), Citigroup (NYSE:C), and Northern Trust (NASDAQ:NTRS). In wealth management and investment services, it also competes with firms like BlackRock (NYSE:BLK) and Morgan Stanley (NYSE:MS).
5. Revenue Growth
Reviewing a company’s long-term sales performance reveals insights into its quality. Any business can have short-term success, but a top-tier one grows for years. Regrettably, BNY’s revenue grew at a tepid 4.7% compounded annual growth rate over the last five years. This fell short of our benchmark for the financials sector and is a rough starting point for our analysis.
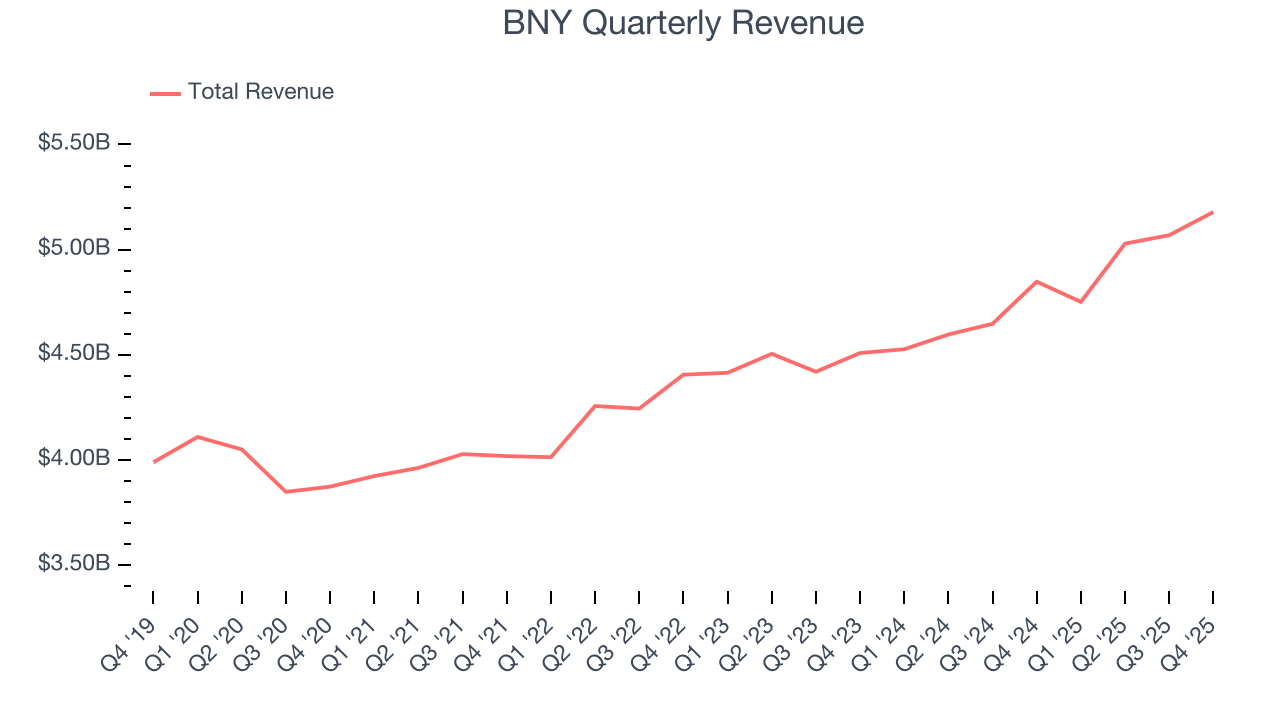
We at StockStory place the most emphasis on long-term growth, but within financials, a half-decade historical view may miss recent interest rate changes, market returns, and industry trends. BNY’s annualized revenue growth of 5.9% over the last two years is above its five-year trend, but we were still disappointed by the results. 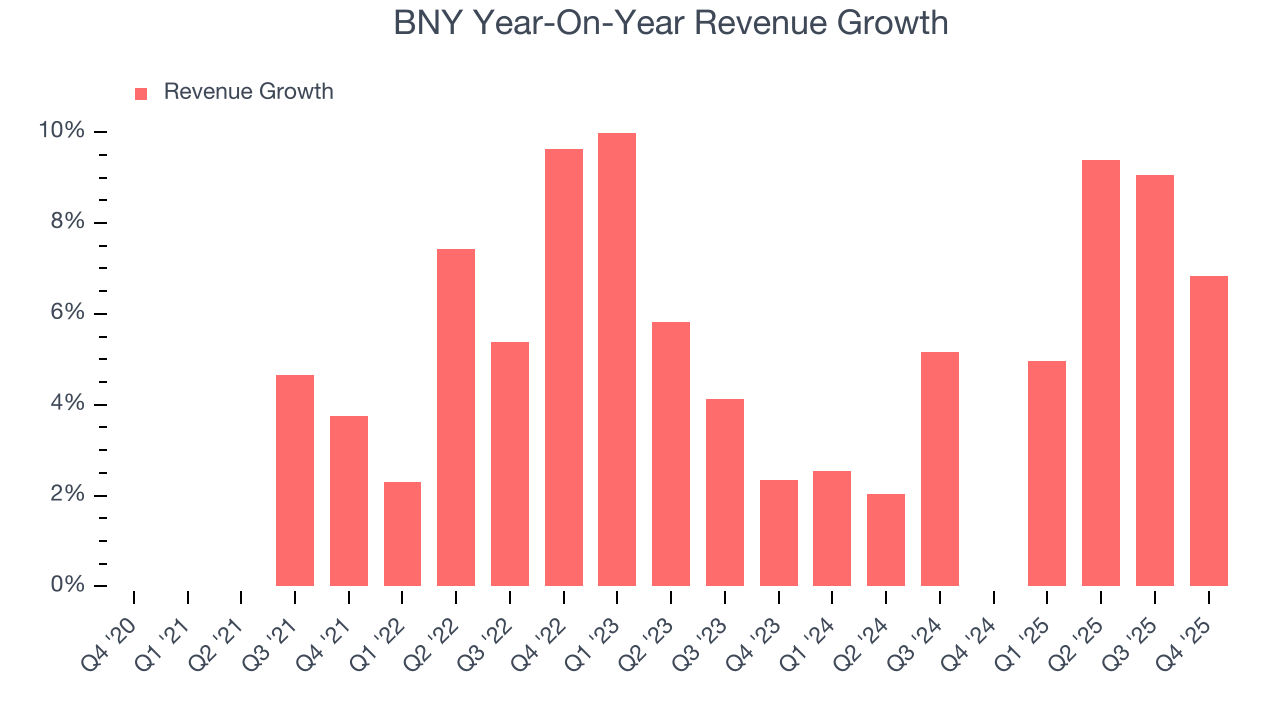 Note: Quarters not shown were determined to be outliers, impacted by outsized investment gains/losses that are not indicative of the recurring fundamentals of the business.
This quarter, BNY reported year-on-year revenue growth of 6.8%, and its $5.18 billion of revenue exceeded Wall Street’s estimates by 0.7%.
6. Pre-Tax Profit Margin
Revenue growth is one major determinant of business quality, and the efficiency of operations is another. For Custody Bank companies, we look at pre-tax profit rather than the operating margin that defines sectors such as consumer, tech, and industrials.
Interest income and expenses play a big role in financial institutions' profitability, so they should be factored into the definition of profit. Taxes, however, should not as they are largely out of a company's control. This is pre-tax profit by definition.
Over the last five years, BNY’s pre-tax profit margin has fallen by 7.1 percentage points, going from 29.2% to 35.2%. It has also expanded by 11.2 percentage points on a two-year basis, showing its expenses have consistently grown at a slower rate than revenue. This typically signals prudent management.
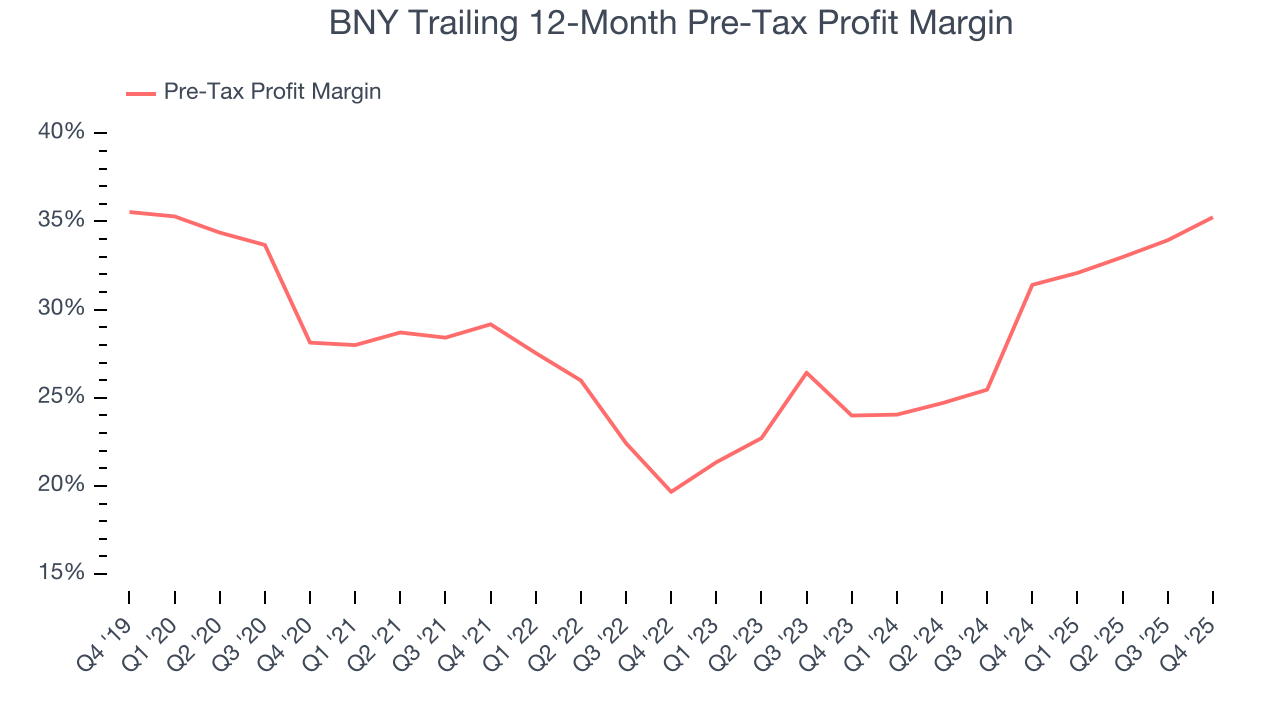
In Q4, BNY’s pre-tax profit margin was 35.6%. This result was 5.3 percentage points better than the same quarter last year.
7. Earnings Per Share
We track the long-term change in earnings per share (EPS) for the same reason as long-term revenue growth. Compared to revenue, however, EPS highlights whether a company’s growth is profitable.
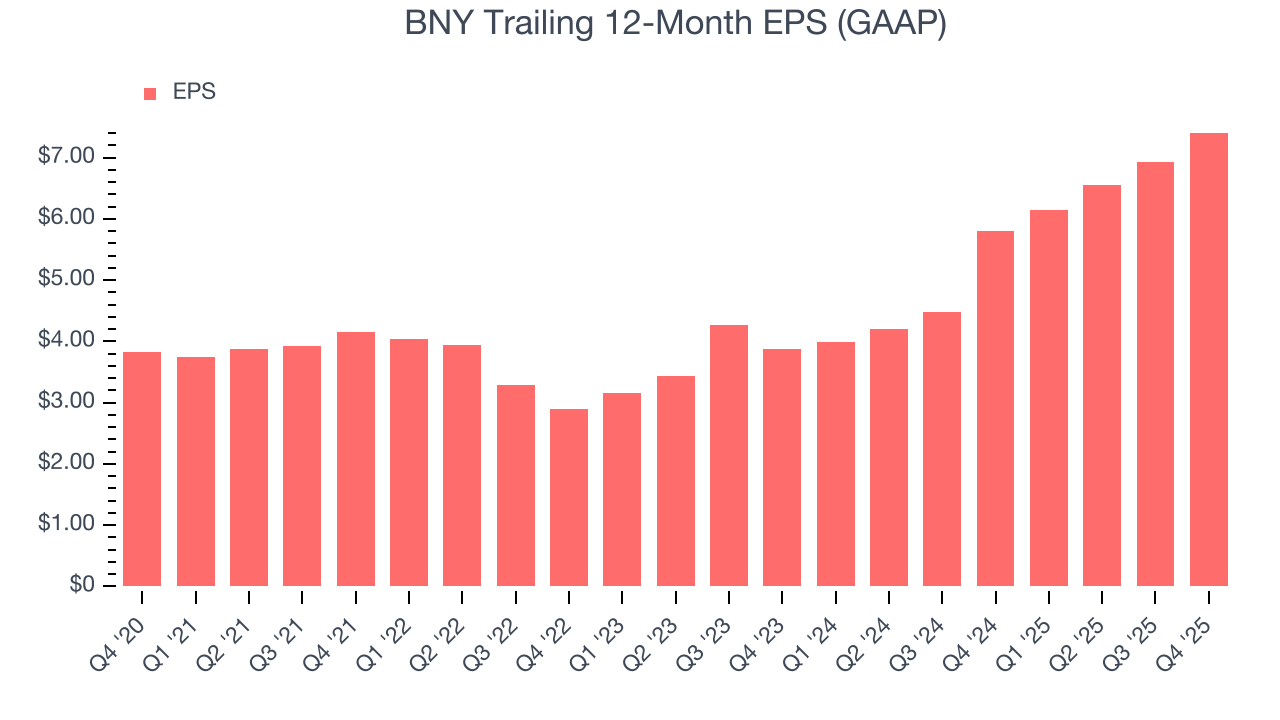
BNY’s EPS grew at a solid 14.1% compounded annual growth rate over the last five years, higher than its 4.7% annualized revenue growth. This tells us the company became more profitable on a per-share basis as it expanded.
Like with revenue, we analyze EPS over a more recent period because it can provide insight into an emerging theme or development for the business.
For BNY, its two-year annual EPS growth of 38.3% was higher than its five-year trend. We love it when earnings growth accelerates, especially when it accelerates off an already high base.
In Q4, BNY reported EPS of $2.02, up from $1.54 in the same quarter last year. This print beat analysts’ estimates by 6.3%. Over the next 12 months, Wall Street expects BNY’s full-year EPS of $7.41 to grow 12%.
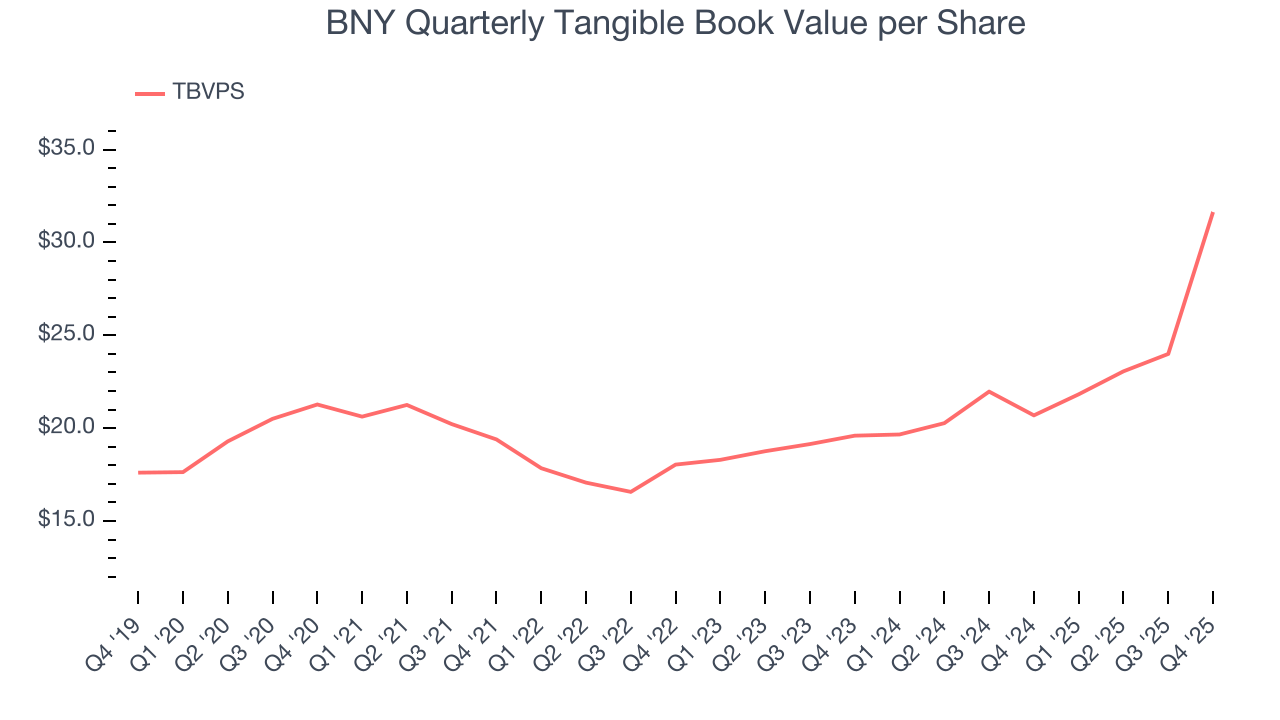
8. Tangible Book Value Per Share (TBVPS)
Diversified financial companies operate across multiple business segments, from investment banking and trading to wealth management and specialized lending. Their valuations hinge on balance sheet quality and the ability to compound shareholder equity across these diverse operations.
This is why we consider tangible book value per share (TBVPS) an important metric for the sector. TBVPS represents the real net worth per share across all business segments, providing a clear measure of shareholder equity regardless of the complexity of operations. EPS can become murky due to the complexity of multiple revenue streams, acquisition impacts, or accounting flexibility across different financial services, and book value resists financial engineering manipulation.
BNY’s TBVPS grew at a decent 8.3% annual clip over the last five years. TBVPS growth has accelerated recently, growing by 27.1% annually over the last two years from $19.60 to $31.64 per share.
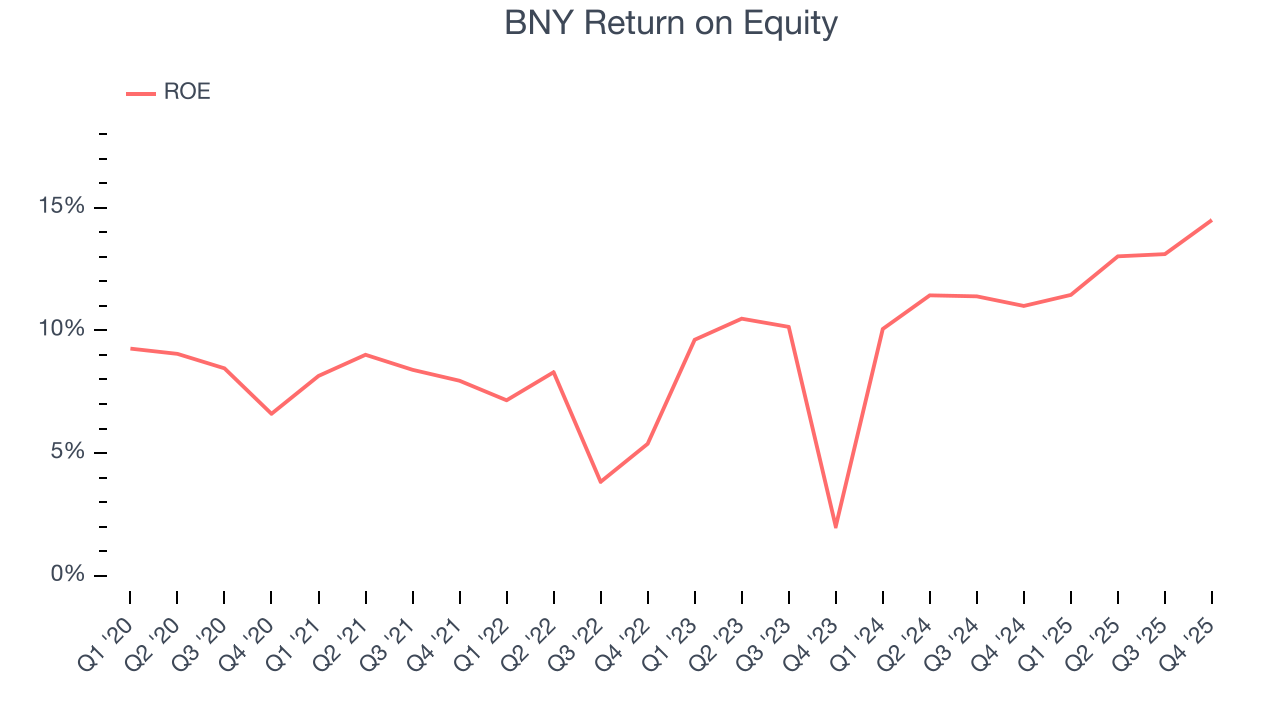
9. Return on Equity
Return on equity, or ROE, quantifies bank profitability relative to shareholder equity - an essential capital source for these institutions. Over extended periods, superior ROE performance drives faster shareholder wealth compounding through reinvestment, share repurchases, and dividend growth.
Over the last five years, BNY has averaged an ROE of 9.3%, uninspiring for a company operating in a sector where the average shakes out around 10%.
10. Balance Sheet Assessment
Leverage is core to a financial firm’s business model (loans funded by deposits). To ensure economic stability and avoid a repeat of the 2008 GFC, regulators require certain levels of capital and liquidity, focusing on the Tier 1 capital ratio.
Tier 1 capital is the highest-quality capital that a firm holds, consisting primarily of common stock and retained earnings, but also physical gold. It serves as the primary cushion against losses and is the first line of defense in times of financial distress.
This capital is divided by risk-weighted assets to derive the Tier 1 capital ratio. Risk-weighted means that cash and US treasury securities are assigned little risk while unsecured consumer loans and equity investments get much higher risk weights, for example.
New regulation after the 2008 financial crisis requires that all firms must maintain a Tier 1 capital ratio greater than 4.5%. On top of this, there are additional buffers based on scale, risk profile, and other regulatory classifications, so that at the end of the day, firms generally must maintain a 7-10% ratio at minimum.
Over the last two years, BNY has averaged a Tier 1 capital ratio of 11.8%, which is considered safe and well capitalized in the event that macro or market conditions suddenly deteriorate.
11. Key Takeaways from BNY’s Q4 Results
It was good to see BNY beat analysts’ EPS expectations this quarter. Overall, this print had some key positives. The market seemed to be hoping for more, perhaps in the new medium-term targets given the progress on strategic initiatives thus far, and the stock traded down 2.7% to $117.45 immediately following the results.
12. Is Now The Time To Buy BNY?
Updated: March 19, 2026 at 12:34 AM EDT
When considering an investment in BNY, investors should account for its valuation and business qualities as well as what’s happened in the latest quarter.
BNY isn’t a terrible business, but it doesn’t pass our bar. For starters, its revenue growth was uninspiring over the last five years. And while BNY’s expanding pre-tax profit margin shows the business has become more efficient, its TBVPS growth was weak over the last five years.
BNY’s P/E ratio based on the next 12 months is 13.9x. Beauty is in the eye of the beholder, but our analysis shows the upside isn’t great compared to the potential downside. We're fairly confident there are better stocks to buy right now.
Wall Street analysts have a consensus one-year price target of $133.83 on the company (compared to the current share price of $114.35).
Although the price target is bullish, readers should exercise caution because analysts tend to be overly optimistic. The firms they work for, often big banks, have relationships with companies that extend into fundraising, M&A advisory, and other rewarding business lines. As a result, they typically hesitate to say bad things for fear they will lose out. We at StockStory do not suffer from such conflicts of interest, so we’ll always tell it like it is.