Carrier Global (CARR)
Carrier Global faces an uphill battle. Its weak sales growth and declining returns on capital show its demand and profits are shrinking.― StockStory Analyst Team
1. News


2. Summary
Why We Think Carrier Global Will Underperform
Founded by the inventor of air conditioning, Carrier Global (NYSE:CARR) manufactures heating, ventilation, air conditioning, and refrigeration products.
- Sales are projected to remain flat over the next 12 months as demand decelerates from its two-year trend
- Organic sales performance over the past two years indicates the company may need to make strategic adjustments or rely on M&A to catalyze faster growth
- Annual earnings per share growth of 3.4% underperformed its revenue over the last two years, showing its incremental sales were less profitable


Carrier Global falls below our quality standards. Better businesses are for sale in the market.
Why There Are Better Opportunities Than Carrier Global


Carrier Global is trading at $62.70 per share, or 22.9x forward P/E. Carrier Global’s valuation may seem like a bargain, especially when stacked up against other industrials companies. We remind you that you often get what you pay for, though.
Cheap stocks can look like great bargains at first glance, but you often get what you pay for. These mediocre businesses often have less earnings power, meaning there is more reliance on a re-rating to generate good returns - an unlikely scenario for low-quality companies.
3. Carrier Global (CARR) Research Report: Q4 CY2025 Update
Heating, ventilation, air conditioning, and refrigeration company Carrier Global (NYSE:CARR) fell short of the market’s revenue expectations in Q4 CY2025, with sales falling 6% year on year to $4.84 billion. Its non-GAAP profit of $0.34 per share was 4.5% below analysts’ consensus estimates.
Carrier Global (CARR) Q4 CY2025 Highlights:
- Revenue: $4.84 billion vs analyst estimates of $4.99 billion (6% year-on-year decline, 3% miss)
- Adjusted EPS: $0.34 vs analyst expectations of $0.36 (4.5% miss)
- Adjusted EBITDA: $449 million vs analyst estimates of $807.8 million (9.3% margin, 44.4% miss)
- Adjusted EPS guidance for the upcoming financial year 2026 is $2.80 at the midpoint, missing analyst estimates by 2.6%
- Operating Margin: 2.1%, down from 15% in the same quarter last year
- Free Cash Flow was $909 million, up from -$85 million in the same quarter last year
- Organic Revenue fell 9% year on year (miss)
- Market Capitalization: $53.52 billion
Company Overview
Founded by the inventor of air conditioning, Carrier Global (NYSE:CARR) manufactures heating, ventilation, air conditioning, and refrigeration products.
A century ago in Pittsburg, PA, Willis Carrier invented and designed the first air conditioning system. The invention revolutionized the way people lived and where people could live. Fast forward to now, Carrier Global manufactures heating, ventilation, air conditioning (HVAC), and refrigeration products. It also sells building automation systems that help commercial buildings increase energy efficiency during climate control efforts.
Its HVAC offerings include heat pumps, air conditioning, and thermostats while its refrigeration division includes commercial refrigeration systems, transport refrigeration units, and cold storage solutions. Lastly, Carrier Global’s building automation solutions include fire detection and suppression systems, security systems, and building monitoring software.
Most of Carrier Global’s revenue comes from sales of its climate control equipment, which is generally sold to commercial customers through direct sales. Residential customers reached through authorized distributors account for a smaller portion of its revenue. Lastly, maintenance services make up the company’s recurring revenue base and are offered to customers after the initial sale of its equipment. This is a small portion of the company’s total revenue.
4. HVAC and Water Systems
Many HVAC and water systems companies sell essential, non-discretionary infrastructure for buildings. Since the useful lives of these water heaters and vents are fairly standard, these companies have a portion of predictable replacement revenue. In the last decade, trends in energy efficiency and clean water are driving innovation that is leading to incremental demand. On the other hand, new installations for these companies are at the whim of residential and commercial construction volumes, which tend to be cyclical and can be impacted heavily by economic factors such as interest rates.
Other companies offering HVAC or refrigeration solutions include Trane Technologies (NYSE:TT), Johnson Controls International, (NYSE:JCI), and Lennox International (NYSE:LII)
5. Revenue Growth
Examining a company’s long-term performance can provide clues about its quality. Any business can experience short-term success, but top-performing ones enjoy sustained growth for years. Regrettably, Carrier Global’s sales grew at a sluggish 4.5% compounded annual growth rate over the last five years. This fell short of our benchmark for the industrials sector and is a poor baseline for our analysis.
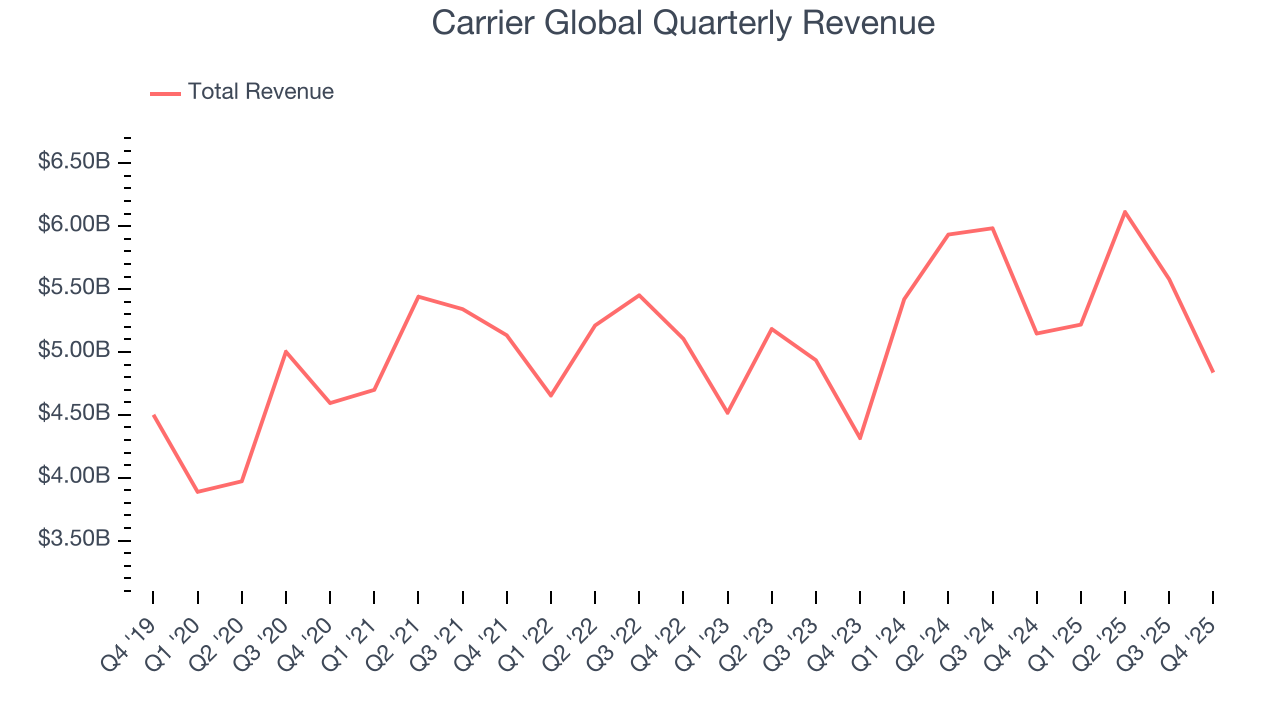
We at StockStory place the most emphasis on long-term growth, but within industrials, a half-decade historical view may miss cycles, industry trends, or a company capitalizing on catalysts such as a new contract win or a successful product line. Carrier Global’s annualized revenue growth of 7.1% over the last two years is above its five-year trend, but we were still disappointed by the results. 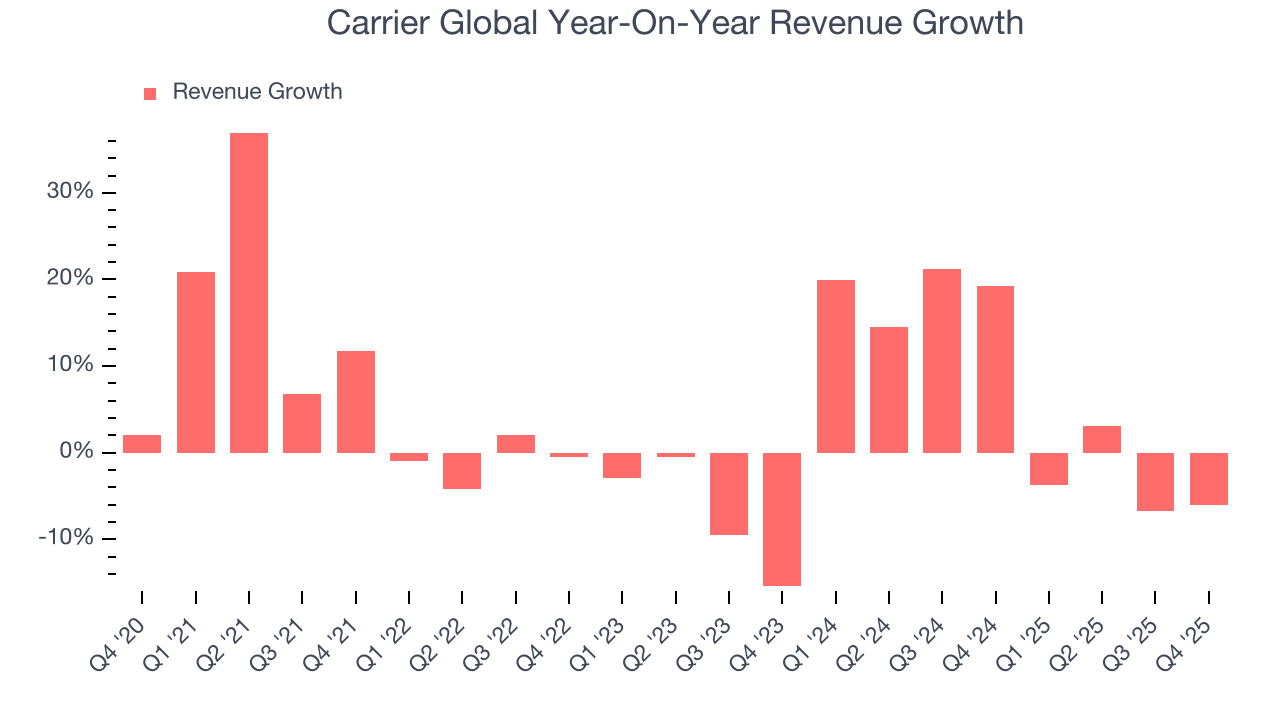
We can better understand the company’s sales dynamics by analyzing its organic revenue, which strips out one-time events like acquisitions and currency fluctuations that don’t accurately reflect its fundamentals. Over the last two years, Carrier Global’s organic revenue averaged 1% year-on-year growth. Because this number is lower than its two-year revenue growth, we can see that some mixture of acquisitions and foreign exchange rates boosted its headline results. 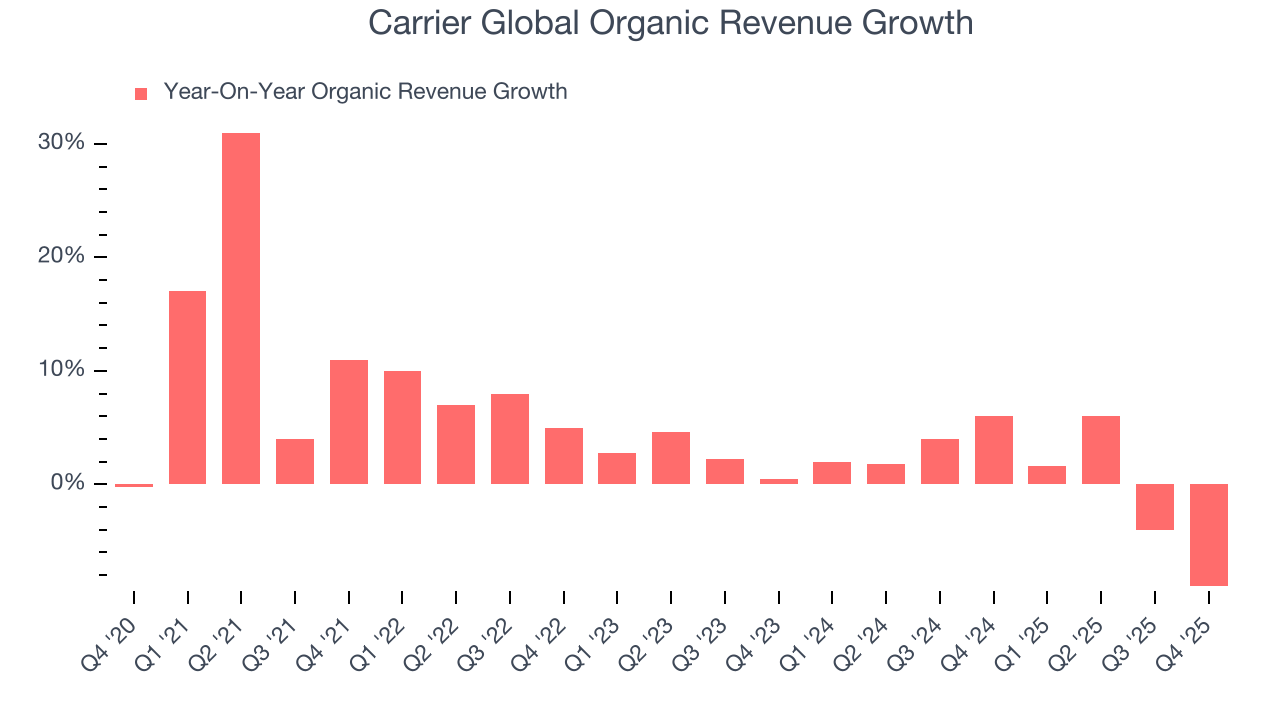
This quarter, Carrier Global missed Wall Street’s estimates and reported a rather uninspiring 6% year-on-year revenue decline, generating $4.84 billion of revenue.
Looking ahead, sell-side analysts expect revenue to grow 3.5% over the next 12 months, a deceleration versus the last two years. This projection doesn't excite us and suggests its products and services will see some demand headwinds.
6. Gross Margin & Pricing Power
Carrier Global has bad unit economics for an industrials company, giving it less room to reinvest and develop new offerings. As you can see below, it averaged a 26.4% gross margin over the last five years. That means Carrier Global paid its suppliers a lot of money ($73.56 for every $100 in revenue) to run its business. 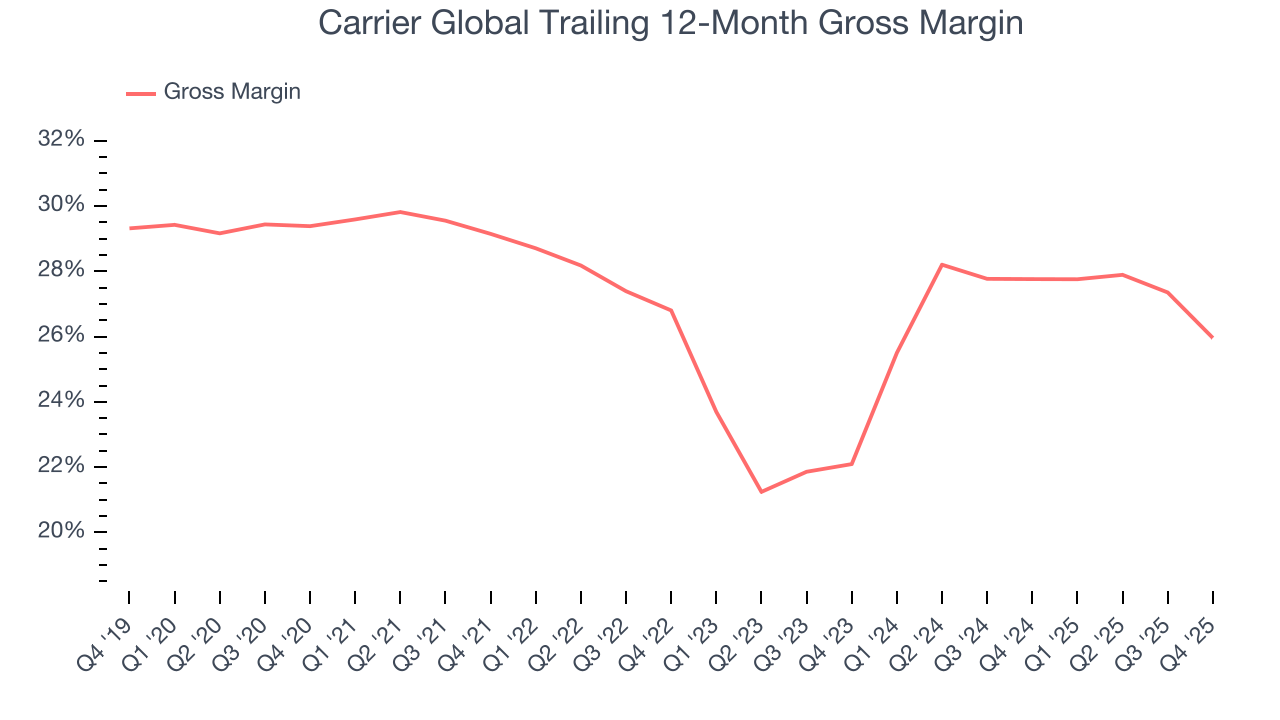
This quarter, Carrier Global’s gross profit margin was 19.9%, marking a 6.3 percentage point decrease from 26.2% in the same quarter last year. Carrier Global’s full-year margin has also been trending down over the past 12 months, decreasing by 1.8 percentage points. If this move continues, it could suggest a more competitive environment with some pressure to lower prices and higher input costs (such as raw materials and manufacturing expenses).
7. Operating Margin
Carrier Global has been an efficient company over the last five years. It was one of the more profitable businesses in the industrials sector, boasting an average operating margin of 13.6%. This result was particularly impressive because of its low gross margin, which is mostly a factor of what it sells and takes huge shifts to move meaningfully. Companies have more control over their operating margins, and it’s a show of well-managed operations if they’re high when gross margins are low.
Looking at the trend in its profitability, Carrier Global’s operating margin decreased by 2.8 percentage points over the last five years. This raises questions about the company’s expense base because its revenue growth should have given it leverage on its fixed costs, resulting in better economies of scale and profitability.
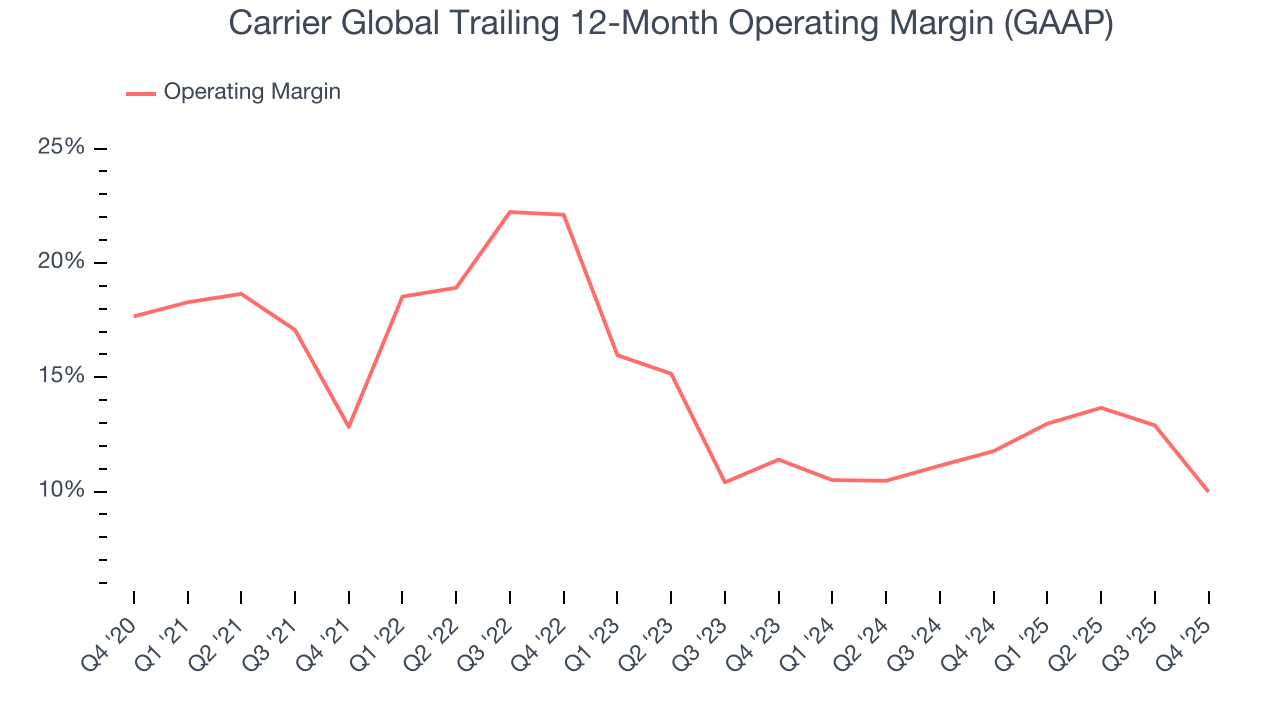
In Q4, Carrier Global generated an operating margin profit margin of 2.1%, down 12.9 percentage points year on year. Since Carrier Global’s operating margin decreased more than its gross margin, we can assume it was less efficient because expenses such as marketing, R&D, and administrative overhead increased.
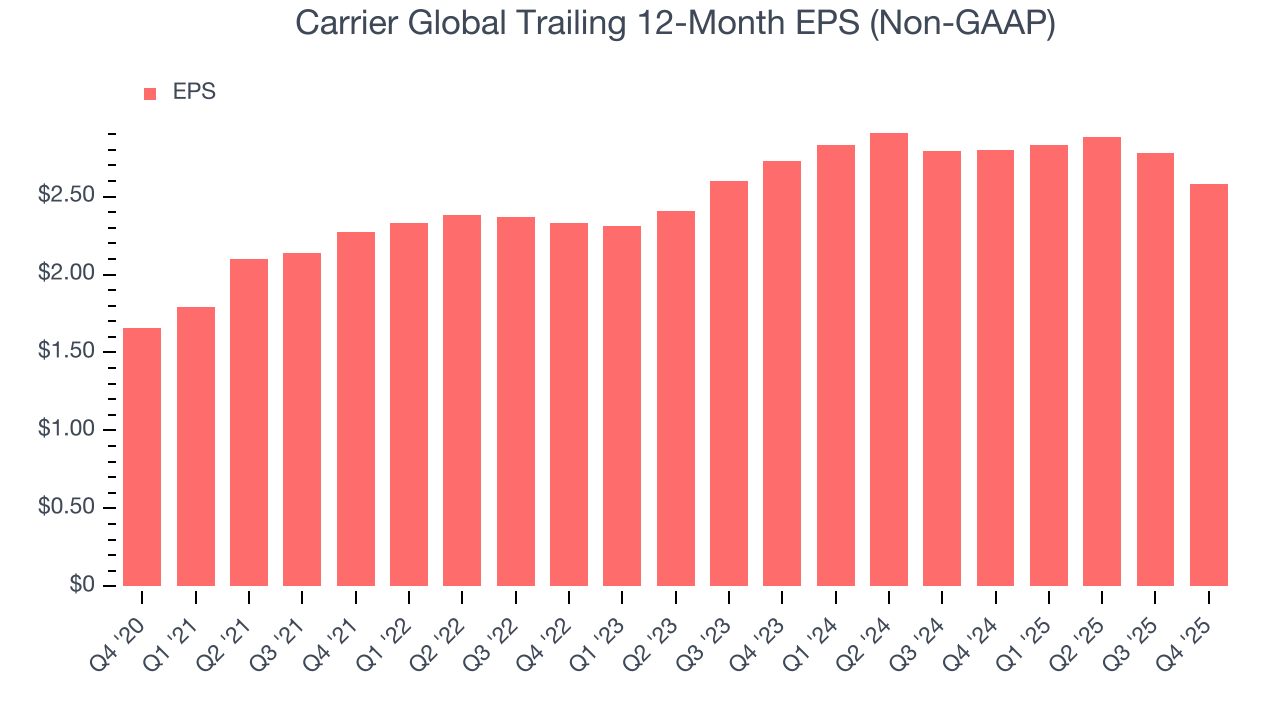
8. Earnings Per Share
We track the long-term change in earnings per share (EPS) for the same reason as long-term revenue growth. Compared to revenue, however, EPS highlights whether a company’s growth is profitable.
Carrier Global’s EPS grew at a decent 9.2% compounded annual growth rate over the last five years, higher than its 4.5% annualized revenue growth. However, this alone doesn’t tell us much about its business quality because its operating margin didn’t improve.
We can take a deeper look into Carrier Global’s earnings quality to better understand the drivers of its performance. A five-year view shows that Carrier Global has repurchased its stock, shrinking its share count by 4.7%. This tells us its EPS outperformed its revenue not because of increased operational efficiency but financial engineering, as buybacks boost per share earnings. 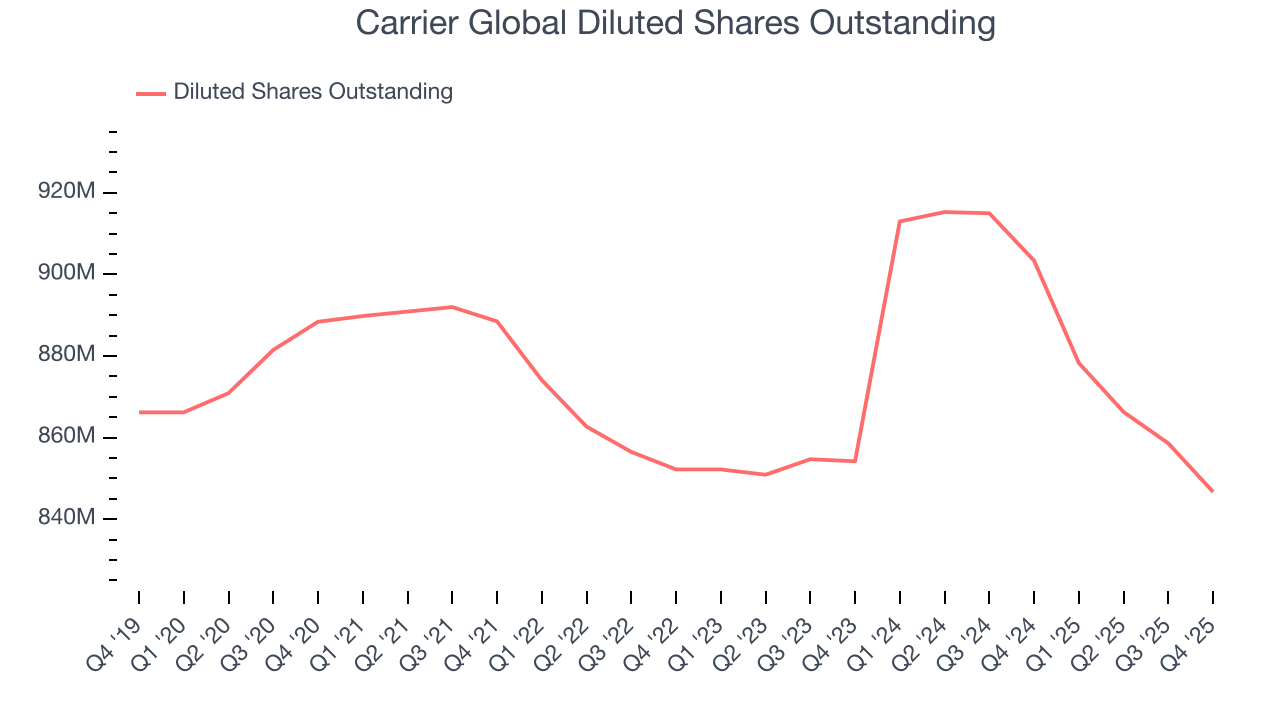
Like with revenue, we analyze EPS over a more recent period because it can provide insight into an emerging theme or development for the business.
For Carrier Global, its two-year annual EPS declines of 2.8% mark a reversal from its five-year trend. We hope Carrier Global can return to earnings growth in the future.
In Q4, Carrier Global reported adjusted EPS of $0.34, down from $0.54 in the same quarter last year. This print missed analysts’ estimates, but we care more about long-term adjusted EPS growth than short-term movements. Over the next 12 months, Wall Street expects Carrier Global’s full-year EPS of $2.58 to grow 12.4%.
9. Cash Is King
Although earnings are undoubtedly valuable for assessing company performance, we believe cash is king because you can’t use accounting profits to pay the bills.
Carrier Global has shown decent cash profitability, giving it some flexibility to reinvest or return capital to investors. The company’s free cash flow margin averaged 7.3% over the last five years, slightly better than the broader industrials sector.
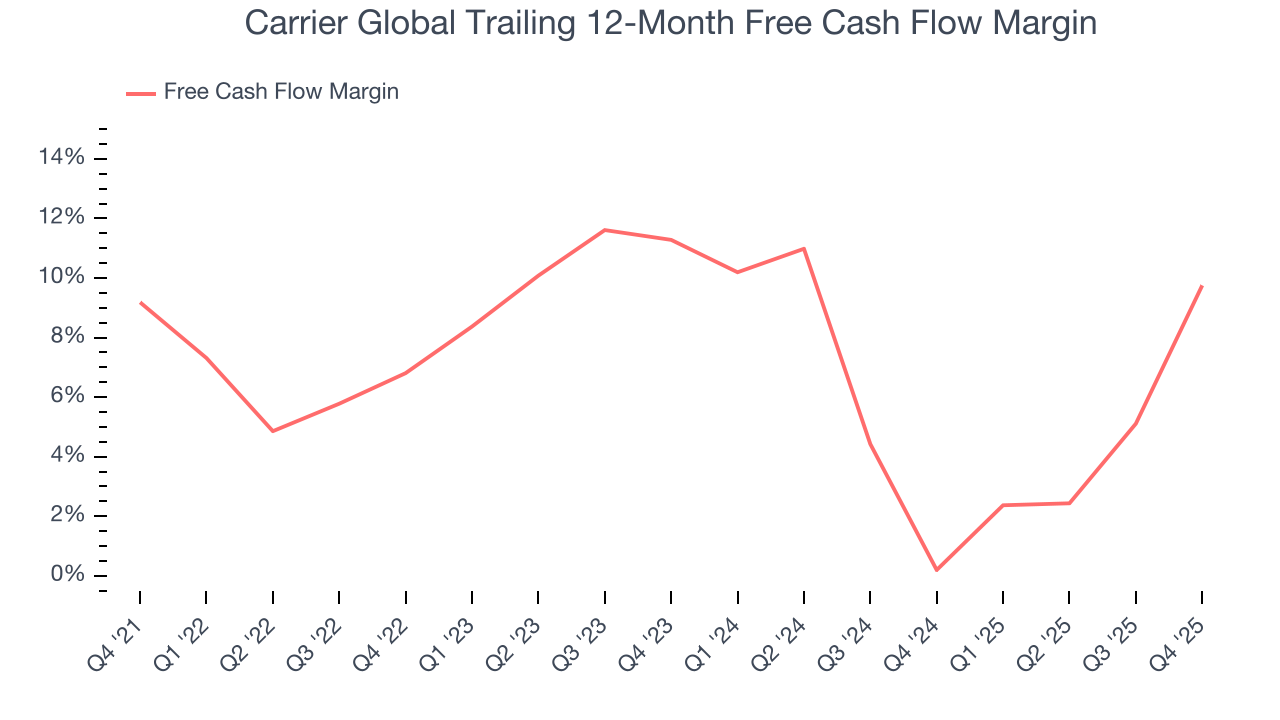
Carrier Global’s free cash flow clocked in at $909 million in Q4, equivalent to a 18.8% margin. Its cash flow turned positive after being negative in the same quarter last year, but we wouldn’t read too much into the short term because investment needs can be seasonal, leading to temporary swings. Long-term trends are more important.
10. Return on Invested Capital (ROIC)
EPS and free cash flow tell us whether a company was profitable while growing its revenue. But was it capital-efficient? A company’s ROIC explains this by showing how much operating profit it makes compared to the money it has raised (debt and equity).
Although Carrier Global hasn’t been the highest-quality company lately because of its poor top-line performance, it historically found a few growth initiatives that worked out well. Its five-year average ROIC was 14.8%, impressive for an industrials business.
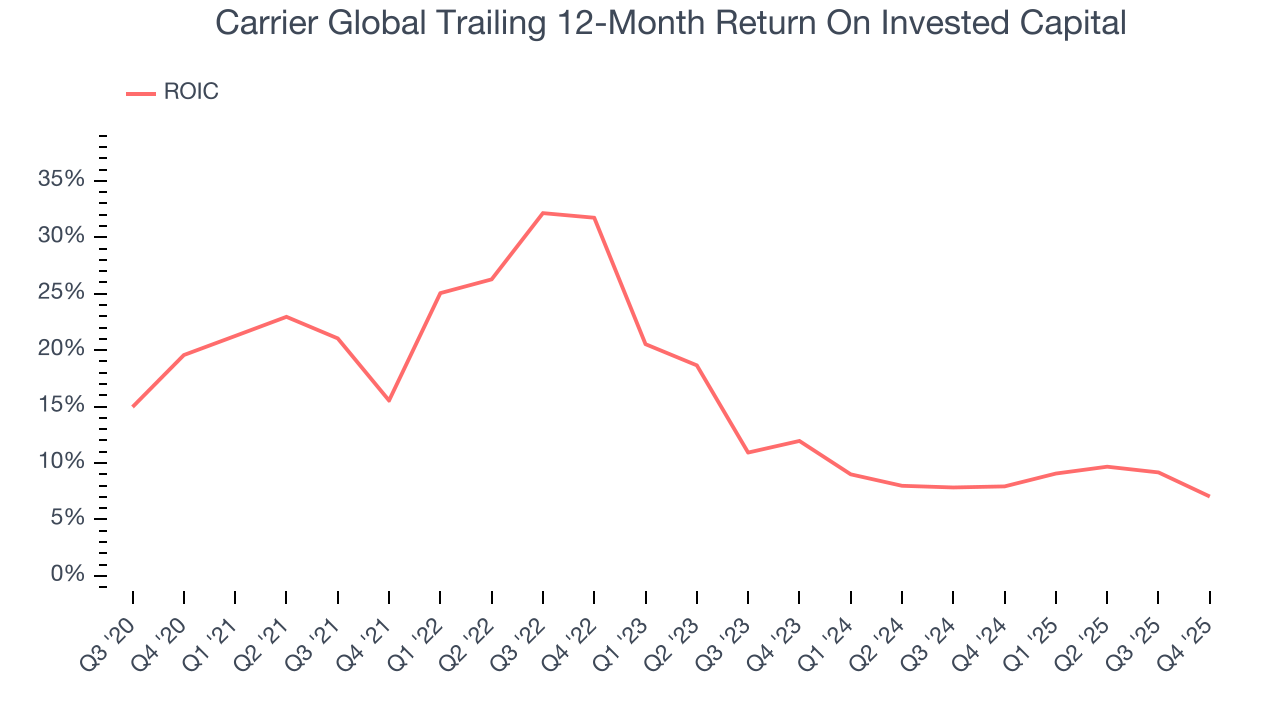
We like to invest in businesses with high returns, but the trend in a company’s ROIC is what often surprises the market and moves the stock price. Unfortunately, Carrier Global’s ROIC has decreased significantly over the last few years. We like what management has done in the past, but its declining returns are perhaps a symptom of fewer profitable growth opportunities.
11. Balance Sheet Assessment
Carrier Global reported $1.56 billion of cash and $11.83 billion of debt on its balance sheet in the most recent quarter. As investors in high-quality companies, we primarily focus on two things: 1) that a company’s debt level isn’t too high and 2) that its interest payments are not excessively burdening the business.
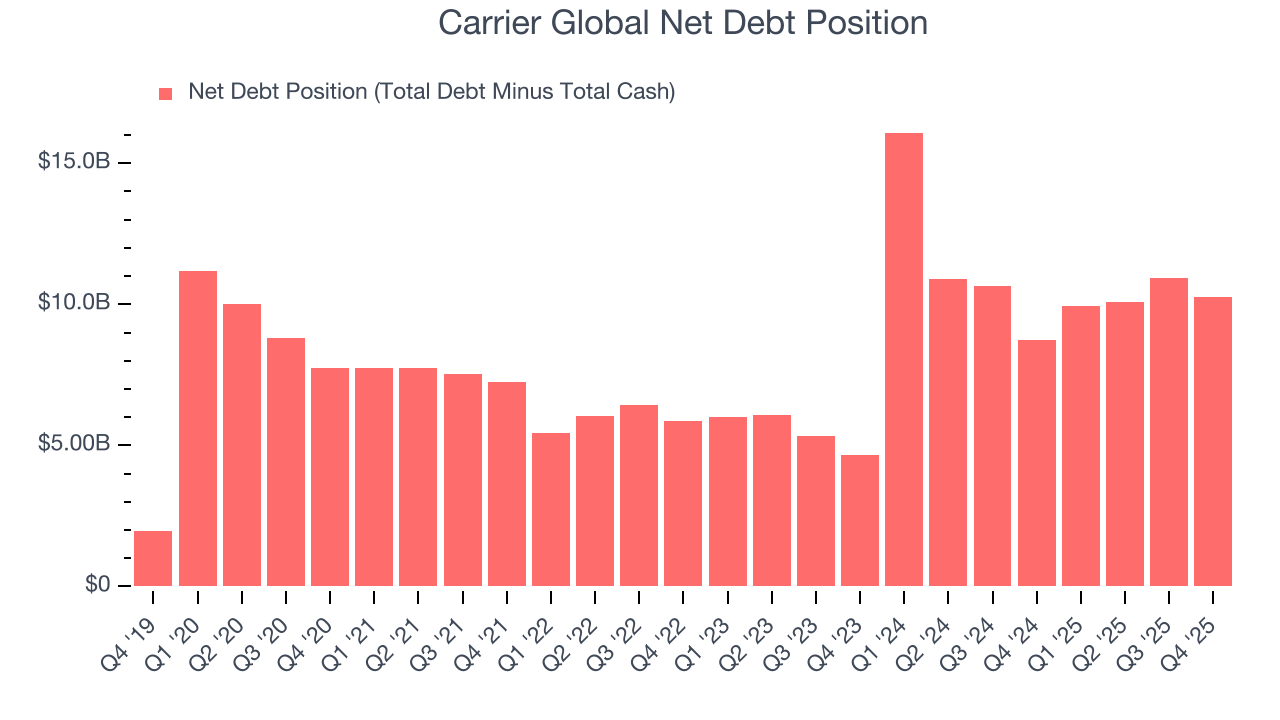
With $4.23 billion of EBITDA over the last 12 months, we view Carrier Global’s 2.4× net-debt-to-EBITDA ratio as safe. We also see its $270 million of annual interest expenses as appropriate. The company’s profits give it plenty of breathing room, allowing it to continue investing in growth initiatives.
12. Key Takeaways from Carrier Global’s Q4 Results
We struggled to find many positives in these results. Its revenue missed and its EBITDA fell short of Wall Street’s estimates. Overall, this was a weaker quarter. The stock traded down 4.6% to $60.62 immediately following the results.
13. Is Now The Time To Buy Carrier Global?
Updated: February 5, 2026 at 8:18 AM EST
The latest quarterly earnings matters, sure, but we actually think longer-term fundamentals and valuation matter more. Investors should consider all these pieces before deciding whether or not to invest in Carrier Global.
We cheer for all companies making their customers lives easier, but in the case of Carrier Global, we’ll be cheering from the sidelines. For starters, its revenue growth was uninspiring over the last five years, and analysts expect its demand to deteriorate over the next 12 months. And while its strong operating margins show it’s a well-run business, the downside is its diminishing returns show management's prior bets haven't worked out. On top of that, its organic revenue growth has disappointed.
Carrier Global’s P/E ratio based on the next 12 months is 21.9x. This valuation multiple is fair, but we don’t have much confidence in the company. There are superior stocks to buy right now.
Wall Street analysts have a consensus one-year price target of $70.54 on the company (compared to the current share price of $60.62).
Although the price target is bullish, readers should exercise caution because analysts tend to be overly optimistic. The firms they work for, often big banks, have relationships with companies that extend into fundraising, M&A advisory, and other rewarding business lines. As a result, they typically hesitate to say bad things for fear they will lose out. We at StockStory do not suffer from such conflicts of interest, so we’ll always tell it like it is.