
Chubb (CB)
We aren’t fans of Chubb. It’s recently struggled to grow its revenue, a worrying sign for investors seeking high-quality stocks.― StockStory Analyst Team
1. News
2. Summary
Why Chubb Is Not Exciting
Dating back to when a Civil War veteran created a frost-proof water meter, Chubb Limited (NYSE:CB) provides commercial and personal property and casualty insurance, reinsurance, and life insurance products to a diverse client base across 54 countries.
- Sizable asset base leads to capital growth challenges as its 7.4% annual book value per share increases over the last five years fell short of other insurance companies
- One positive is that its pre-tax profit margin expanded by 10.4 percentage points over the last five years as it scaled and became more efficient


Chubb doesn’t live up to our standards. We’re hunting for superior stocks elsewhere.
Why There Are Better Opportunities Than Chubb


Chubb is trading at $322.88 per share, or 1.5x forward P/B. This multiple expensive for its subpar fundamentals.
It’s better to pay up for high-quality businesses with strong long-term earnings potential rather than to buy lower-quality companies with open questions and big downside risks.
3. Chubb (CB) Research Report: Q4 CY2025 Update
Global insurance provider Chubb Limited (NYSE:CB) met Wall Streets revenue expectations in Q4 CY2025, with sales up 6.5% year on year to $15.22 billion. Its non-GAAP profit of $7.52 per share was 11% above analysts’ consensus estimates.
Chubb (CB) Q4 CY2025 Highlights:
- Net Premiums Earned: $13.53 billion vs analyst estimates of $13.6 billion (7.4% year-on-year growth, in line)
- Revenue: $15.22 billion vs analyst estimates of $15.23 billion (6.5% year-on-year growth, in line)
- Combined Ratio: 81.2% vs analyst estimates of 84.3% (313.3 basis point beat)
- Adjusted EPS: $7.52 vs analyst estimates of $6.78 (11% beat)
- Book Value per Share: $188.59 vs analyst estimates of $200.10 (18% year-on-year growth, 5.8% miss)
- Market Capitalization: $122.5 billion
Company Overview
Dating back to when a Civil War veteran created a frost-proof water meter, Chubb Limited (NYSE:CB) provides commercial and personal property and casualty insurance, reinsurance, and life insurance products to a diverse client base across 54 countries.
Chubb operates through six distinct segments addressing different markets and needs. The North America Commercial P&C Insurance segment serves businesses of all sizes with specialized coverage including professional liability, cyber risk, and environmental protection. Its North America Personal P&C Insurance targets affluent individuals with high-value property, automobile, and valuable article coverage. The Agricultural Insurance segment provides crop insurance and farm protection, while Overseas General Insurance handles international commercial and personal lines.
Chubb's distribution network includes independent agents, brokers, wholesalers, and direct-to-consumer channels, varying by product line and geography. For high-net-worth clients, the company offers comprehensive protection extending beyond standard policies, covering fine art, collector cars, and cyber risks. In the commercial sector, Chubb provides specialized solutions for industries ranging from technology to healthcare, offering both traditional coverage and emerging risk protection.
The company generates revenue through premium collection and investment income on its substantial portfolio. Its Global Reinsurance segment offers catastrophe and traditional reinsurance, while the Life Insurance segment (primarily operating in Asia) sells protection and savings products including whole life, term life, and critical illness coverage. With its 2022 acquisition of Cigna's Asian insurance business and majority ownership of Huatai Insurance Group in China, Chubb has significantly expanded its international footprint, particularly in Asian markets.
4. Multi-Line Insurance
Multi-line insurance companies operate a diversified business model, offering a broad suite of products that span both Property & Casualty (P&C) and Life & Health (L&H) insurance. This diversification allows them to generate revenue from multiple, often uncorrelated, underwriting pools while also earning investment income on their combined float. Interest rates matter for the sector (and make it cyclical), with higher rates allowing insurers to reinvest their fixed-income portfolios at more attractive yields and vice versa. The market environment also matters for P&C operations specifically, with a 'hard market' characterized by pricing increases that outstrip claim costs, resulting in higher profits while a 'soft market' is the opposite. On the other hand, a key headwind is increasing volatility and severity of catastrophe losses, driven by climate change, which poses a significant threat to P&C underwriting results.
Chubb's major competitors include other global insurance giants such as AIG (NYSE:AIG), Travelers (NYSE:TRV), Allianz SE (OTC:ALIZY), and Zurich Insurance Group (OTC:ZURVY). In specialty lines and high-net-worth insurance, Chubb also competes with Berkshire Hathaway's (NYSE:BRK.A, NYSE:BRK.B) insurance operations.
5. Revenue Growth
Insurance companies generate revenue three ways. The first is the core insurance business itself, represented in the income statement as premiums earned. The second source is investment income from investing the “float” (premiums collected but not yet paid out as claims) in assets such as fixed-income assets and equities. The third is fees from policy administration, annuities, and other value-added services. Over the last five years, Chubb grew its revenue at a solid 10.3% compounded annual growth rate. Its growth beat the average insurance company and shows its offerings resonate with customers, a helpful starting point for our analysis.
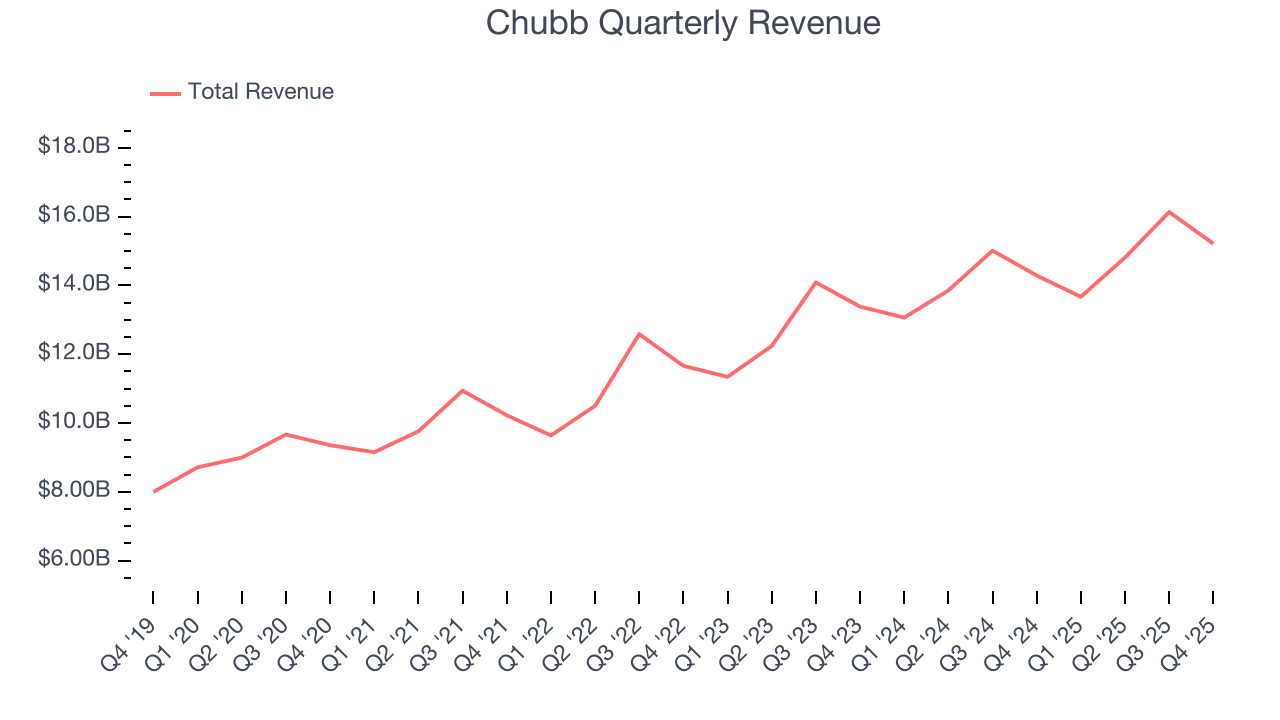
Long-term growth is the most important, but within financials, a half-decade historical view may miss recent interest rate changes and market returns. Chubb’s annualized revenue growth of 8.3% over the last two years is below its five-year trend, but we still think the results were respectable. 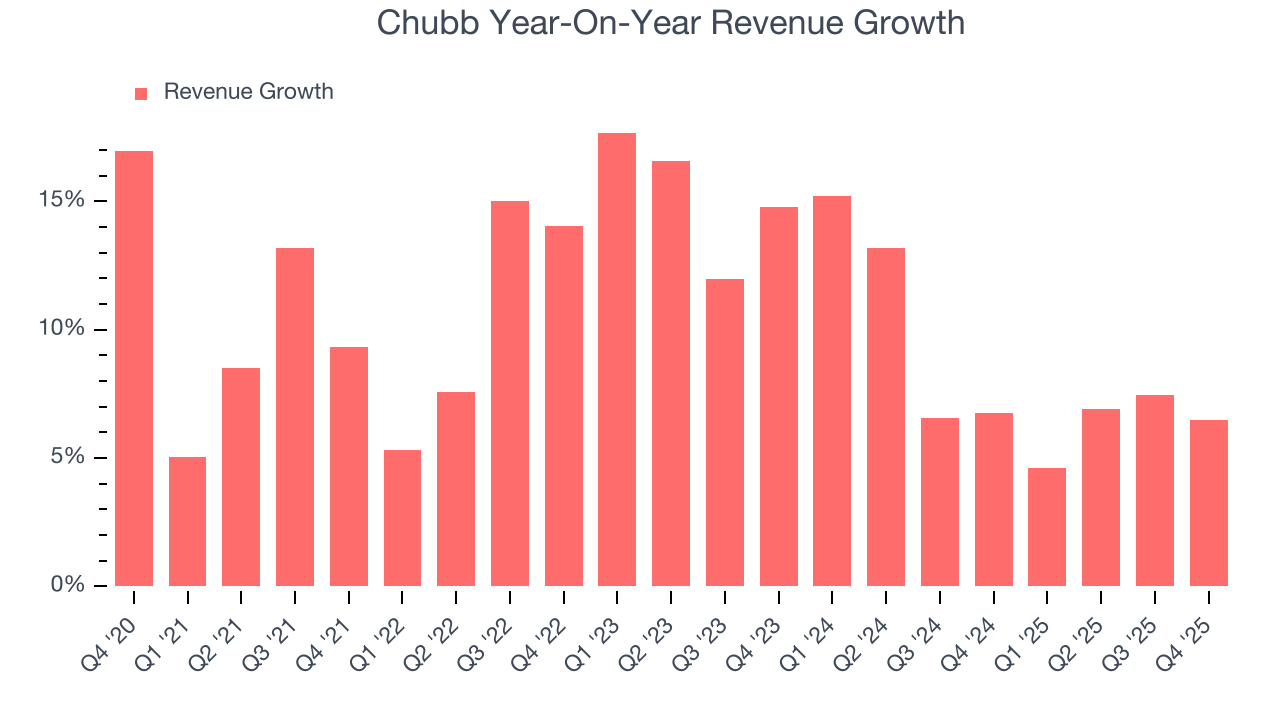
This quarter, Chubb grew its revenue by 6.5% year on year, and its $15.22 billion of revenue was in line with Wall Street’s estimates.
Net premiums earned made up 89.6% of the company’s total revenue during the last five years, meaning Chubb barely relies on non-insurance activities to drive its overall growth.
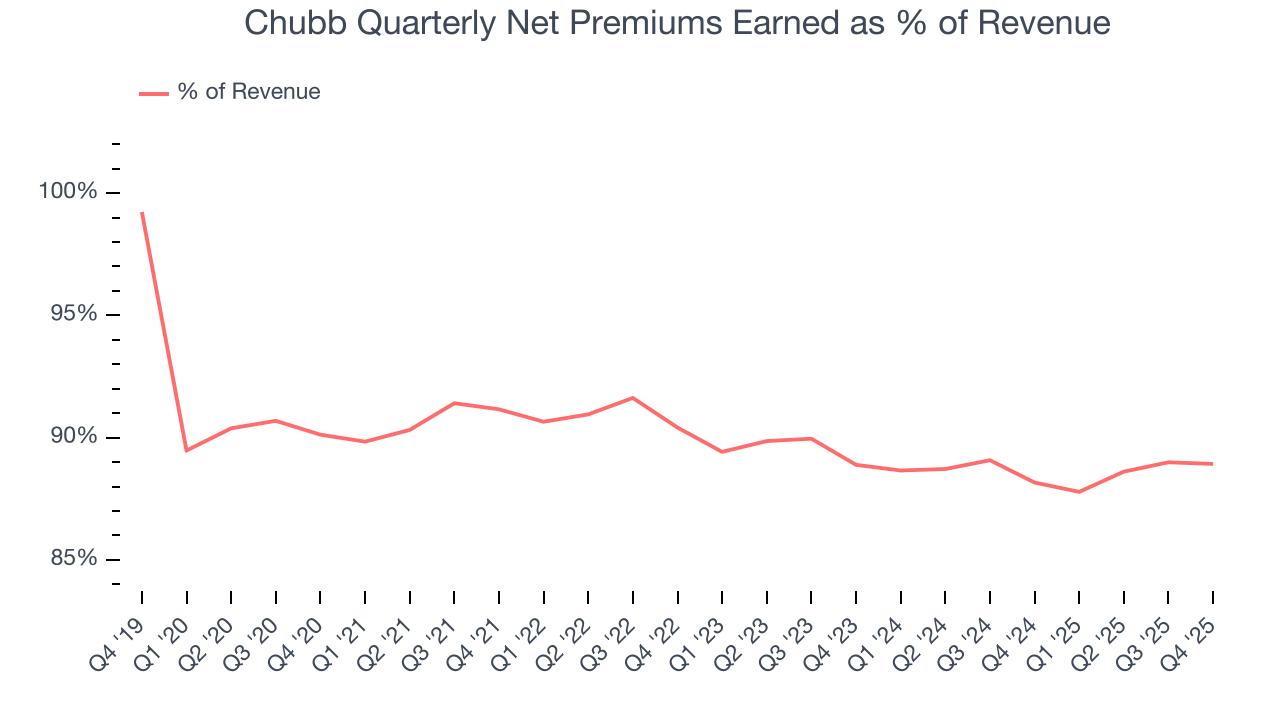
Markets consistently prioritize net premiums earned growth over investment and fee income, recognizing its superior quality as a core indicator of the company’s underwriting success and market penetration.
6. Net Premiums Earned
When insurers sell policies, they protect themselves from extremely large losses or an outsized accumulation of losses with reinsurance (insurance for insurance companies). Net premiums earned are therefore net of what’s ceded to reinsurers as a risk mitigation and transfer strategy.
Chubb’s net premiums earned has grown at a 9.9% annualized rate over the last five years, a step above the broader insurance industry and in line with its total revenue.
When analyzing Chubb’s net premiums earned over the last two years, we can see that growth decelerated to 7.7% annually. This performance was similar to its total revenue.
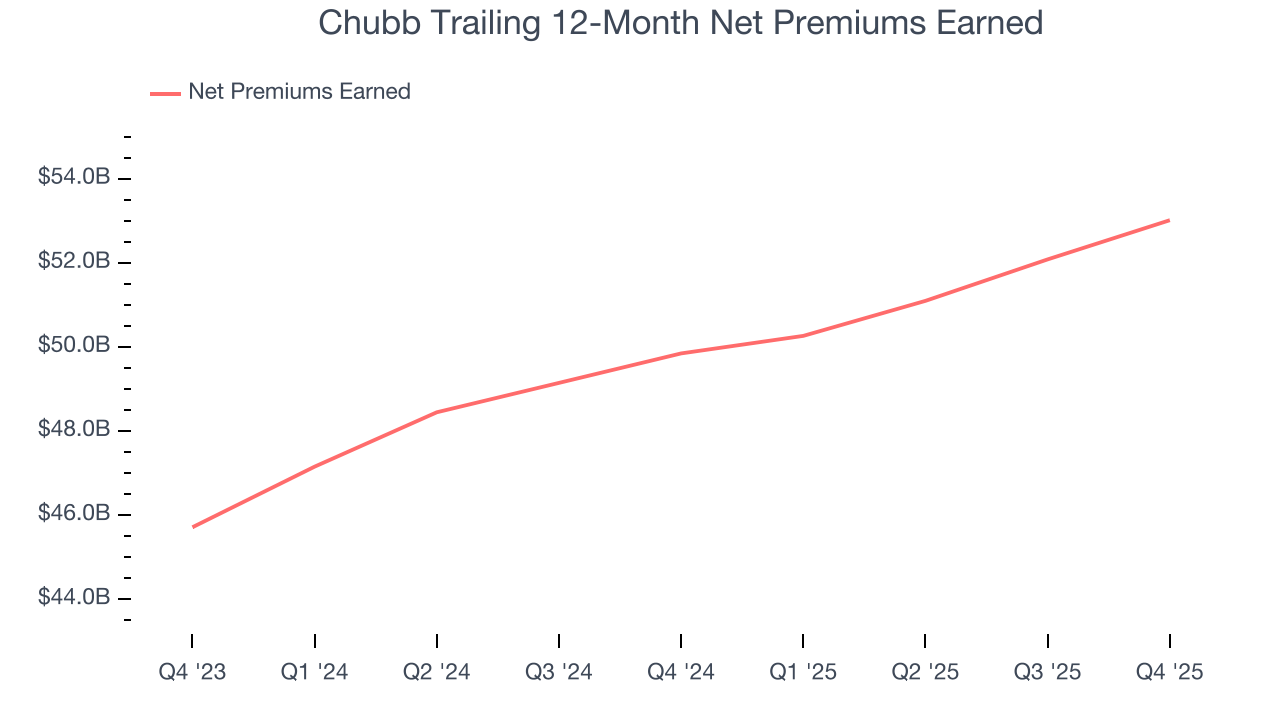
Chubb produced $13.53 billion of net premiums earned in Q4, up 7.4% year on year and in line with Wall Street Consensus estimates.
7. Combined Ratio
Revenue growth is one major determinant of business quality, and the efficiency of operations is another. For insurance companies, we look at the combined ratio rather than the operating expenses and margins that define sectors such as consumer, tech, and industrials.
The combined ratio is:
- The costs of underwriting (salaries, commissions, overhead) + what an insurer pays out in claims, all divided by net premiums earned
If a company boasts a combined ratio under 100%, it is underwriting profitably. If above 100%, it is losing money on its core operations of selling insurance policies.
Given the calculation, a lower expense ratio is better. Over the last five years, Chubb’s combined ratio has swelled by 10 percentage points, clocking in at 86.1% for the past 12 months. However, fixed cost leverage was muted more recently as the company’s combined ratio was flat on a two-year basis.
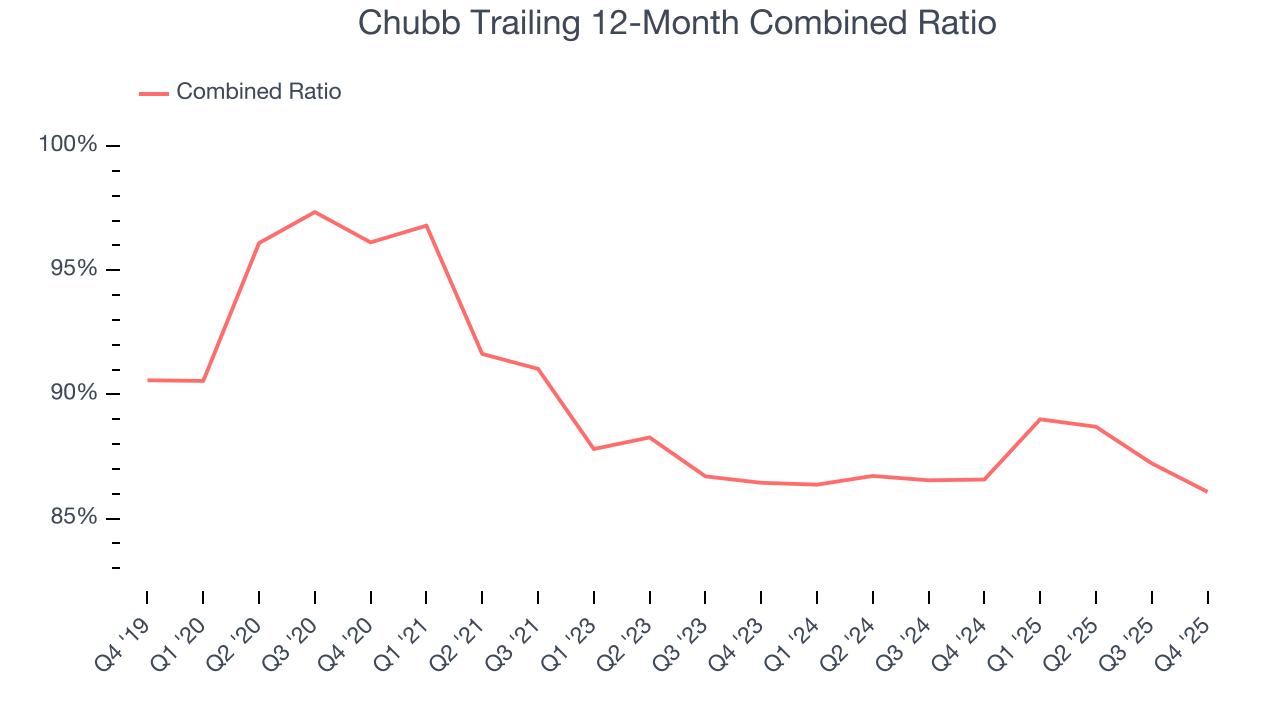
Chubb’s combined ratio came in at 81.2% this quarter, beating analysts’ expectations by 313.3 basis points (100 basis points = 1 percentage point). This result was 4.6 percentage points better than the same quarter last year.
8. Earnings Per Share
We track the long-term change in earnings per share (EPS) for the same reason as long-term revenue growth. Compared to revenue, however, EPS highlights whether a company’s growth is profitable.
Chubb’s EPS grew at an astounding 27.7% compounded annual growth rate over the last five years, higher than its 10.3% annualized revenue growth. However, this alone doesn’t tell us much about its business quality because its combined ratio didn’t improve.
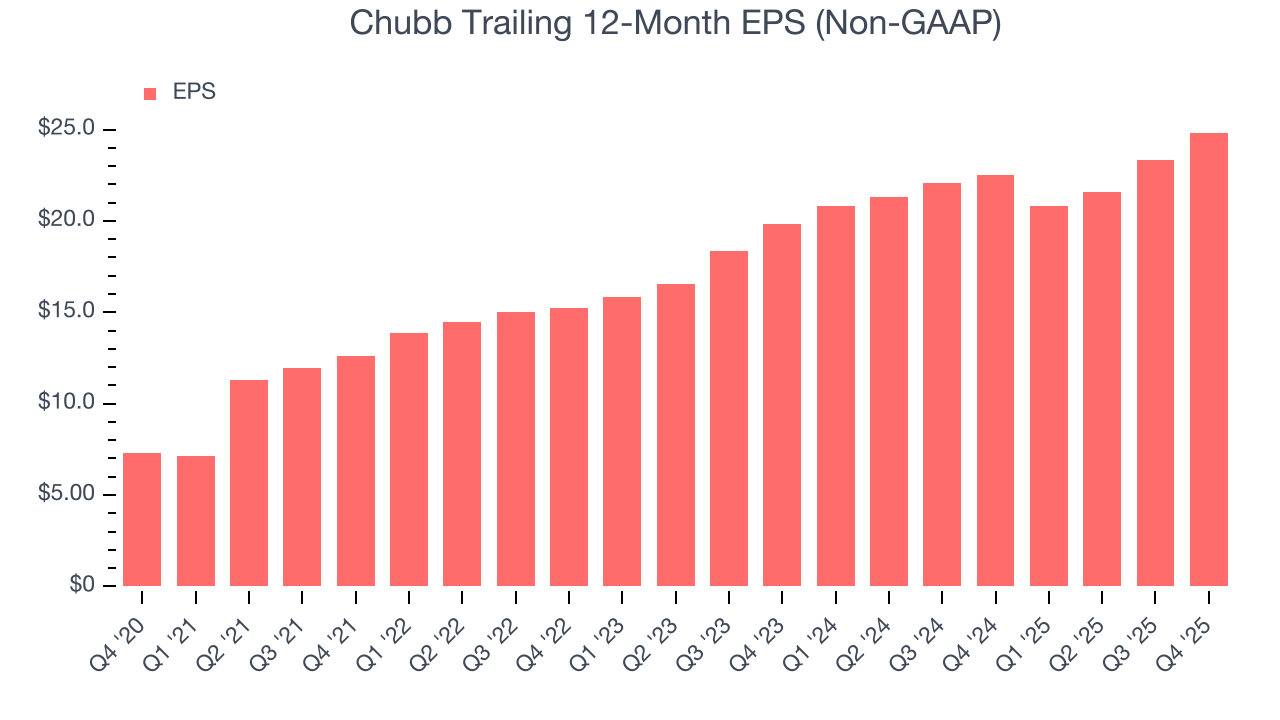
Diving into Chubb’s quality of earnings can give us a better understanding of its performance. As we mentioned earlier, Chubb’s combined ratio improved by 10 percentage points over the last five years. On top of that, its share count shrank by 12.5%. These are positive signs for shareholders because improving profitability and share buybacks turbocharge EPS growth relative to revenue growth. 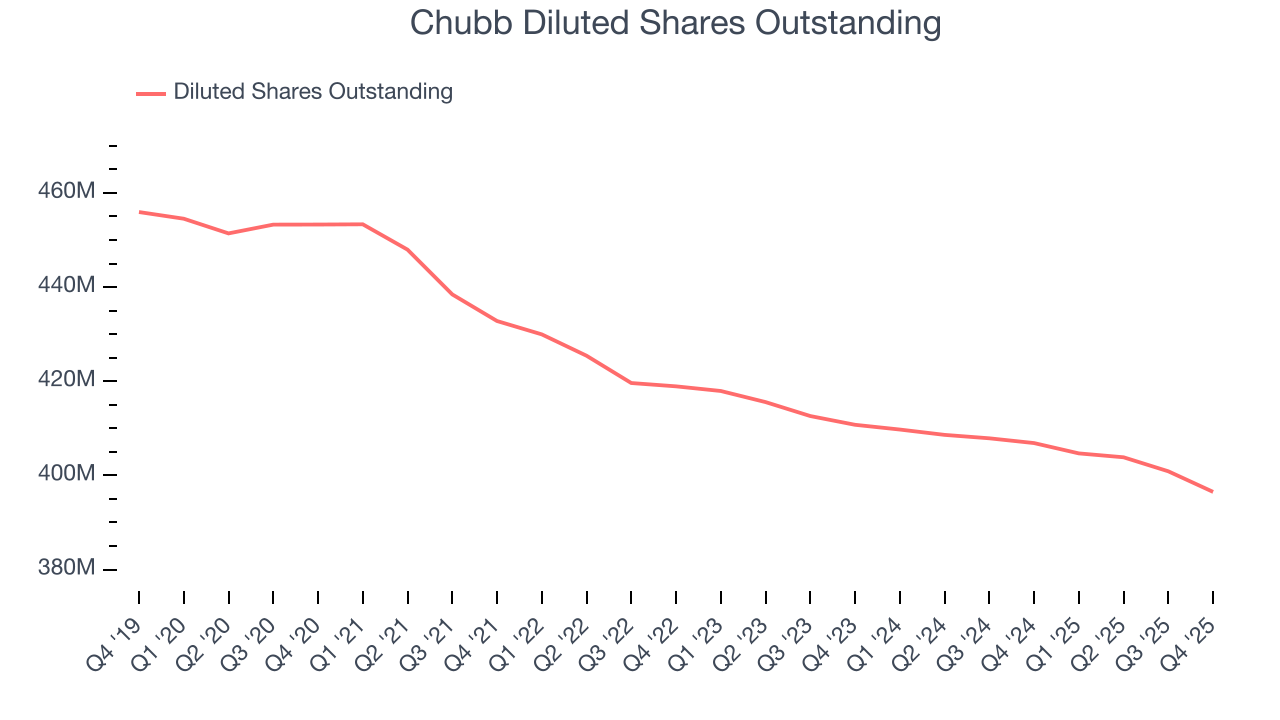
Like with revenue, we analyze EPS over a more recent period because it can provide insight into an emerging theme or development for the business.
For Chubb, its two-year annual EPS growth of 11.9% was lower than its five-year trend. This wasn’t great, but at least the company was successful in other measures of financial health.
In Q4, Chubb reported adjusted EPS of $7.52, up from $6.02 in the same quarter last year. This print easily cleared analysts’ estimates, and shareholders should be content with the results. Over the next 12 months, Wall Street expects Chubb’s full-year EPS of $24.83 to grow 5.9%.
9. Book Value Per Share (BVPS)
Insurers are balance sheet businesses, collecting premiums upfront and paying out claims over time. Premiums collected but not yet paid out, often referred to as the float, are invested and create an asset base supported by a liability structure. Book value per share (BVPS) captures this dynamic by measuring these assets (investment portfolio, cash, reinsurance recoverables) less liabilities (claim reserves, debt, future policy benefits). BVPS is essentially the residual value for shareholders.
We therefore consider BVPS very important to track for insurers and a metric that sheds light on business quality. While other (and more commonly known) per-share metrics like EPS can sometimes be lumpy due to reserve releases or one-time items and can be managed or skewed while still following accounting rules, BVPS reflects long-term capital growth and is harder to manipulate.
Chubb’s BVPS grew at a mediocre 7.4% annual clip over the last five years. However, BVPS growth has accelerated recently, growing by 13.3% annually over the last two years from $146.83 to $188.59 per share.
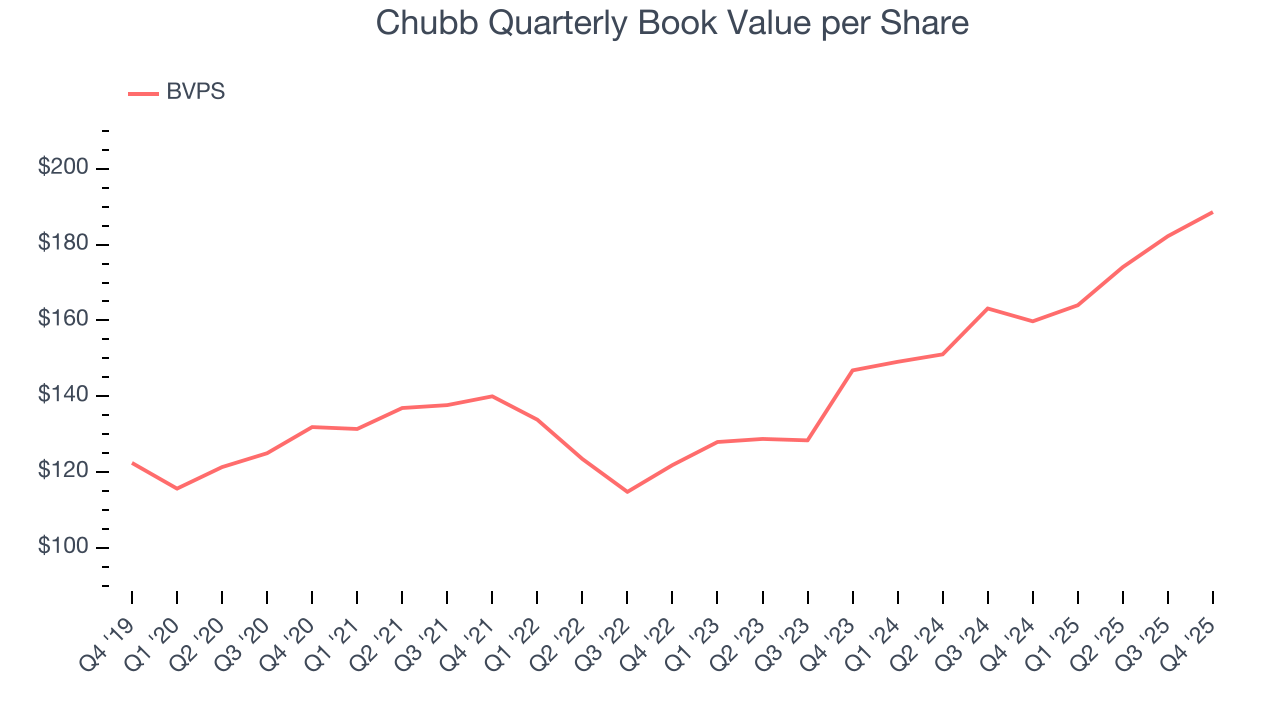
Over the next 12 months, Consensus estimates call for Chubb’s BVPS to grow by 14.1% to $200.10, top-notch growth rate.
10. Balance Sheet Assessment
The debt-to-equity ratio is a widely used measure to assess a company's balance sheet health. A higher ratio means that a business aggressively financed its growth with debt. This can result in higher earnings (if the borrowed funds are invested profitably) but also increases risk.
If debt levels are too high, there could be difficulties in meeting obligations, especially during economic downturns or periods of rising interest rates if the debt has variable-rate payments.
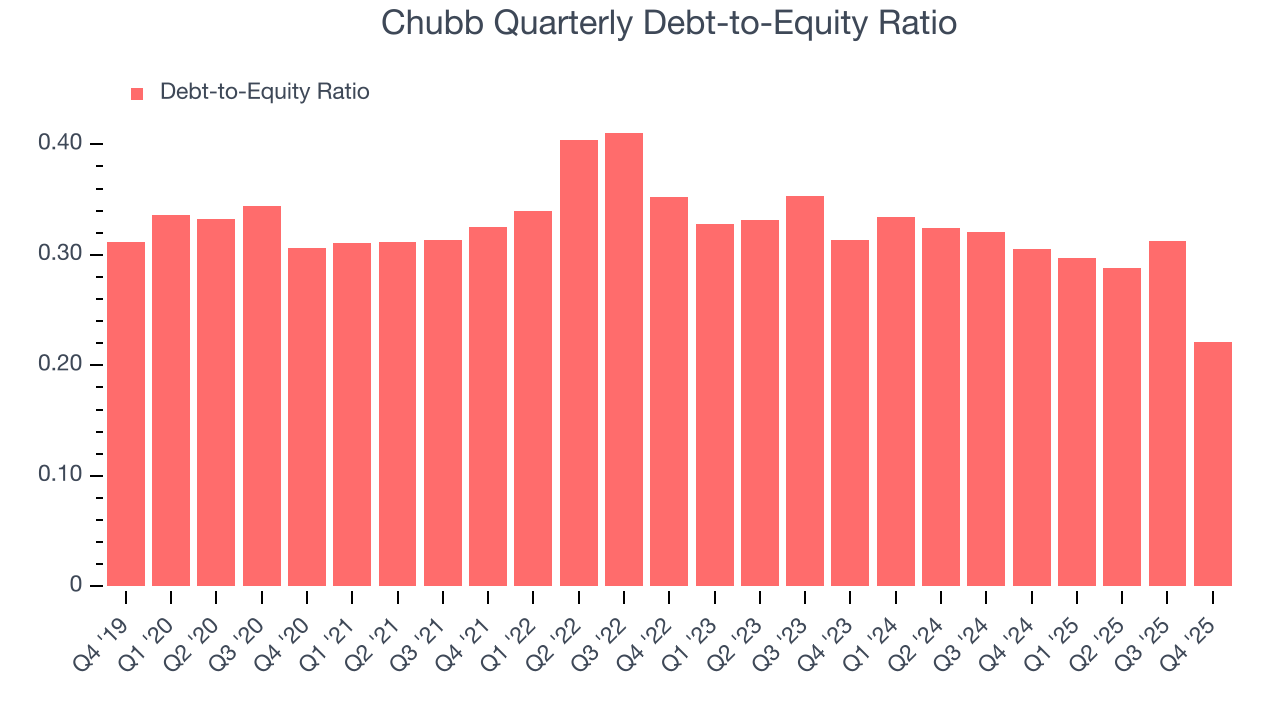
Chubb currently has $17.65 billion of debt and $79.78 billion of shareholder's equity on its balance sheet, and over the past four quarters, has averaged a debt-to-equity ratio of 0.3×. We think this is safe and raises no red flags. In general, we’re comfortable with any ratio below 1.0× for an insurance business. Anything below 0.5× is a bonus.
11. Return on Equity
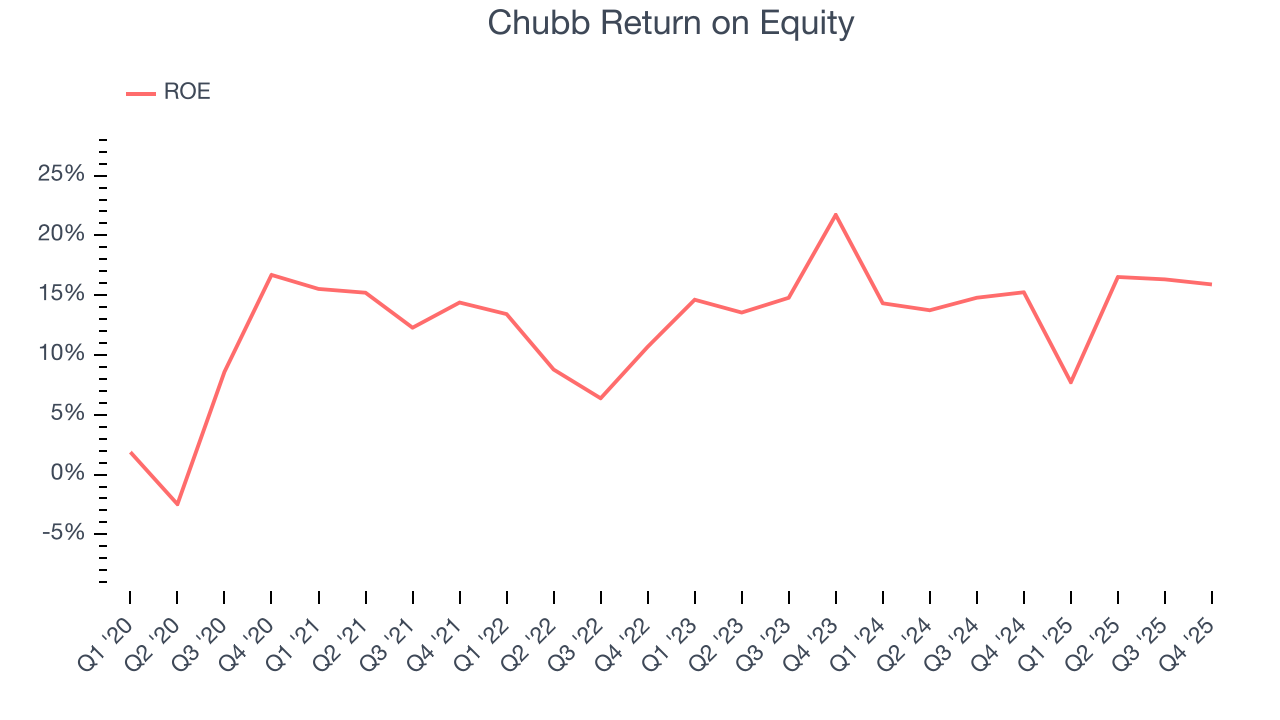
Return on equity, or ROE, represents the ultimate measure of an insurer's effectiveness, quantifying how well it transforms shareholder investments into profits. Over the long term, insurance companies with robust ROE metrics typically deliver superior shareholder returns through a balanced approach to capital management.
Over the last five years, Chubb has averaged an ROE of 13.8%, respectable for a company operating in a sector where the average shakes out around 12.5% and those putting up 20%+ are greatly admired. This shows Chubb has a narrow competitive moat.
12. Key Takeaways from Chubb’s Q4 Results
It was good to see Chubb beat analysts’ EPS expectations this quarter. On the other hand, its book value per share missed and its net premiums earned was in line with Wall Street’s estimates. Overall, this was a mixed quarter. The stock remained flat at $313.50 immediately after reporting.
13. Is Now The Time To Buy Chubb?
Updated: March 26, 2026 at 1:06 AM EDT
The latest quarterly earnings matters, sure, but we actually think longer-term fundamentals and valuation matter more. Investors should consider all these pieces before deciding whether or not to invest in Chubb.
Chubb doesn’t top our investment wishlist, but we understand that it’s not a bad business. To kick things off, its revenue growth was solid over the last five years. And while Chubb’s projected EPS for the next year is lacking, its expanding pre-tax profit margin shows the business has become more efficient.
Chubb’s P/B ratio based on the next 12 months is 1.5x. Investors with a higher risk tolerance might like the company, but we don’t really see a big opportunity at the moment. We're pretty confident there are superior stocks to buy right now.
Wall Street analysts have a consensus one-year price target of $338.83 on the company (compared to the current share price of $322.88).