
Crown Holdings (CCK)
We’re wary of Crown Holdings. Its underwhelming revenue growth and failure to generate meaningful free cash flow is a concerning trend.― StockStory Analyst Team
1. News


2. Summary
Why We Think Crown Holdings Will Underperform
Formerly Crown Cork & Seal, Crown Holdings (NYSE:CCK) produces packaging products for consumer marketing companies, including food, beverage, household, and industrial products.
- The company has faced growth challenges as its 1.3% annual revenue increases over the last five years fell short of other industrials companies
- Gross margin of 21.1% is below its competitors, leaving less money to invest in areas like marketing and R&D
- A bright spot is that its market-beating returns on capital illustrate that management has a knack for investing in profitable ventures, and its returns are growing as it capitalizes on even better market opportunities


Crown Holdings’s quality isn’t up to par. There’s a wealth of better opportunities.
Why There Are Better Opportunities Than Crown Holdings


Crown Holdings is trading at $99.48 per share, or 12.5x forward P/E. This multiple is lower than most industrials companies, but for good reason.
Our advice is to pay up for elite businesses whose advantages are tailwinds to earnings growth. Don’t get sucked into lower-quality businesses just because they seem like bargains. These mediocre businesses often never achieve a higher multiple as hoped, a phenomenon known as a “value trap”.
3. Crown Holdings (CCK) Research Report: Q4 CY2025 Update
Metal packaging products manufacturer Crown Holdings (NYSE:CCK) announced better-than-expected revenue in Q4 CY2025, with sales up 7.7% year on year to $3.13 billion. Its non-GAAP profit of $1.74 per share was 2.2% above analysts’ consensus estimates.
Crown Holdings (CCK) Q4 CY2025 Highlights:
- Revenue: $3.13 billion vs analyst estimates of $3.02 billion (7.7% year-on-year growth, 3.6% beat)
- Adjusted EPS: $1.74 vs analyst estimates of $1.70 (2.2% beat)
- Adjusted EBITDA: $501 million vs analyst estimates of $493.9 million (16% margin, 1.4% beat)
- Adjusted EPS guidance for the upcoming financial year 2026 is $8.10 at the midpoint, missing analyst estimates by 1.4%
- Operating Margin: 12%, in line with the same quarter last year
- Free Cash Flow Margin: 8.2%, up from 5% in the same quarter last year
- Market Capitalization: $12.72 billion
Company Overview
Formerly Crown Cork & Seal, Crown Holdings (NYSE:CCK) produces packaging products for consumer marketing companies, including food, beverage, household, and industrial products.
Founded in 1892 and headquartered in Yardley, Pennsylvania, Crown operates through four primary reportable segments: Americas Beverage, European Beverage, Asia Pacific, and Transit Packaging.
The Americas Beverage segment produces aluminum beverage cans and ends, glass bottles, steel crowns, and aluminum caps in manufacturing facilities across the United States, Brazil, Canada, Colombia, and Mexico. The European Beverage segment focuses on manufacturing aluminum beverage cans and ends in Europe, the Middle East, and North Africa.
The Asia Pacific segment primarily operates beverage can facilities in Cambodia, China, Indonesia, Malaysia, Myanmar, Thailand, and Vietnam. The Transit Packaging segment offers products including automation and equipment technologies, protective packaging solutions, and steel and plastic consumables.
4. Industrial Packaging
Industrial packaging companies have built competitive advantages from economies of scale that lead to advantaged purchasing and capital investments that are difficult and expensive to replicate. Recently, eco-friendly packaging and conservation are driving customers preferences and innovation. For example, plastic is not as desirable a material as it once was. Despite being integral to consumer goods ranging from beer to toothpaste to laundry detergent, these companies are still at the whim of the macro, especially consumer health and consumer willingness to spend.
Competitors in the packaging industry include Ball Corporation (NYSE:BLL), Ardagh Group (NYSE:ARD), and Silgan Holdings (NASDAQ:SLGN)
5. Revenue Growth
A company’s long-term sales performance is one signal of its overall quality. Any business can put up a good quarter or two, but the best consistently grow over the long haul. Regrettably, Crown Holdings’s sales grew at a weak 1.3% compounded annual growth rate over the last five years. This fell short of our benchmarks and is a poor baseline for our analysis.
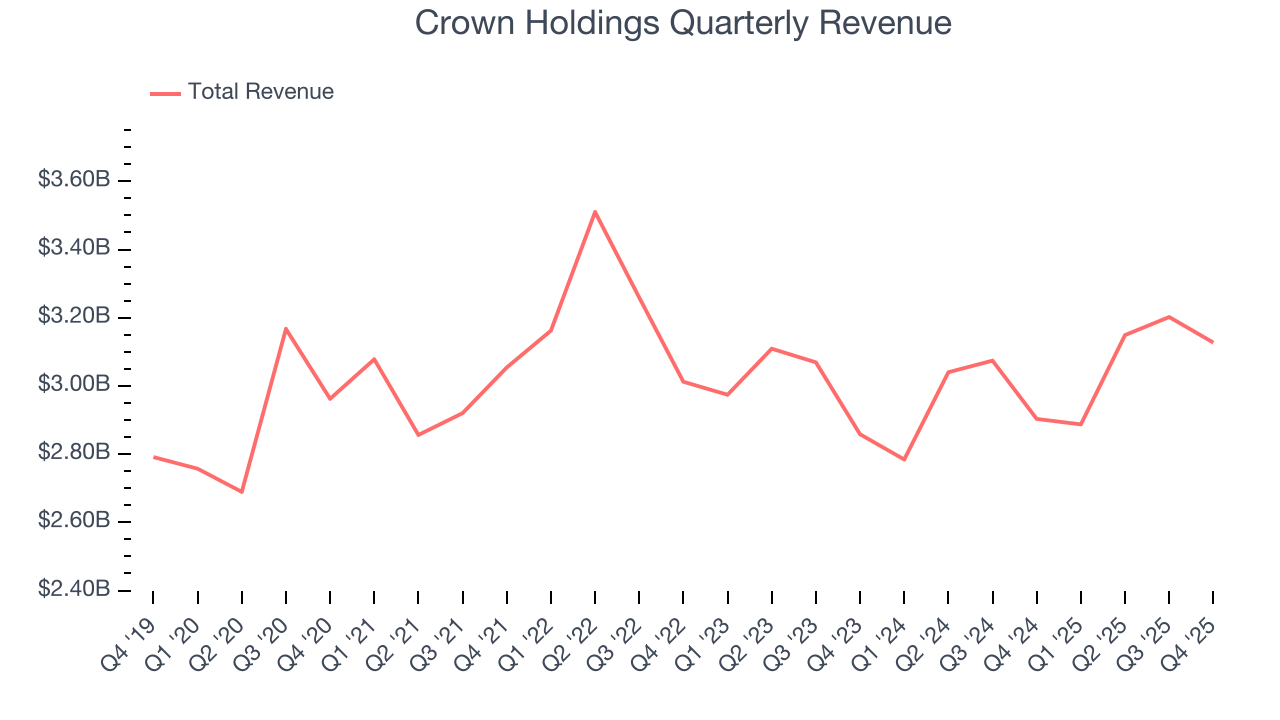
We at StockStory place the most emphasis on long-term growth, but within industrials, a half-decade historical view may miss cycles, industry trends, or a company capitalizing on catalysts such as a new contract win or a successful product line. Crown Holdings’s annualized revenue growth of 1.5% over the last two years aligns with its five-year trend, suggesting its demand was consistently weak. 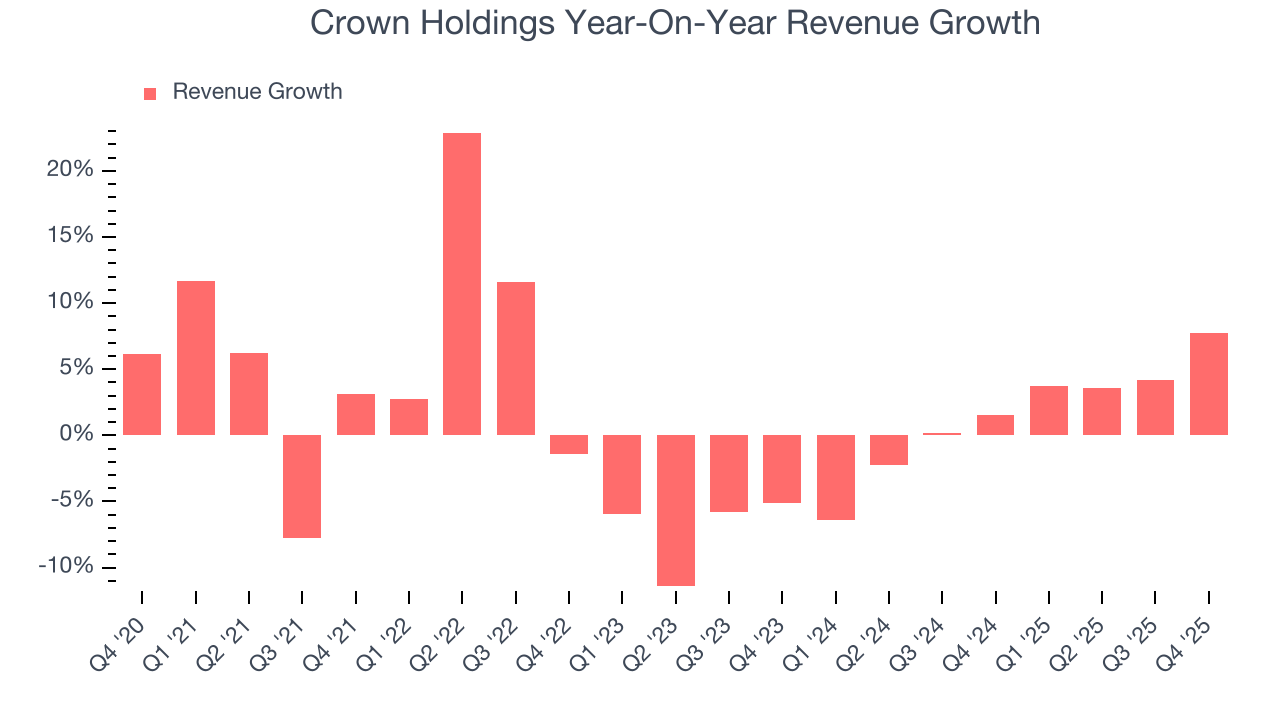
This quarter, Crown Holdings reported year-on-year revenue growth of 7.7%, and its $3.13 billion of revenue exceeded Wall Street’s estimates by 3.6%.
Looking ahead, sell-side analysts expect revenue to grow 2.1% over the next 12 months, similar to its two-year rate. This projection is underwhelming and suggests its newer products and services will not lead to better top-line performance yet.
6. Gross Margin & Pricing Power
Cost of sales for an industrials business is usually comprised of the direct labor, raw materials, and supplies needed to offer a product or service. These costs can be impacted by inflation and supply chain dynamics.
Crown Holdings has bad unit economics for an industrials business, signaling it operates in a competitive market. As you can see below, it averaged a 20.5% gross margin over the last five years. That means Crown Holdings paid its suppliers a lot of money ($79.54 for every $100 in revenue) to run its business. 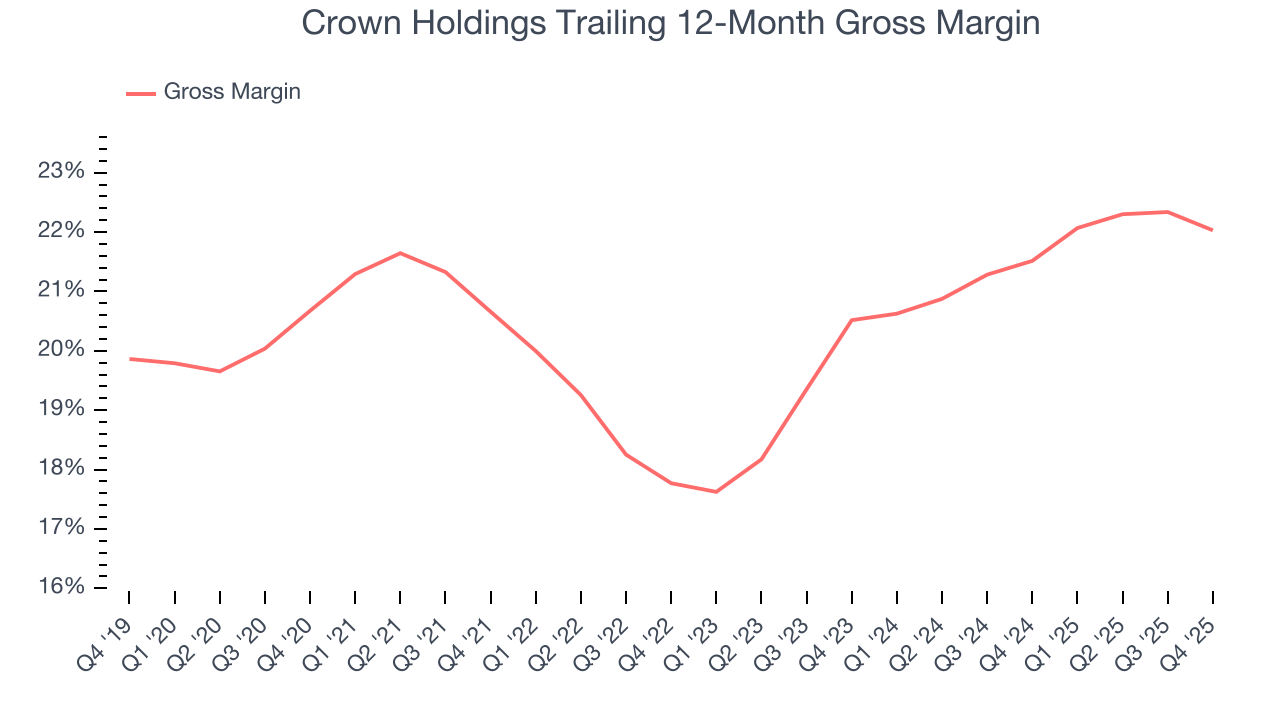
Crown Holdings’s gross profit margin came in at 21.2% this quarter, marking a 1.2 percentage point decrease from 22.4% in the same quarter last year. Zooming out, the company’s full-year margin has remained steady over the past 12 months, suggesting its input costs (such as raw materials and manufacturing expenses) have been stable and it isn’t under pressure to lower prices.
7. Operating Margin
Crown Holdings’s operating margin might fluctuated slightly over the last 12 months but has generally stayed the same, averaging 11.5% over the last five years. This profitability was solid for an industrials business and shows it’s an efficient company that manages its expenses well. This result was particularly impressive because of its low gross margin, which is mostly a factor of what it sells and takes huge shifts to move meaningfully. Companies have more control over their operating margins, and it’s a show of well-managed operations if they’re high when gross margins are low.
Looking at the trend in its profitability, Crown Holdings’s operating margin might fluctuated slightly but has generally stayed the same over the last five years. We like to see margin expansion, but we’re still happy with Crown Holdings’s performance considering most Industrial Packaging companies saw their margins plummet.
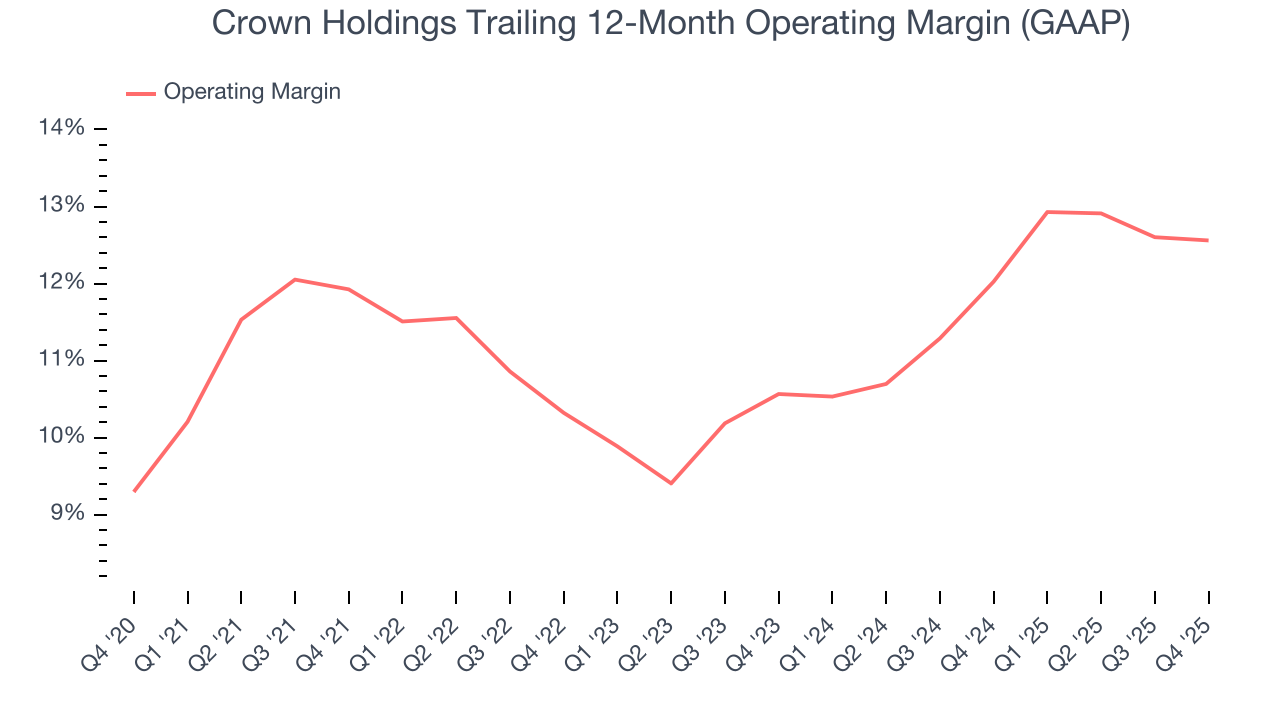
This quarter, Crown Holdings generated an operating margin profit margin of 12%, in line with the same quarter last year. This indicates the company’s cost structure has recently been stable.
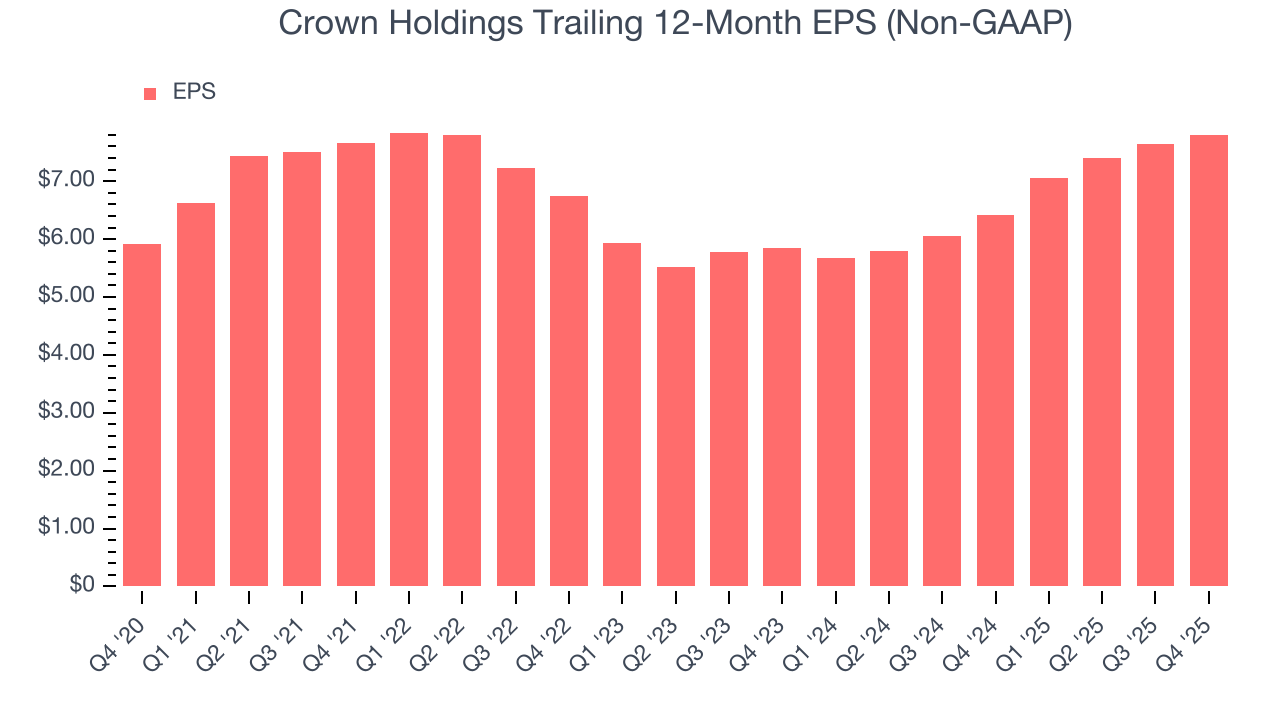
8. Earnings Per Share
Revenue trends explain a company’s historical growth, but the long-term change in earnings per share (EPS) points to the profitability of that growth – for example, a company could inflate its sales through excessive spending on advertising and promotions.
Crown Holdings’s EPS grew at an unimpressive 5.7% compounded annual growth rate over the last five years. On the bright side, this performance was better than its 1.3% annualized revenue growth and tells us the company became more profitable on a per-share basis as it expanded.
We can take a deeper look into Crown Holdings’s earnings to better understand the drivers of its performance. A five-year view shows that Crown Holdings has repurchased its stock, shrinking its share count by 15.2%. This tells us its EPS outperformed its revenue not because of increased operational efficiency but financial engineering, as buybacks boost per share earnings. 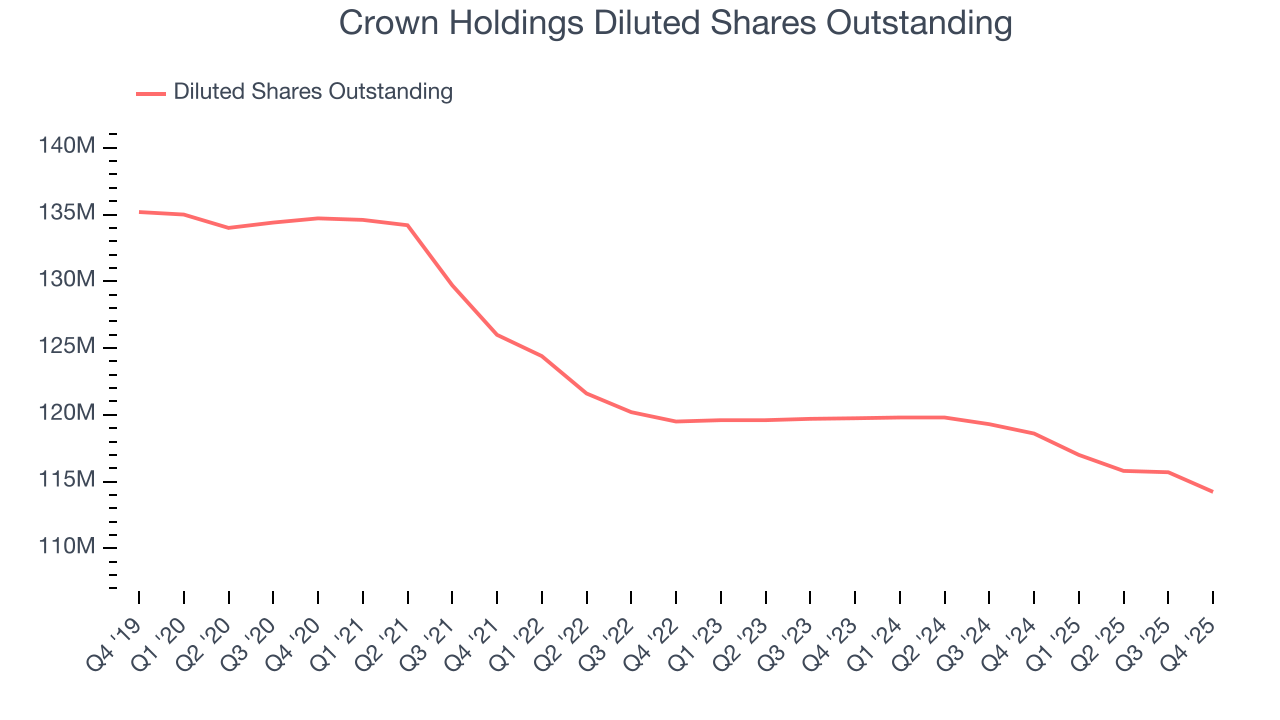
Like with revenue, we analyze EPS over a more recent period because it can provide insight into an emerging theme or development for the business.
For Crown Holdings, its two-year annual EPS growth of 15.5% was higher than its five-year trend. This acceleration made it one of the faster-growing industrials companies in recent history.
In Q4, Crown Holdings reported adjusted EPS of $1.74, up from $1.59 in the same quarter last year. This print beat analysts’ estimates by 2.2%. Over the next 12 months, Wall Street expects Crown Holdings’s full-year EPS of $7.80 to grow 5.4%.
9. Cash Is King
Although earnings are undoubtedly valuable for assessing company performance, we believe cash is king because you can’t use accounting profits to pay the bills.
Crown Holdings has shown weak cash profitability over the last five years, giving the company limited opportunities to return capital to shareholders. Its free cash flow margin averaged 4.7%, subpar for an industrials business. The divergence from its good operating margin stems from its capital-intensive business model, which requires Crown Holdings to make large cash investments in working capital and capital expenditures.
Taking a step back, an encouraging sign is that Crown Holdings’s margin expanded by 6.2 percentage points during that time. The company’s improvement shows it’s heading in the right direction, and we can see it became a less capital-intensive business because its free cash flow profitability rose while its operating profitability was flat.
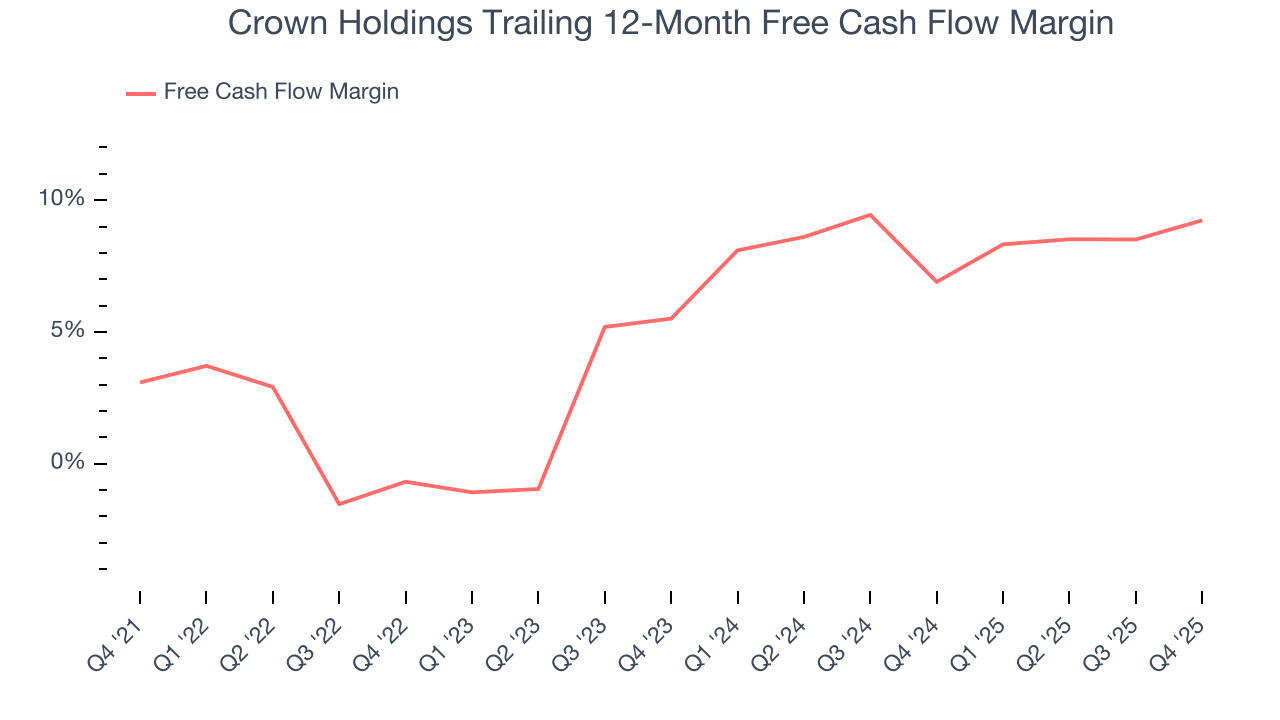
Crown Holdings’s free cash flow clocked in at $255 million in Q4, equivalent to a 8.2% margin. This result was good as its margin was 3.1 percentage points higher than in the same quarter last year, building on its favorable historical trend.
10. Return on Invested Capital (ROIC)
EPS and free cash flow tell us whether a company was profitable while growing its revenue. But was it capital-efficient? A company’s ROIC explains this by showing how much operating profit it makes compared to the money it has raised (debt and equity).
Although Crown Holdings hasn’t been the highest-quality company lately because of its poor top-line performance, it historically found a few growth initiatives that worked. Its five-year average ROIC was 13.9%, higher than most industrials businesses.
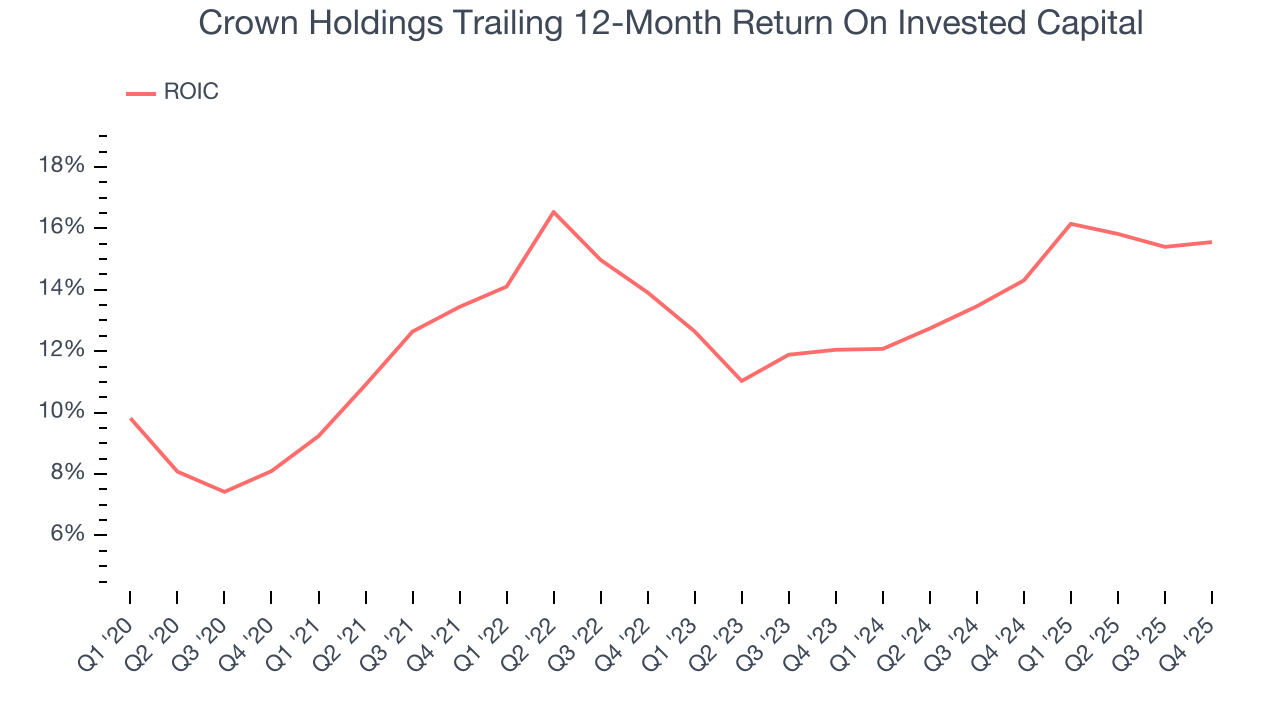
We like to invest in businesses with high returns, but the trend in a company’s ROIC is what often surprises the market and moves the stock price. Over the last few years, Crown Holdings’s ROIC averaged 1.3 percentage point increases each year. This is a good sign, and we hope the company can keep improving.
11. Balance Sheet Assessment
Crown Holdings reported $764 million of cash and $5.96 billion of debt on its balance sheet in the most recent quarter. As investors in high-quality companies, we primarily focus on two things: 1) that a company’s debt level isn’t too high and 2) that its interest payments are not excessively burdening the business.
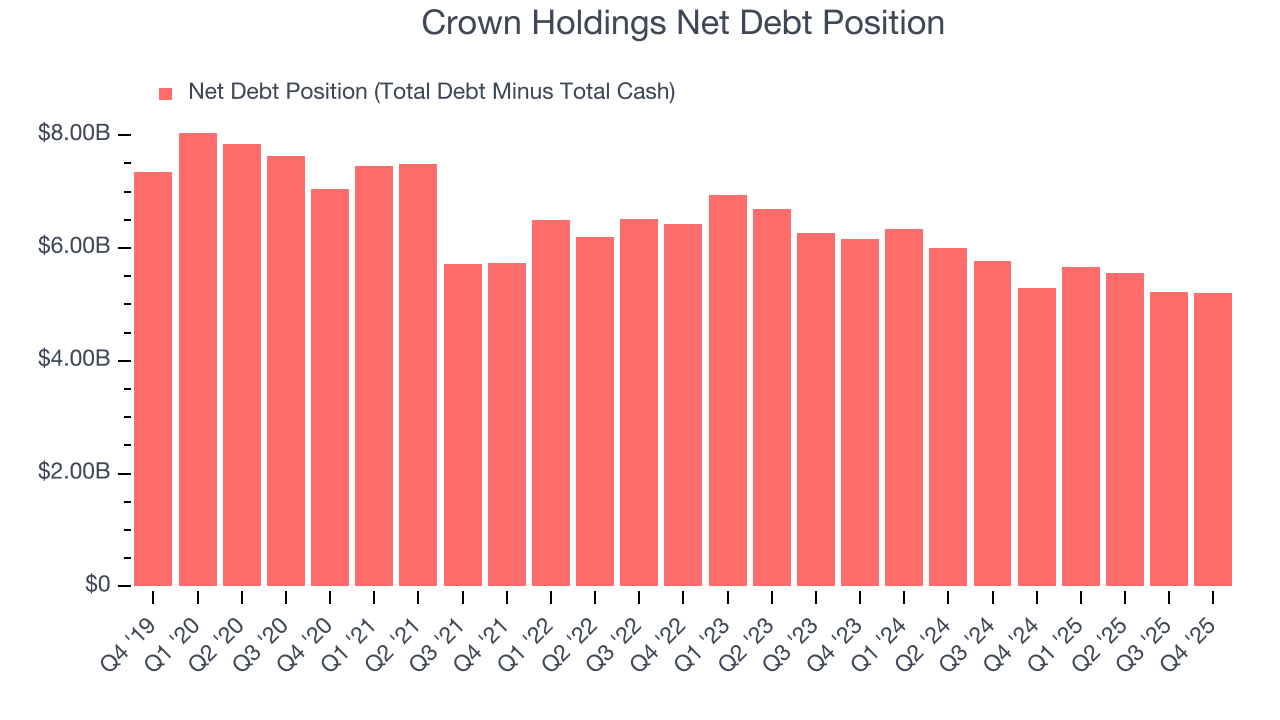
With $2.10 billion of EBITDA over the last 12 months, we view Crown Holdings’s 2.5× net-debt-to-EBITDA ratio as safe. We also see its $183 million of annual interest expenses as appropriate. The company’s profits give it plenty of breathing room, allowing it to continue investing in growth initiatives.
12. Key Takeaways from Crown Holdings’s Q4 Results
We were impressed by how significantly Crown Holdings blew past analysts’ revenue expectations this quarter. We were also glad its EPS guidance for next quarter exceeded Wall Street’s estimates. On the other hand, its full-year EPS guidance slightly missed. Overall, this print had some key positives. Investors were likely hoping for more, and shares traded down 1.7% to $113.23 immediately following the results.
13. Is Now The Time To Buy Crown Holdings?
Updated: March 29, 2026 at 11:54 PM EDT
The latest quarterly earnings matters, sure, but we actually think longer-term fundamentals and valuation matter more. Investors should consider all these pieces before deciding whether or not to invest in Crown Holdings.
Crown Holdings isn’t a terrible business, but it isn’t one of our picks. To kick things off, its revenue growth was weak over the last five years. While its rising cash profitability gives it more optionality, the downside is its low gross margins indicate some combination of competitive pressures and high production costs. On top of that, its projected EPS for the next year is lacking.
Crown Holdings’s P/E ratio based on the next 12 months is 12.5x. This valuation multiple is fair, but we don’t have much faith in the company. We're fairly confident there are better investments elsewhere.
Wall Street analysts have a consensus one-year price target of $128.58 on the company (compared to the current share price of $99.48).
Although the price target is bullish, readers should exercise caution because analysts tend to be overly optimistic. The firms they work for, often big banks, have relationships with companies that extend into fundraising, M&A advisory, and other rewarding business lines. As a result, they typically hesitate to say bad things for fear they will lose out. We at StockStory do not suffer from such conflicts of interest, so we’ll always tell it like it is.