
Comerica (CMA)
Comerica keeps us up at night. Its revenue growth has been weak and its profitability has caved, showing it’s struggling to adapt.― StockStory Analyst Team
1. News


2. Summary
Why We Think Comerica Will Underperform
Founded in 1849 during the California Gold Rush era, Comerica (NYSE:CMA) is a financial services company that provides commercial banking, retail banking, and wealth management services to businesses and individuals.
- Annual sales declines of 4.9% for the past two years show its products and services struggled to connect with the market during this cycle
- Earnings per share decreased by more than its revenue over the last two years, showing each sale was less profitable
- Tangible book value per share is projected to decrease by 2.9% over the next 12 months as capital generation weakens


Comerica doesn’t measure up to our expectations. There are more rewarding stocks elsewhere.
Why There Are Better Opportunities Than Comerica


Comerica is trading at $90.95 per share, or 1.6x forward P/B. Not only does Comerica trade at a premium to companies in the banking space, but this multiple is also high for its top-line growth.
We’d rather invest in similarly-priced but higher-quality companies with more reliable earnings growth.
3. Comerica (CMA) Research Report: Q4 CY2025 Update
Financial services company Comerica (NYSE:CMA) reported revenue ahead of Wall Streets expectations in Q4 CY2025, with sales up 3.3% year on year to $850 million. Its non-GAAP profit of $1.46 per share was 17% above analysts’ consensus estimates.
Comerica (CMA) Q4 CY2025 Highlights:
- Net Interest Income: $577 million vs analyst estimates of $573.9 million (flat year on year, 0.5% beat)
- Net Interest Margin: 3.1% vs analyst estimates of 3.2% (8.7 basis point miss)
- Revenue: $850 million vs analyst estimates of $843.6 million (3.3% year-on-year growth, 0.8% beat)
- Efficiency Ratio: 72.3% vs analyst estimates of 70.4% (193.3 basis point miss)
- Adjusted EPS: $1.46 vs analyst estimates of $1.25 (17% beat)
- Tangible Book Value per Share: $52.16 vs analyst estimates of $51.96 (27.6% year-on-year growth, in line)
- Market Capitalization: $11.71 billion
Company Overview
Founded in 1849 during the California Gold Rush era, Comerica (NYSE:CMA) is a financial services company that provides commercial banking, retail banking, and wealth management services to businesses and individuals.
Comerica operates through three primary business segments: Commercial Bank, Retail Bank, and Wealth Management. The Commercial Bank serves small and middle market businesses, multinational corporations, and government entities with products including commercial loans, lines of credit, deposits, cash management solutions, and international trade finance. For example, a mid-sized manufacturing company might use Comerica's commercial banking services to finance equipment purchases, manage cash flow, and handle international payments to suppliers.
The Retail Bank offers personal financial services such as deposit accounts, consumer loans, credit cards, home equity lines of credit, and residential mortgages. It also provides specialized services to small businesses through dedicated bankers and its branch network. The Wealth Management segment caters to affluent and high-net-worth individuals, business owners, and institutional clients with comprehensive financial planning, trust services, investment management, private banking, and business transition planning.
Comerica maintains a significant presence in five primary geographic markets—Texas, California, Michigan, Arizona, and Florida—while also serving customers in several other states and maintaining operations in Canada and Mexico. The bank's commercial real estate portfolio includes loans to developers, investors, and owner-occupied properties.
As a financial institution, Comerica is subject to extensive regulation by various federal and state agencies, including the Federal Reserve Board, the FDIC, and state banking departments. The bank generates revenue primarily through interest income on loans and investments, as well as through fees for banking services and wealth management.
4. Regional Banks
Regional banks, financial institutions operating within specific geographic areas, serve as intermediaries between local depositors and borrowers. They benefit from rising interest rates that improve net interest margins (the difference between loan yields and deposit costs), digital transformation reducing operational expenses, and local economic growth driving loan demand. However, these banks face headwinds from fintech competition, deposit outflows to higher-yielding alternatives, credit deterioration (increasing loan defaults) during economic slowdowns, and regulatory compliance costs. Recent concerns about regional bank stability following high-profile failures and significant commercial real estate exposure present additional challenges.
Comerica's competitors include regional banks such as Fifth Third Bancorp (NASDAQ:FITB), KeyCorp (NYSE:KEY), and Huntington Bancshares (NASDAQ:HBAN), as well as larger national institutions like JPMorgan Chase (NYSE:JPM), Bank of America (NYSE:BAC), and Wells Fargo (NYSE:WFC).
5. Sales Growth
Two primary revenue streams drive bank earnings. While net interest income, which is earned by charging higher rates on loans than paid on deposits, forms the foundation, fee-based services across banking, credit, wealth management, and trading operations provide additional income. Over the last five years, Comerica grew its revenue at a sluggish 2.7% compounded annual growth rate. This was below our standards and is a tough starting point for our analysis.
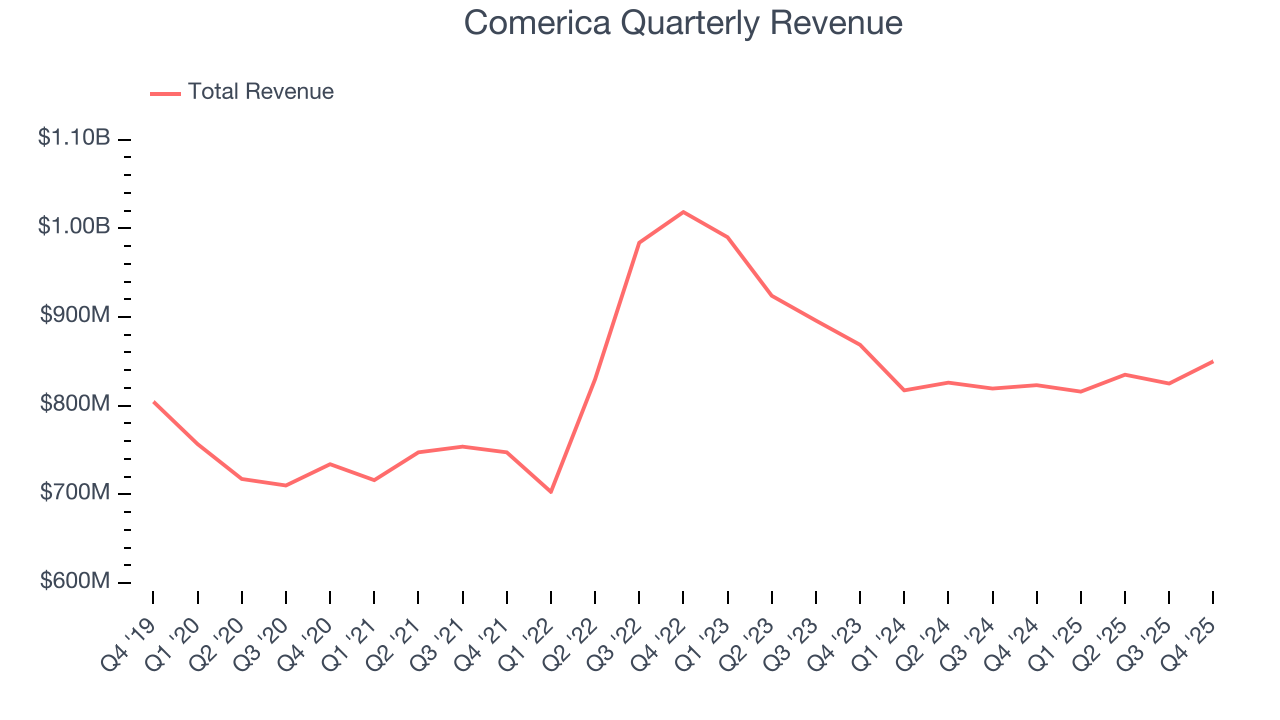
Long-term growth is the most important, but within financials, a half-decade historical view may miss recent interest rate changes and market returns. Comerica’s performance shows it grew in the past but relinquished its gains over the last two years, as its revenue fell by 4.9% annually. 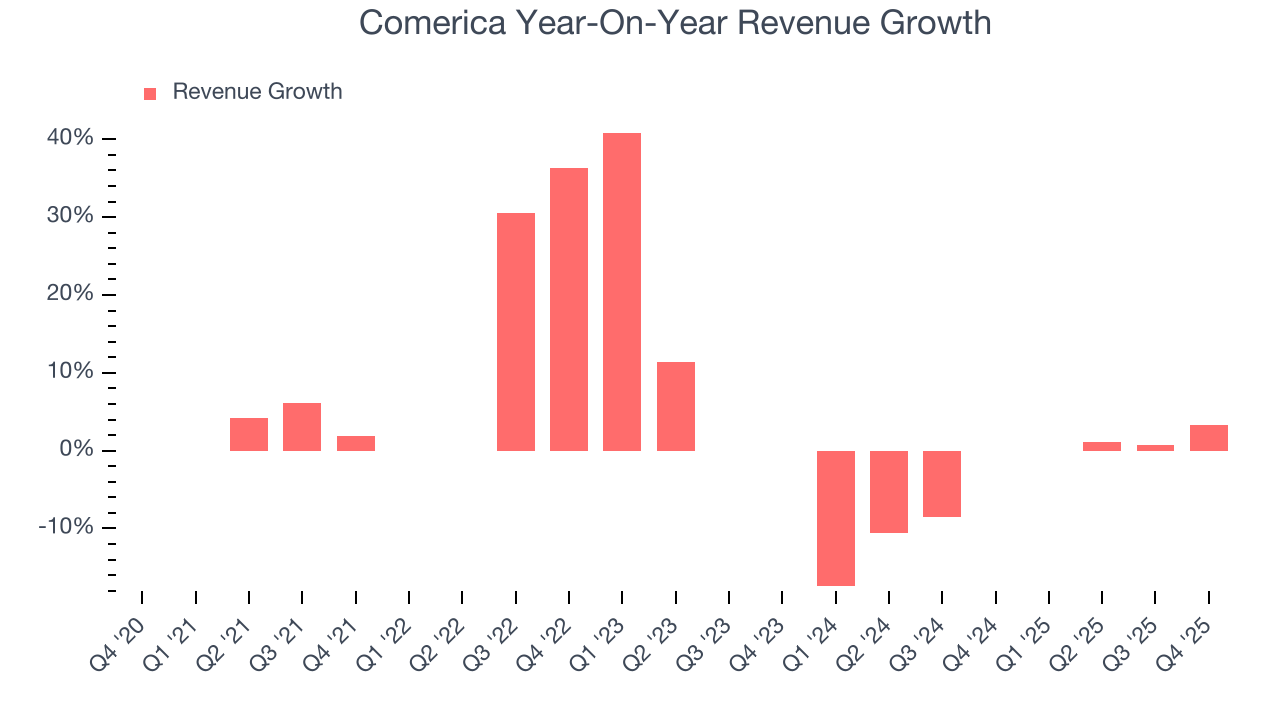 Note: Quarters not shown were determined to be outliers, impacted by outsized investment gains/losses that are not indicative of the recurring fundamentals of the business.
This quarter, Comerica reported modest year-on-year revenue growth of 3.3% but beat Wall Street’s estimates by 0.8%.
Net interest income made up 67.1% of the company’s total revenue during the last five years, meaning lending operations are Comerica’s largest source of revenue.
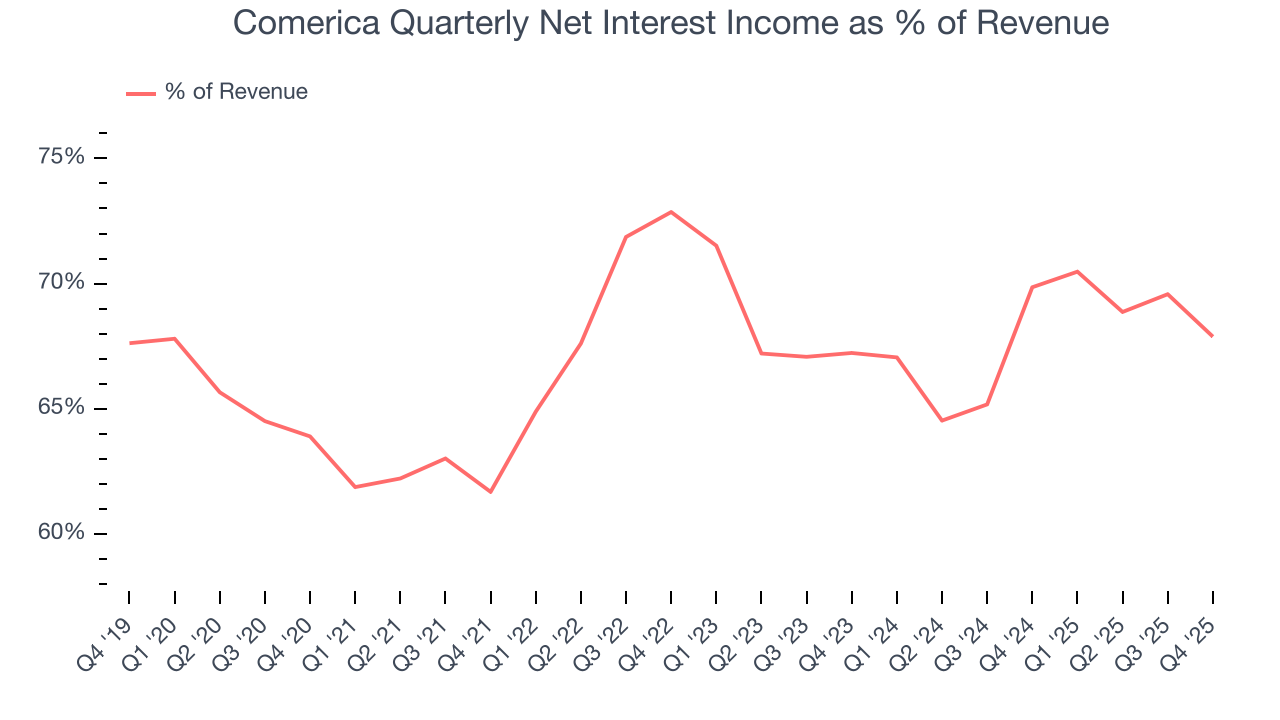
While banks generate revenue from multiple sources, investors view net interest income as the cornerstone - its predictable, recurring characteristics stand in sharp contrast to the volatility of non-interest income.
6. Efficiency Ratio
Topline growth alone doesn't tell the complete story - the profitability of that growth shapes actual earnings impact. Banks track this dynamic through efficiency ratios, which compare non-interest expenses such as personnel, rent, IT, and marketing costs to total revenue streams.
Markets understand that a bank’s expense base depends on its revenue mix and what mostly drives share price performance is the change in this ratio, rather than its absolute value. It’s somewhat counterintuitive, but a lower efficiency ratio is better.
Over the last five years, Comerica’s efficiency ratio has increased by 10.3 percentage points, going from 61.8% to 69.4%. Said differently, the company’s expenses have increased at a faster rate than revenue, which usually raises questions unless the company is in high-growth mode and reinvesting its profits into attractive ventures.
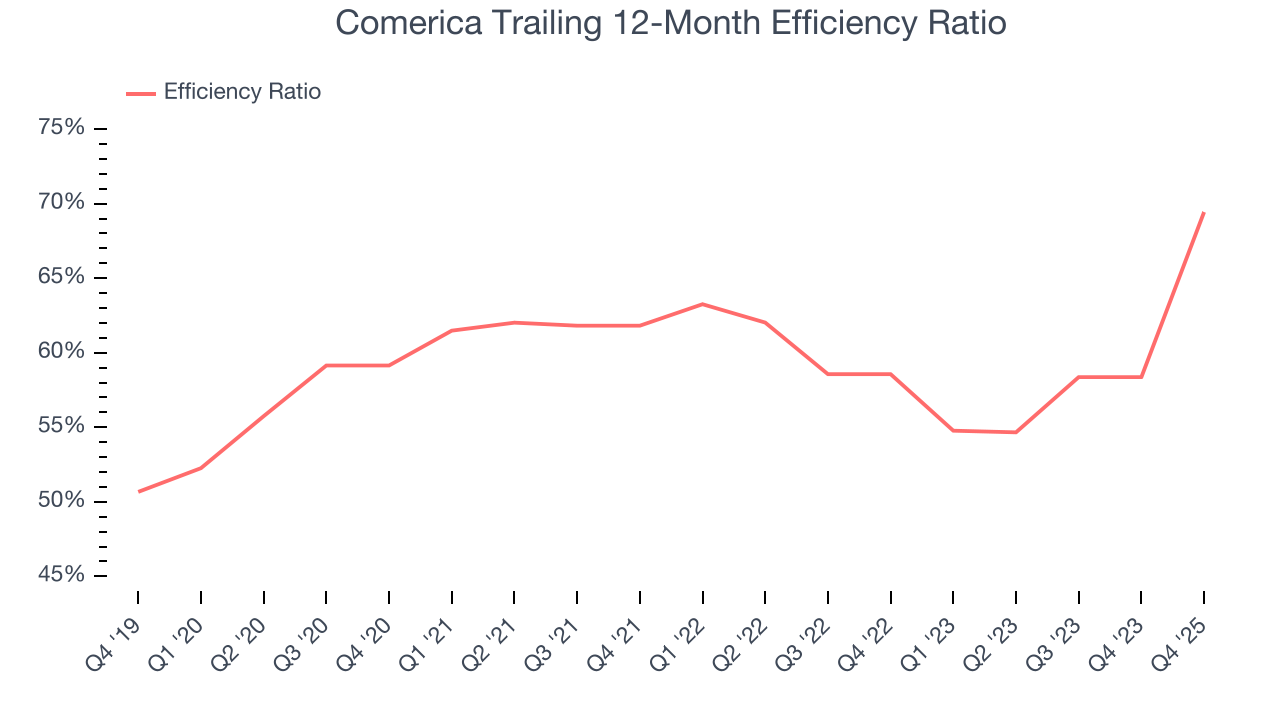
Comerica’s efficiency ratio came in at 72.3% this quarter, falling short of analysts’ expectations by 193.3 basis points (100 basis points = 1 percentage point).
For the next 12 months, Wall Street expects Comerica to maintain its trailing one-year ratio with a projection of 69.3%.
7. Earnings Per Share
Revenue trends explain a company’s historical growth, but the long-term change in earnings per share (EPS) points to the profitability of that growth – for example, a company could inflate its sales through excessive spending on advertising and promotions.
Comerica’s EPS grew at a decent 10.9% compounded annual growth rate over the last five years, higher than its 2.7% annualized revenue growth. This tells us the company became more profitable on a per-share basis as it expanded.
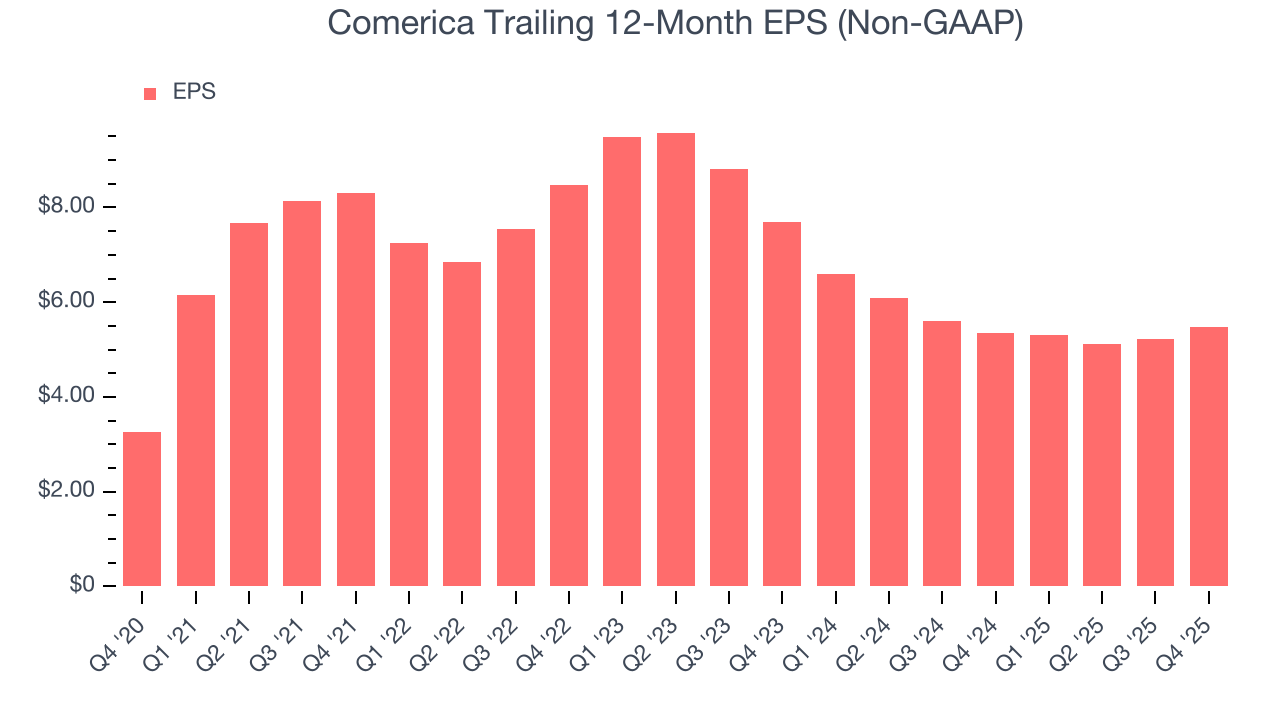
Like with revenue, we analyze EPS over a shorter period to see if we are missing a change in the business.
For Comerica, its two-year annual EPS declines of 15.6% mark a reversal from its five-year trend. We hope Comerica can return to earnings growth in the future.
In Q4, Comerica reported adjusted EPS of $1.46, up from $1.20 in the same quarter last year. This print easily cleared analysts’ estimates, and shareholders should be content with the results. Over the next 12 months, Wall Street expects Comerica’s full-year EPS of $5.49 to shrink by 2.4%.
8. Tangible Book Value Per Share (TBVPS)
The balance sheet drives banking profitability since earnings flow from the spread between borrowing and lending rates. As such, valuations for these companies concentrate on capital strength and sustainable equity accumulation potential.
Because of this, tangible book value per share (TBVPS) emerges as the critical performance benchmark. By excluding intangible assets with uncertain liquidation values, this metric captures real, liquid net worth per share. Traditional metrics like EPS are helpful but face distortion from M&A activity and loan loss accounting rules.
Comerica’s TBVPS was flat over the last five years. However, TBVPS growth has accelerated recently, growing by 14.3% annually over the last two years from $39.90 to $52.16 per share.
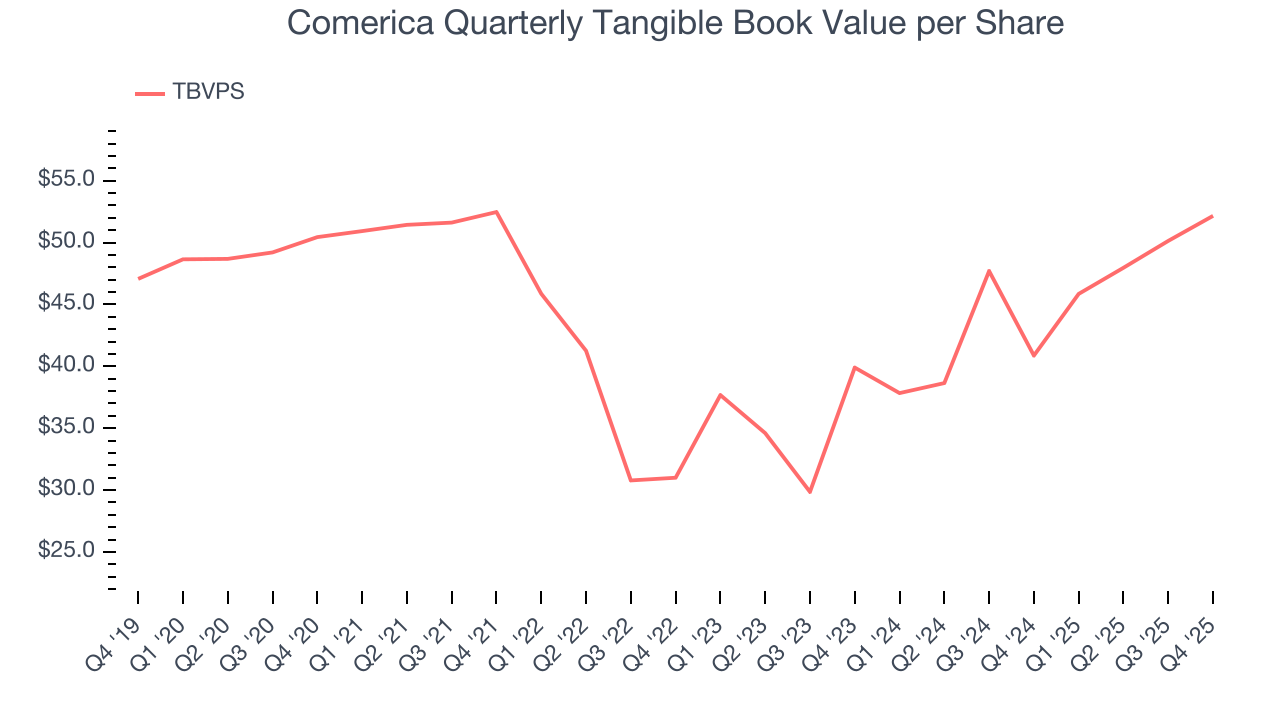
Over the next 12 months, Consensus estimates call for Comerica’s TBVPS to grow by 2.9% to $53.66, lousy growth rate.
9. Balance Sheet Assessment
Leverage is core to a financial firm’s business model (loans funded by deposits). To ensure economic stability and avoid a repeat of the 2008 GFC, regulators require certain levels of capital and liquidity, focusing on the Tier 1 capital ratio.
Tier 1 capital is the highest-quality capital that a firm holds, consisting primarily of common stock and retained earnings, but also physical gold. It serves as the primary cushion against losses and is the first line of defense in times of financial distress.
This capital is divided by risk-weighted assets to derive the Tier 1 capital ratio. Risk-weighted means that cash and US treasury securities are assigned little risk while unsecured consumer loans and equity investments get much higher risk weights, for example.
New regulation after the 2008 financial crisis requires that all firms must maintain a Tier 1 capital ratio greater than 4.5%. On top of this, there are additional buffers based on scale, risk profile, and other regulatory classifications, so that at the end of the day, firms generally must maintain a 7-10% ratio at minimum.
Over the last two years, Comerica has averaged a Tier 1 capital ratio of 11.9%, which is considered safe and well capitalized in the event that macro or market conditions suddenly deteriorate.
10. Return on Equity
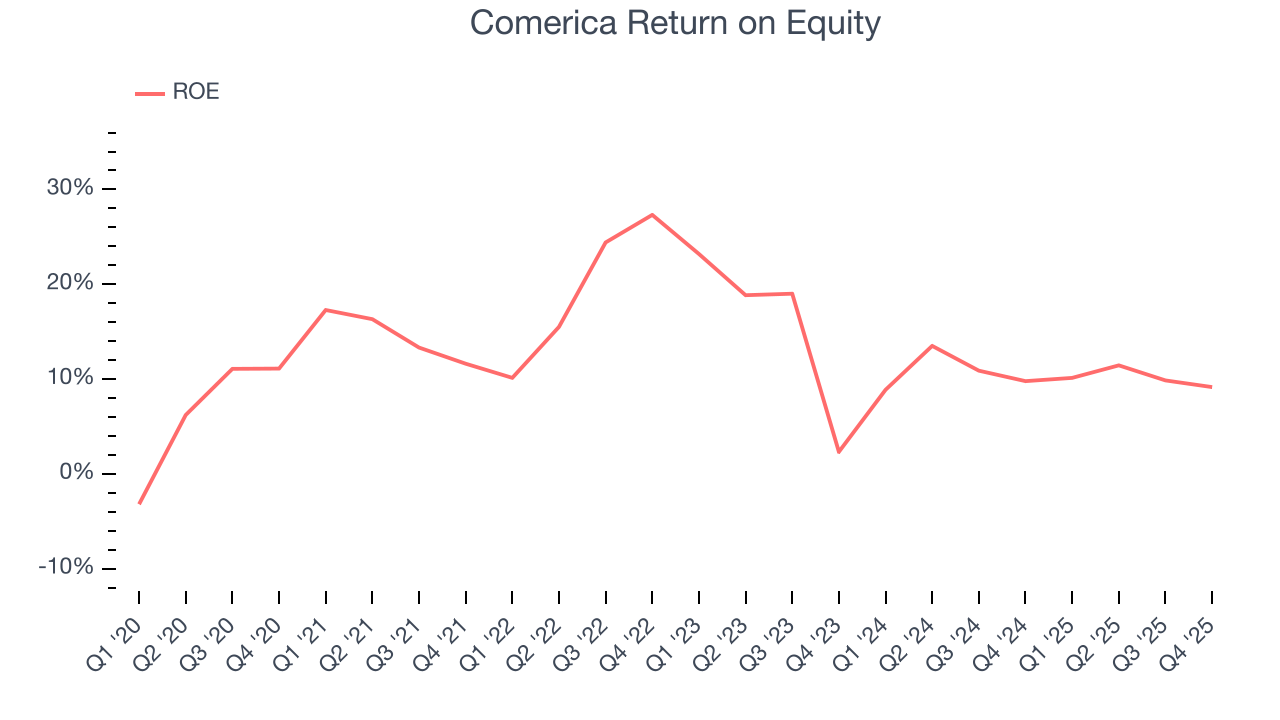
Return on equity (ROE) measures how effectively banks generate profit from each dollar of shareholder equity - a critical funding source. High-ROE institutions typically compound shareholder wealth faster over time through retained earnings, share repurchases, and dividend payments.
Over the last five years, Comerica has averaged an ROE of 14.1%, impressive for a company operating in a sector where the average shakes out around 7.5% and those putting up 15%+ are greatly admired. This is a bright spot for Comerica.
11. Key Takeaways from Comerica’s Q4 Results
It was good to see Comerica beat analysts’ EPS expectations this quarter. We were also happy its revenue narrowly outperformed Wall Street’s estimates. Overall, we think this was a solid quarter with some key areas of upside. The stock traded up 2.7% to $94.08 immediately following the results.
12. Is Now The Time To Buy Comerica?
Updated: February 2, 2026 at 11:52 PM EST
Are you wondering whether to buy Comerica or pass? We urge investors to not only consider the latest earnings results but also longer-term business quality and valuation as well.
Comerica falls short of our quality standards. First off, its revenue growth was weak over the last five years, and analysts don’t see anything changing over the next 12 months. And while its solid ROE suggests it has grown profitably in the past, the downside is its estimated sales for the next 12 months are weak. On top of that, its TBVPS growth was weak over the last five years.
Comerica’s P/B ratio based on the next 12 months is 1.6x. At this valuation, there’s a lot of good news priced in - you can find more timely opportunities elsewhere.
Wall Street analysts have a consensus one-year price target of $89.89 on the company (compared to the current share price of $90.95).