
CNA Financial (CNA)
We wouldn’t recommend CNA Financial. Its weak sales growth and low returns on capital show it struggled to generate demand and profits.― StockStory Analyst Team
1. News


2. Summary
Why We Think CNA Financial Will Underperform
With roots dating back to 1853 and majority ownership by Loews Corporation, CNA Financial (NYSE:CNA) is a commercial property and casualty insurance provider offering coverage for businesses, including professional liability, surety bonds, and specialized risk management services.
- Book value per share tumbled by 1.1% annually over the last five years, showing insurance sector trends are working against its favor during this cycle
- Earnings per share lagged its peers over the last two years as they only grew by 6.8% annually
- Underwhelming 10.4% return on equity reflects management’s difficulties in finding profitable growth opportunities


CNA Financial is skating on thin ice. You should search for better opportunities.
Why There Are Better Opportunities Than CNA Financial


CNA Financial’s stock price of $46.27 implies a valuation ratio of 9.3x forward P/E. This multiple is high given its weaker fundamentals.
We’d rather invest in companies with elite fundamentals than questionable ones with open questions and big downside risks. The durable earnings power of high-quality businesses helps us sleep well at night.
3. CNA Financial (CNA) Research Report: Q3 CY2025 Update
Insurance provider CNA Financial (NYSE:CNA) met Wall Streets revenue expectations in Q3 CY2025, with sales up 5.5% year on year to $3.82 billion. Its non-GAAP profit of $1.50 per share was 13.6% above analysts’ consensus estimates.
CNA Financial (CNA) Q3 CY2025 Highlights:
Company Overview
With roots dating back to 1853 and majority ownership by Loews Corporation, CNA Financial (NYSE:CNA) is a commercial property and casualty insurance provider offering coverage for businesses, including professional liability, surety bonds, and specialized risk management services.
CNA Financial operates through three main property and casualty segments: Specialty, Commercial, and International. The Specialty segment offers management and professional liability coverage to various professional firms like architects, law firms, and healthcare providers. It also provides surety bonds and warranty services for consumer goods and vehicles.
The Commercial segment targets small businesses, construction companies, and middle-market customers with standard property and casualty products. These include workers' compensation, general liability, commercial auto, and excess coverage. Policies are typically offered on a guaranteed cost basis, though CNA also provides specialized loss-sensitive programs for larger clients.
The International segment underwrites policies globally through operations in Canada, the United Kingdom, Continental Europe, and Lloyd's of London. Through its Lloyd's Syndicate 382, CNA underwrites energy, marine, property, and specialty lines for risks located worldwide.
Beyond its core property and casualty operations, CNA maintains a Life & Group segment that manages its run-off long-term care business and certain structured settlement obligations. The company distributes its products primarily through independent agents, brokers, and managing general underwriters who market to a diverse customer base.
A business might engage CNA for directors and officers liability insurance to protect its leadership from claims related to management decisions, or a construction company might purchase surety bonds from CNA to guarantee project completion for its clients. CNA generates revenue through premium payments for these insurance policies and bonds.
4. Property & Casualty Insurance
Property & Casualty (P&C) insurers protect individuals and businesses against financial loss from damage to property or from legal liability. This is a cyclical industry, and the sector benefits when there is 'hard market', characterized by strong premium rate increases that outpace loss and cost inflation, resulting in robust underwriting margins. The opposite is true in a 'soft market'. Interest rates also matter, as they determine the yields earned on fixed-income portfolios. On the other hand, P&C insurers face a major secular headwind from the increasing frequency and severity of catastrophe losses due to climate change. Furthermore, the liability side of the business is pressured by 'social inflation'—the trend of rising litigation costs and larger jury awards.
CNA Financial competes with other major commercial insurance providers including Chubb (NYSE:CB), The Hartford (NYSE:HIG), Travelers (NYSE:TRV), and American International Group (NYSE:AIG), as well as specialty insurers in various market segments.
5. Revenue Growth
In general, insurance companies earn revenue from three primary sources. The first is the core insurance business itself, often called underwriting and represented in the income statement as premiums earned. The second source is investment income from investing the “float” (premiums collected upfront not yet paid out as claims) in assets such as fixed-income assets and equities. The third is fees from various sources such as policy administration, annuities, or other value-added services. Regrettably, CNA Financial’s revenue grew at a mediocre 6.9% compounded annual growth rate over the last five years. This fell short of our benchmark for the insurance sector and is a tough starting point for our analysis.
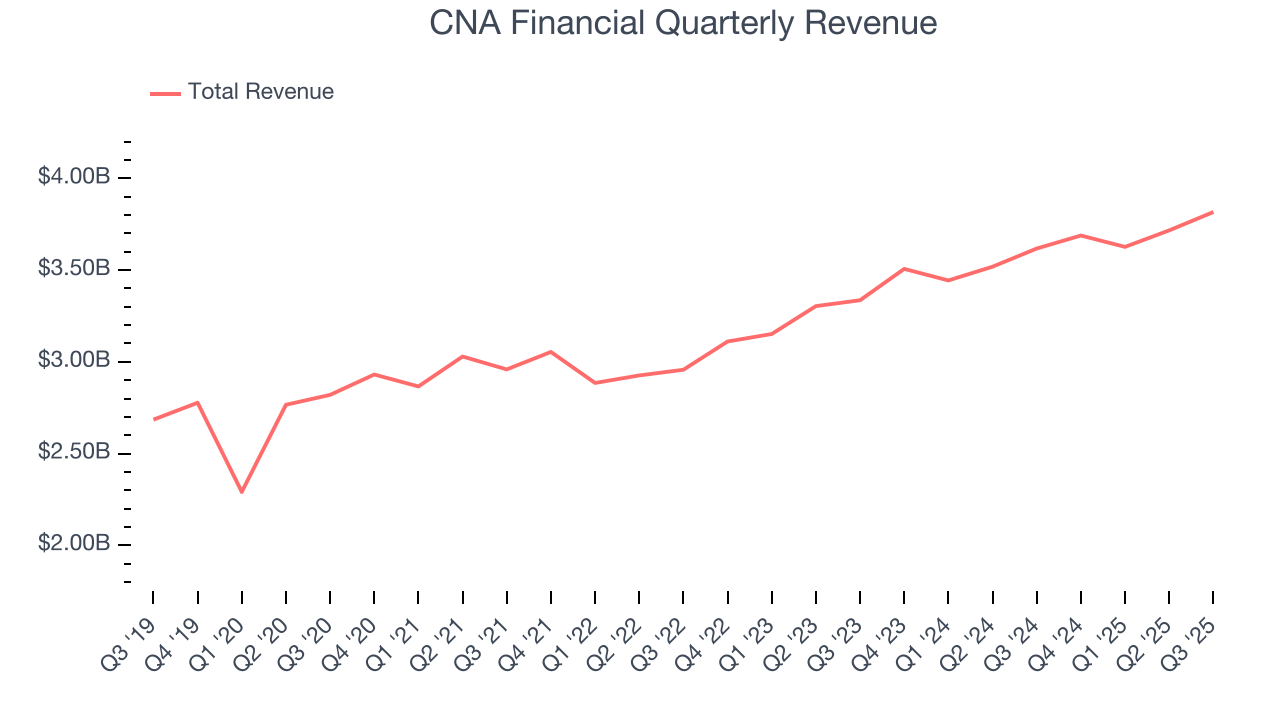
We at StockStory place the most emphasis on long-term growth, but within financials, a half-decade historical view may miss recent interest rate changes, market returns, and industry trends. CNA Financial’s annualized revenue growth of 7.3% over the last two years aligns with its five-year trend, suggesting its demand was consistently weak. 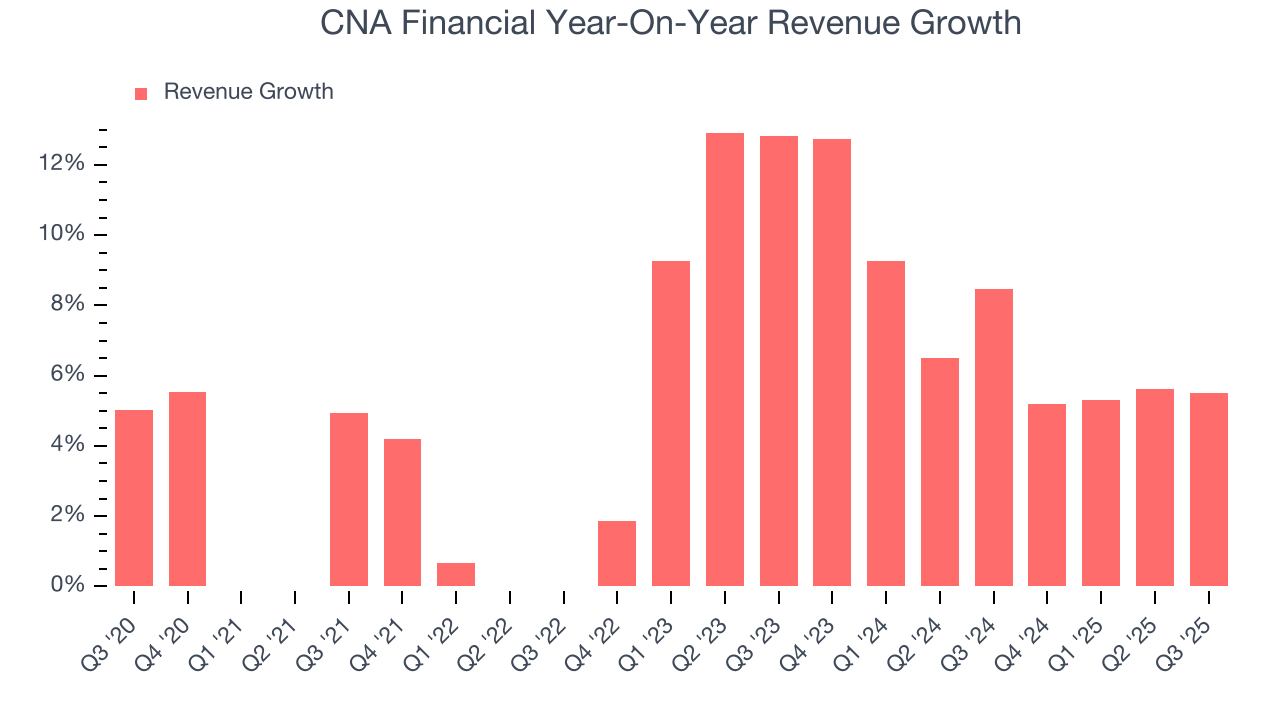 Note: Quarters not shown were determined to be outliers, impacted by outsized investment gains/losses that are not indicative of the recurring fundamentals of the business.
This quarter, CNA Financial grew its revenue by 5.5% year on year, and its $3.82 billion of revenue was in line with Wall Street’s estimates.
Net premiums earned made up 71.1% of the company’s total revenue during the last five years, meaning insurance operations are CNA Financial’s largest source of revenue.
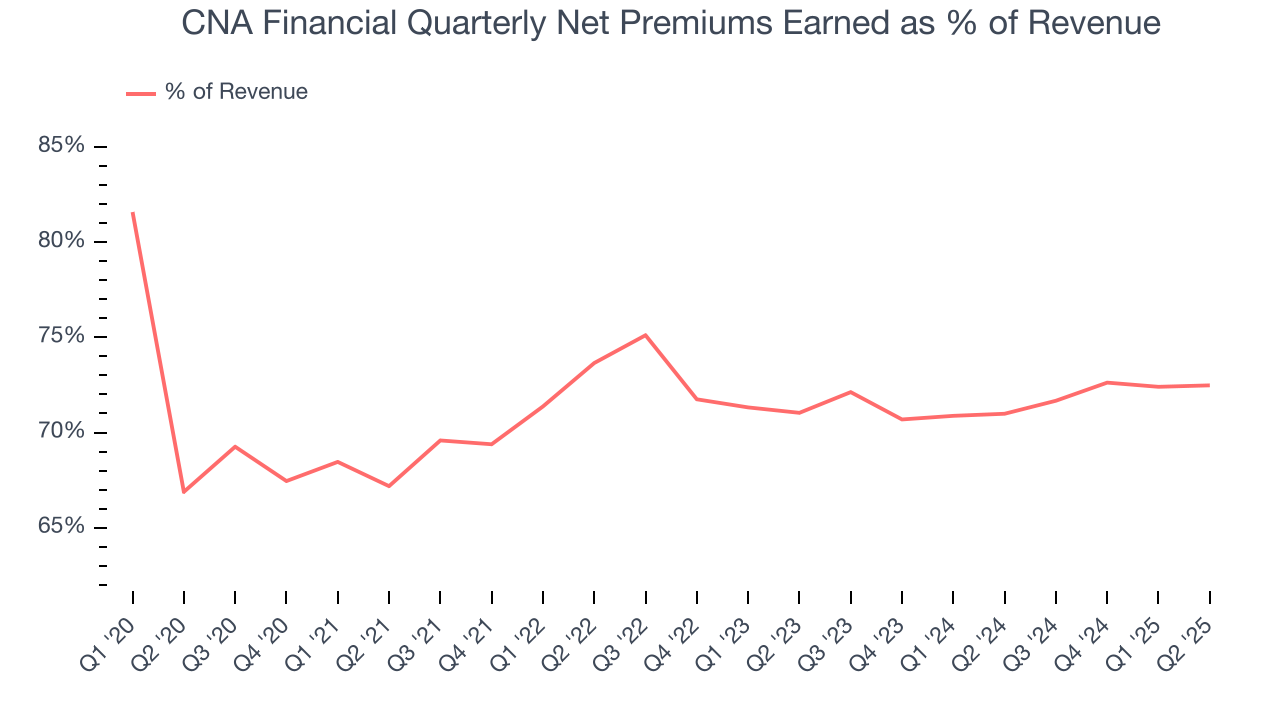
While insurers generate revenue from multiple sources, investors view net premiums earned as the cornerstone - its direct link to core operations stands in sharp contrast to the unpredictability of investment returns and fees.
6. Net Premiums Earned
When insurers sell policies, they protect themselves from extremely large losses or an outsized accumulation of losses with reinsurance (insurance for insurance companies). Net premiums earned are:
- Gross premiums - what’s ceded to reinsurers as a risk mitigation and transfer strategy
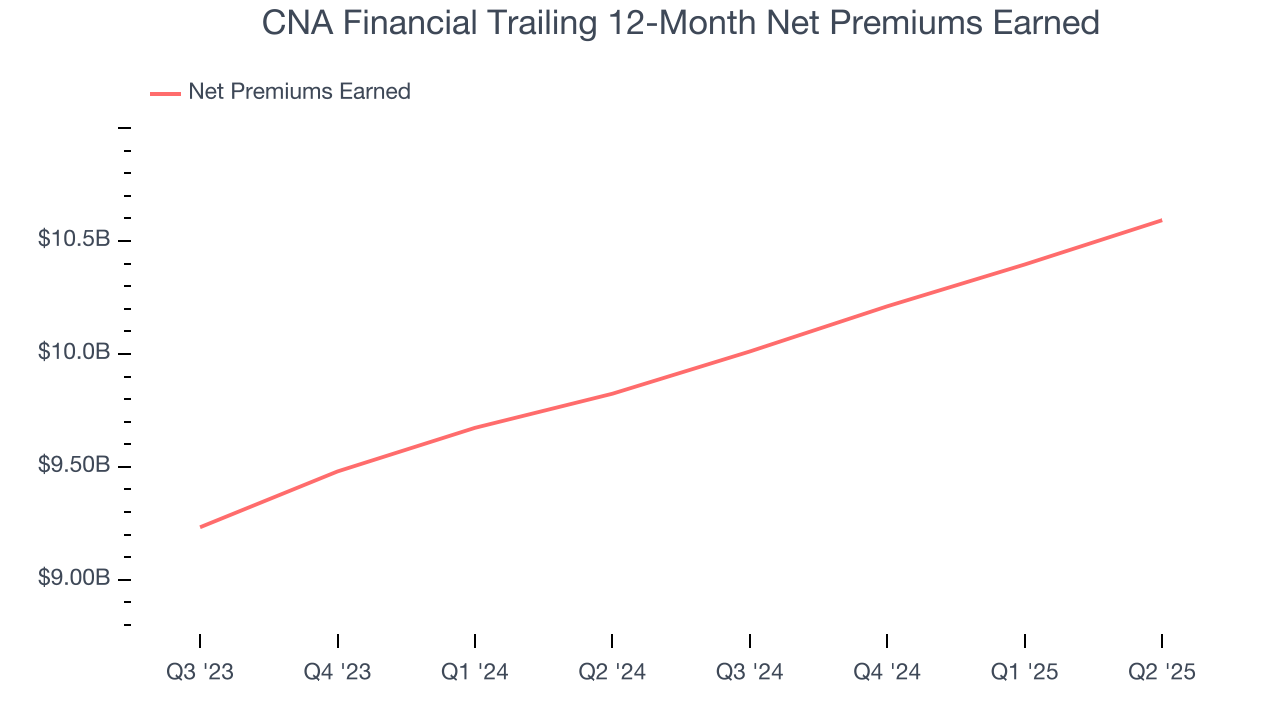
CNA Financial’s net premiums earned has grown at a 7.4% annualized rate over the last five years, slightly worse than the broader insurance industry and in line with its total revenue.
When analyzing CNA Financial’s net premiums earned over the last two years, we can paint a similar picture as it recorded an annual growth rate of 8.2%. This performance was similar to its total revenue.
7. Combined Ratio
Revenue growth is one major determinant of business quality, and the efficiency of operations is another. For insurance companies, we look at the combined ratio rather than the operating expenses and margins that define sectors such as consumer, tech, and industrials.
Combined ratio = (costs of underwriting + what an insurer pays out in claims) / net premiums earned. If a company boasts a combined ratio under 100%, it is underwriting profitably. If above 100%, it is losing money on its core operations.
Given the calculation, a lower expense ratio is better. Over the last five years, CNA Financial’s combined ratio has swelled by 12 percentage points, going from 106% to 96.2%. However, fixed cost leverage was muted more recently as the company’s combined ratio was flat on a two-year basis.
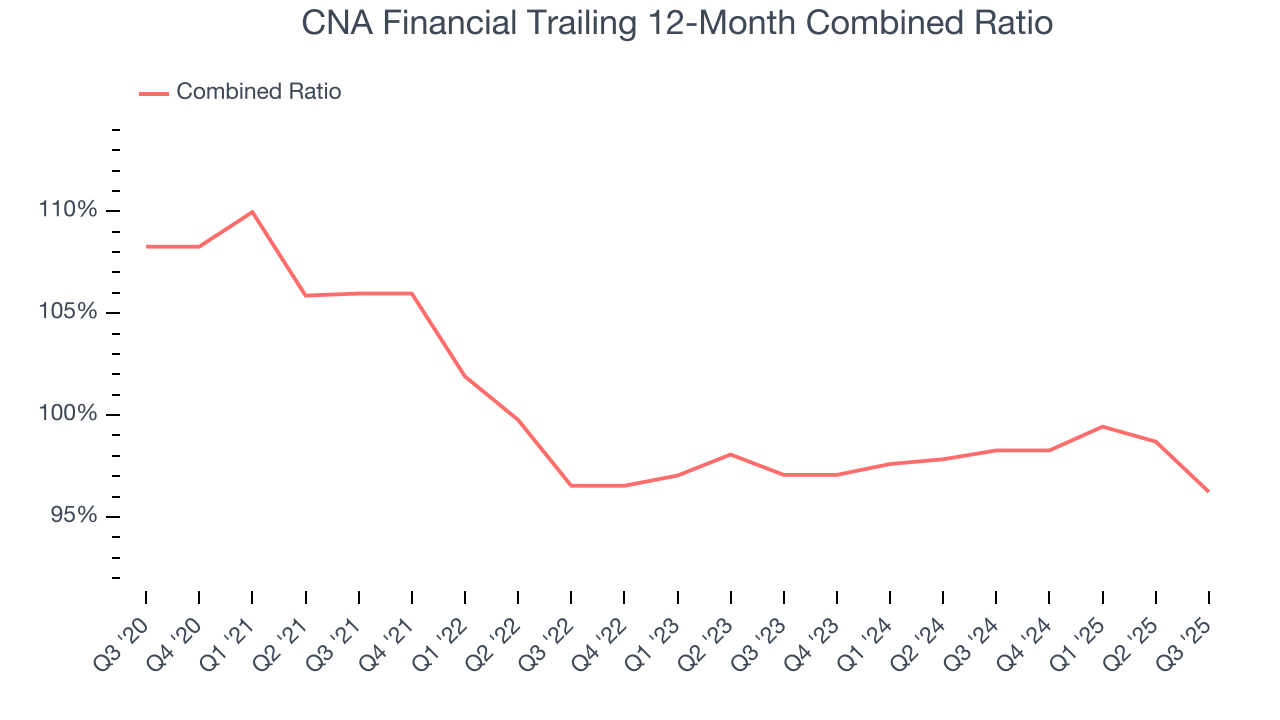
In Q3, CNA Financial’s combined ratio was 92.8%. This result was 7.4 percentage points better than the same quarter last year.
8. Earnings Per Share
We track the long-term change in earnings per share (EPS) for the same reason as long-term revenue growth. Compared to revenue, however, EPS highlights whether a company’s growth is profitable.
CNA Financial’s EPS grew at a solid 15.5% compounded annual growth rate over the last five years, higher than its 6.9% annualized revenue growth. However, we take this with a grain of salt because its combined ratio didn’t improve and it didn’t repurchase its shares, meaning the delta came from factors we consider non-core or less sustainable over the long term.
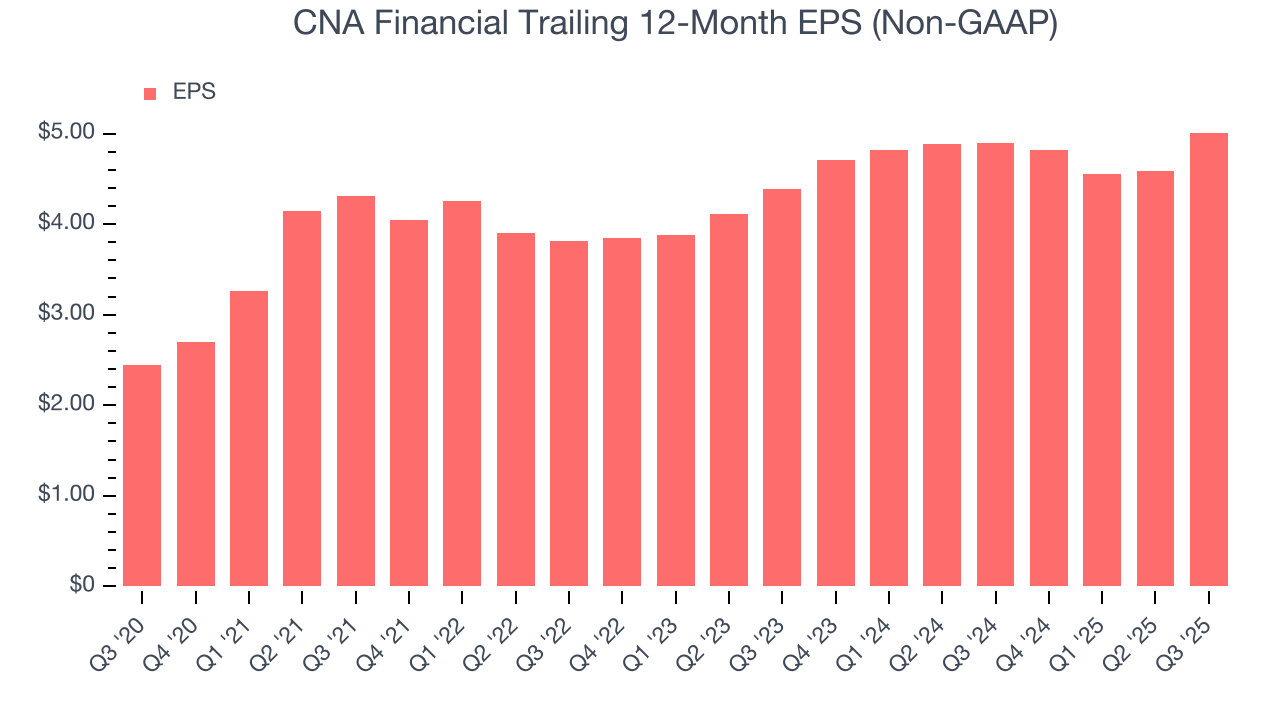
Like with revenue, we analyze EPS over a more recent period because it can provide insight into an emerging theme or development for the business.
For CNA Financial, its two-year annual EPS growth of 6.8% was lower than its five-year trend. We hope its growth can accelerate in the future.
In Q3, CNA Financial reported adjusted EPS of $1.50, up from $1.08 in the same quarter last year. This print easily cleared analysts’ estimates, and shareholders should be content with the results. We also like to analyze expected EPS growth based on Wall Street analysts’ consensus projections, but there is insufficient data.
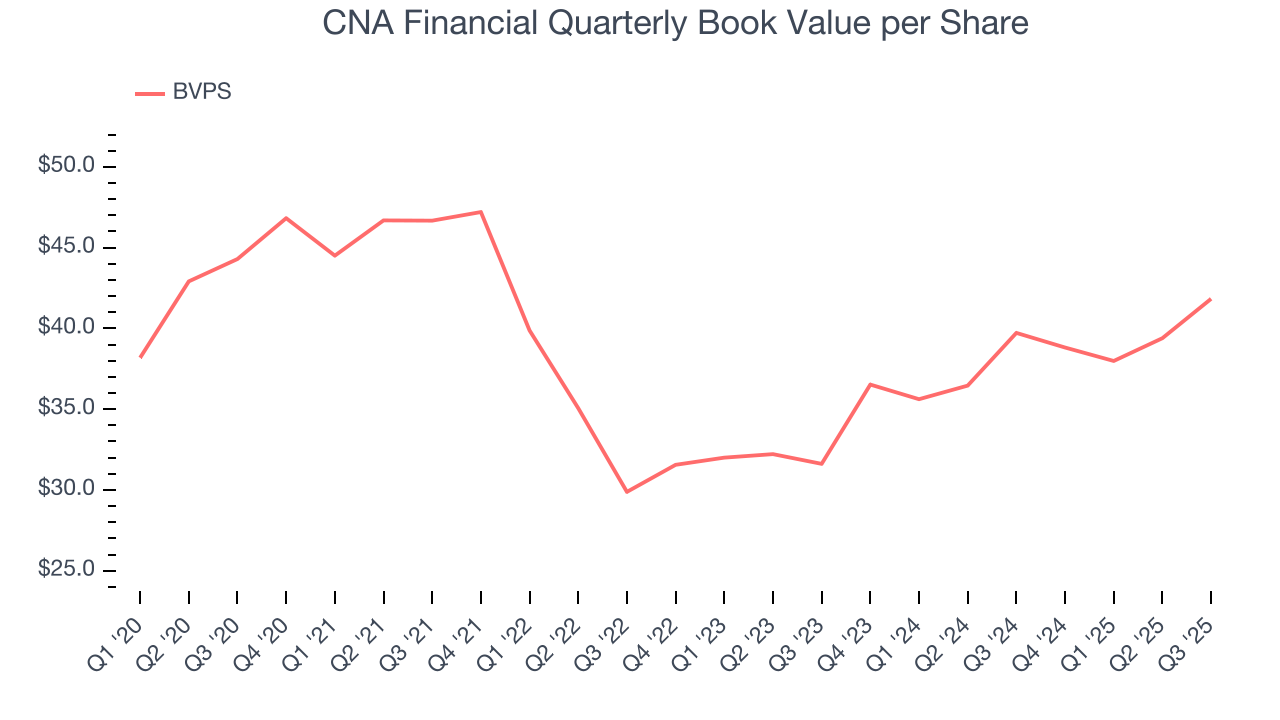
9. Book Value Per Share (BVPS)
Insurers are balance sheet businesses, collecting premiums upfront and paying out claims over time. Premiums collected but not yet paid out, often referred to as the float, are invested and create an asset base supported by a liability structure. Book value per share (BVPS) captures this dynamic by measuring these assets (investment portfolio, cash, reinsurance recoverables) less liabilities (claim reserves, debt, future policy benefits). BVPS is essentially the residual value for shareholders.
We therefore consider BVPS very important to track for insurers and a metric that sheds light on business quality because it reflects long-term capital growth and is harder to manipulate than more commonly-used metrics like EPS.
CNA Financial’s BVPS declined at a 1.1% annual clip over the last five years. However, BVPS growth has accelerated recently, growing by 15% annually over the last two years from $31.61 to $41.83 per share.
10. Balance Sheet Assessment
The debt-to-equity ratio is a widely used measure to assess a company's balance sheet health. A higher ratio means that a business aggressively financed its growth with debt. This can result in higher earnings (if the borrowed funds are invested profitably) but also increases risk.
If debt levels are too high, there could be difficulties in meeting obligations, especially during economic downturns or periods of rising interest rates if the debt has variable-rate payments.
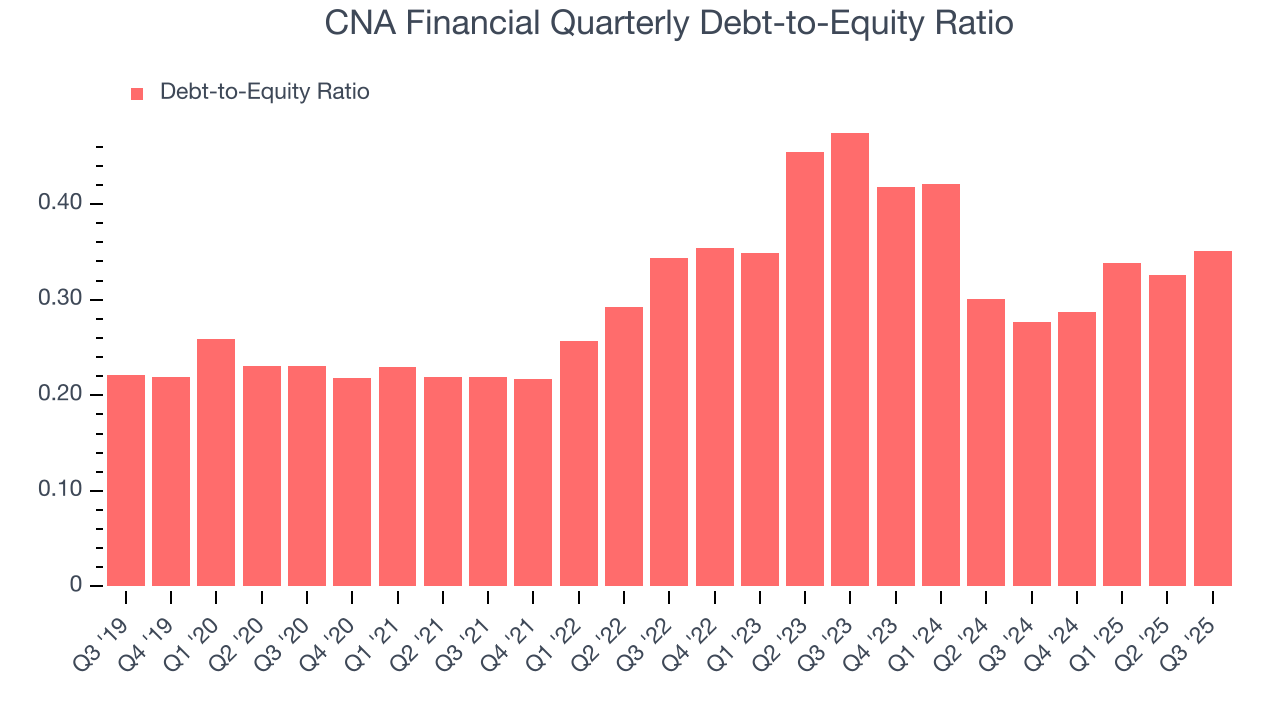
CNA Financial currently has $3.97 billion of debt and $11.32 billion of shareholder's equity on its balance sheet, and over the past four quarters, has averaged a debt-to-equity ratio of 0.3×. We think this is safe and raises no red flags. In general, we’re comfortable with any ratio below 1.0× for an insurance business. Anything below 0.5× is a bonus.
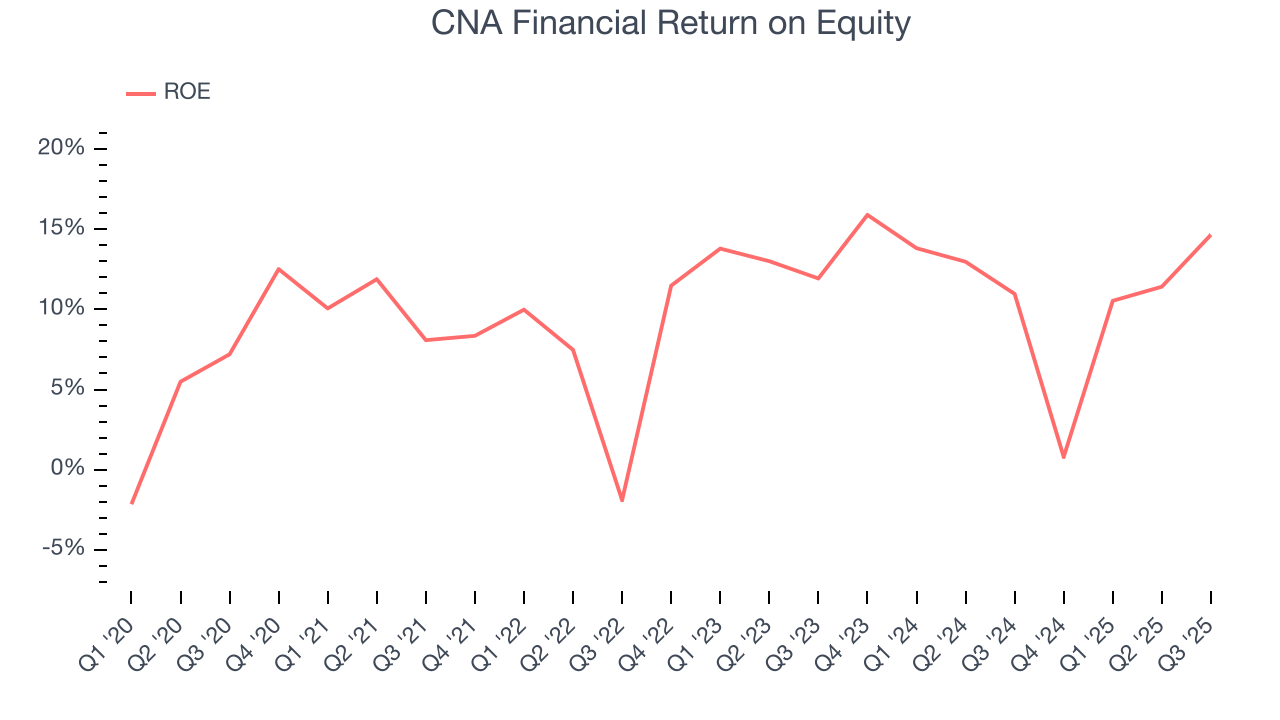
11. Return on Equity
Return on equity (ROE) is a crucial yardstick for insurance companies, measuring their ability to generate returns on the capital provided by shareholders. Insurers that consistently deliver superior ROE tend to create more value for their investors over time through strategic capital allocation and shareholder-friendly policies.
Over the last five years, CNA Financial has averaged an ROE of 10.4%, uninspiring for a company operating in a sector where the average shakes out around 12.5%.
12. Key Takeaways from CNA Financial’s Q3 Results
It was good to see CNA Financial beat analysts’ EPS expectations this quarter. We were also happy its revenue was in line with Wall Street’s estimates. Overall, we think this was a decent quarter with some key metrics above expectations. The stock traded up 1.5% to $44.72 immediately following the results.
13. Is Now The Time To Buy CNA Financial?
Updated: January 24, 2026 at 11:48 PM EST
The latest quarterly earnings matters, sure, but we actually think longer-term fundamentals and valuation matter more. Investors should consider all these pieces before deciding whether or not to invest in CNA Financial.
We cheer for all companies serving everyday consumers, but in the case of CNA Financial, we’ll be cheering from the sidelines. For starters, its revenue growth was mediocre over the last five years, and analysts expect its demand to deteriorate over the next 12 months. And while its improving combined ratio shows the business has become more productive, the downside is its BVPS has declined over the last five years. On top of that, its projected EPS for the next year is lacking.
CNA Financial’s P/E ratio based on the next 12 months is 9.3x. This multiple tells us a lot of good news is priced in - you can find more timely opportunities elsewhere.
Wall Street analysts have a consensus one-year price target of $44 on the company (compared to the current share price of $46.27), implying they don’t see much short-term potential in CNA Financial.