
CNO Financial Group (CNO)
CNO Financial Group doesn’t excite us. Its sluggish sales growth shows demand is soft, a worrisome sign for investors in high-quality stocks.― StockStory Analyst Team
1. News

2. Summary
Why We Think CNO Financial Group Will Underperform
Rebranded from Conseco in 2010 to signal a fresh start after navigating financial challenges, CNO Financial Group (NYSE:CNO) develops and markets health insurance, annuities, and life insurance products primarily targeting middle-income pre-retirees and retirees.
- Annual book value per share declines of 5.7% for the past five years show its capital management struggled during this cycle
- Net premiums earned plateaued over the last five years, signaling weak incremental demand for its insurance policies
- One positive is that its exciting book value per share outlook for the upcoming 12 months calls for 54.7% growth, an acceleration from its two-year trend


CNO Financial Group’s quality is not up to our standards. We believe there are better businesses elsewhere.
Why There Are Better Opportunities Than CNO Financial Group


CNO Financial Group is trading at $42.51 per share, or 1.5x forward P/B. This multiple is cheaper than most insurance peers, but we think this is justified.
Our advice is to pay up for elite businesses whose advantages are tailwinds to earnings growth. Don’t get sucked into lower-quality businesses just because they seem like bargains. These mediocre businesses often never achieve a higher multiple as hoped, a phenomenon known as a “value trap”.
3. CNO Financial Group (CNO) Research Report: Q4 CY2025 Update
Insurance services company CNO Financial Group (NYSE:CNO) reported Q4 CY2025 results topping the market’s revenue expectations, with sales up 15.5% year on year to $1.14 billion. Its GAAP profit of $0.95 per share was 16.8% below analysts’ consensus estimates.
CNO Financial Group (CNO) Q4 CY2025 Highlights:
- Net Premiums Earned: $662.2 million (2.9% year-on-year growth)
- Revenue: $1.14 billion vs analyst estimates of $998.4 million (15.5% year-on-year growth, 14.5% beat)
- Pre-tax Profit: $111.4 million (9.7% margin)
- EPS (GAAP): $0.95 vs analyst expectations of $1.14 (16.8% miss)
- Book Value per Share: $27.92 vs analyst estimates of $39.83 (13.6% year-on-year growth, 29.9% miss)
- Market Capitalization: $4.06 billion
Company Overview
Rebranded from Conseco in 2010 to signal a fresh start after navigating financial challenges, CNO Financial Group (NYSE:CNO) develops and markets health insurance, annuities, and life insurance products primarily targeting middle-income pre-retirees and retirees.
CNO operates through two main divisions: Consumer and Worksite. The Consumer Division engages directly with individual customers through various channels including face-to-face meetings with exclusive agents, phone calls, and online interactions. The Worksite Division focuses on selling voluntary benefits in workplace settings, offering employers and their employees benefits administration and advocacy services.
The company's product portfolio spans three main categories. Its annuity products include fixed indexed annuities that combine guaranteed minimum returns with potential market-linked gains, traditional fixed rate annuities, and immediate annuities that provide regular income payments. Health insurance offerings feature Medicare supplement policies that cover gaps in federal Medicare coverage, supplemental health products for specific conditions like cancer or heart disease, and long-term care insurance for nursing home or home healthcare needs. Life insurance products round out the lineup with both interest-sensitive options like universal life and traditional policies including whole life and term coverage.
CNO markets its products primarily under three brands: Bankers Life, Washington National, and Colonial Penn. Its distribution network includes approximately 4,200 exclusive agents operating from over 230 branch offices, independent producers, and direct marketing channels. The company maintains a strategic focus on the middle-income market segment, which it views as underserved by larger insurers.
Revenue generation comes primarily from premium payments and the investment spread—the difference between what CNO earns on its investment portfolio and what it pays out to policyholders in benefits and credited interest.
4. Life Insurance
Life insurance companies collect premiums from policyholders in exchange for providing a future death benefit or retirement income stream. Interest rates matter for the sector (and make it cyclical), with higher rates allowing insurers to reinvest their fixed-income portfolios at more attractive yields and vice versa. Additionally, favorable demographic shifts, such as an aging population, are driving strong demand for retirement products while AI and data analytics offer significant opportunities to improve underwriting accuracy and operational efficiency. Conversely, the industry faces headwinds from persistent competition from agile insurtechs that threaten traditional distribution models.
CNO Financial Group's competitors in the insurance market include Northwestern Mutual, Mutual of Omaha, and New York Life in the long-term care and life insurance segments. For Medicare supplement products, the company competes with Blue Cross and Blue Shield Plans, UnitedHealthcare, and Mutual of Omaha. In the worksite benefits space, its main rivals include AFLAC, Unum, MetLife, and Globe Life.
5. Revenue Growth
Big picture, insurers generate revenue from three key sources. The first is the core business of underwriting policies. The second source is income from investing the “float” (premiums collected upfront not yet paid out as claims) in assets such as fixed-income assets and equities. The third is fees from various sources such as policy administration, annuities, or other value-added services. Unfortunately, CNO Financial Group’s 2.3% annualized revenue growth over the last five years was sluggish. This fell short of our benchmarks and is a rough starting point for our analysis.
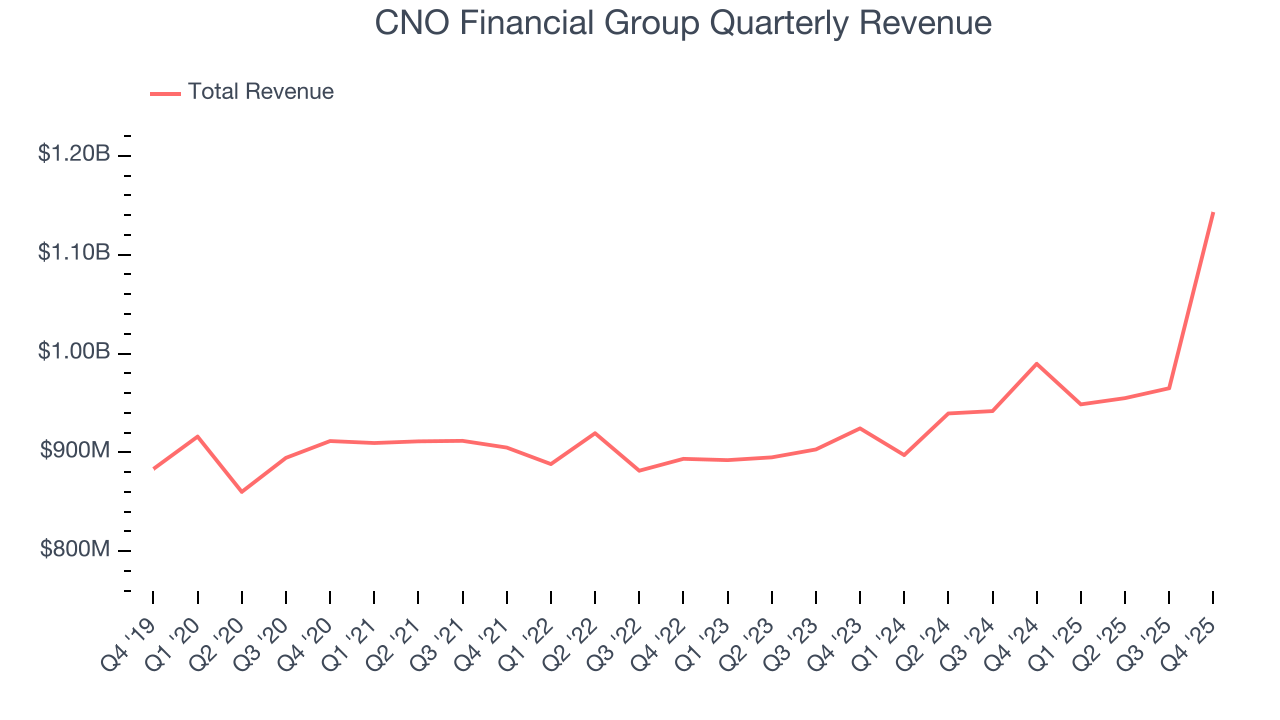
Long-term growth is the most important, but within financials, a half-decade historical view may miss recent interest rate changes and market returns. CNO Financial Group’s annualized revenue growth of 5.3% over the last two years is above its five-year trend, but we were still disappointed by the results.  Note: Quarters not shown were determined to be outliers, impacted by outsized investment gains/losses that are not indicative of the recurring fundamentals of the business.
This quarter, CNO Financial Group reported year-on-year revenue growth of 15.5%, and its $1.14 billion of revenue exceeded Wall Street’s estimates by 14.5%.
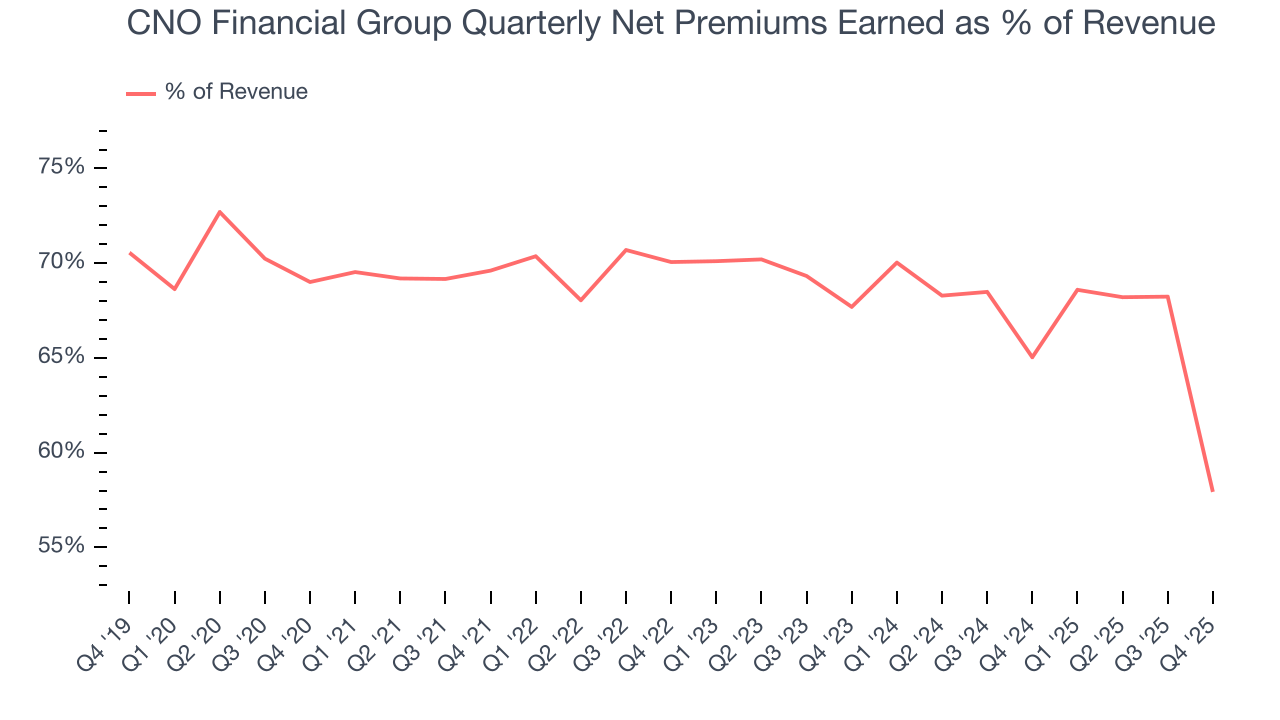
Net premiums earned made up 68.3% of the company’s total revenue during the last five years, meaning insurance operations are CNO Financial Group’s largest source of revenue.
Markets consistently prioritize net premiums earned growth over investment and fee income, recognizing its superior quality as a core indicator of the company’s underwriting success and market penetration.
6. Net Premiums Earned
When insurers sell policies, they protect themselves from extremely large losses or an outsized accumulation of losses with reinsurance (insurance for insurance companies). Net premiums earned are therefore net of what’s ceded to reinsurers as a risk mitigation and transfer strategy.
CNO Financial Group’s net premiums earned was flat over the last five years, much worse than the broader insurance industry. This shows that policy underwriting underperformed its other business lines.
When analyzing CNO Financial Group’s net premiums earned over the last two years, we can see that growth accelerated to 2.3% annually. Since two-year net premiums earned grew slower than total revenue over this period, it’s implied that other line items such as investment income grew at a faster rate. These extra revenue streams are important to the bottom line, yet their performance can be inconsistent. Some firms have been more successful and consistent in managing their float, but sharp fluctuations in the fixed income and equity markets can dramatically affect short-term results.
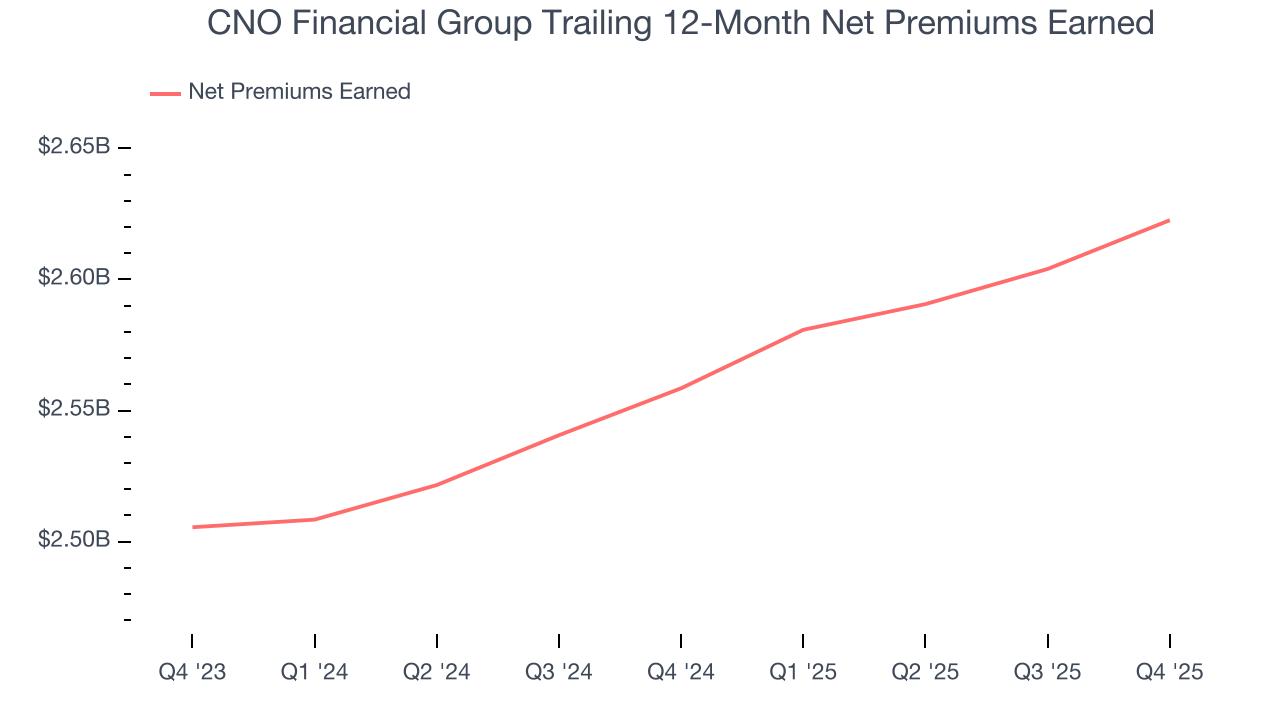
CNO Financial Group produced $662.2 million of net premiums earned in Q4, up 2.9% year on year.
7. Pre-Tax Profit Margin
Revenue growth is one major determinant of business quality, and the efficiency of operations is another. For insurance companies, we look at pre-tax profit rather than the operating margin that defines sectors such as consumer, tech, and industrials.
The economics of insurers are driven by their balance sheets, where assets (investing the float + premiums receivable) and liabilities (claims to pay) define the fundamentals. Interest income and expense should therefore be factored into the definition of profit but taxes - which are largely out of a company’s control - should not.
Over the last five years, CNO Financial Group’s pre-tax profit margin has risen by 2.3 percentage points, going from 15.6% to 7.3%. It has also declined by 2.6 percentage points on a two-year basis, showing its expenses have consistently increased at a faster rate than revenue. This usually raises questions unless the company is in high-growth mode and reinvesting its profits into attractive ventures.
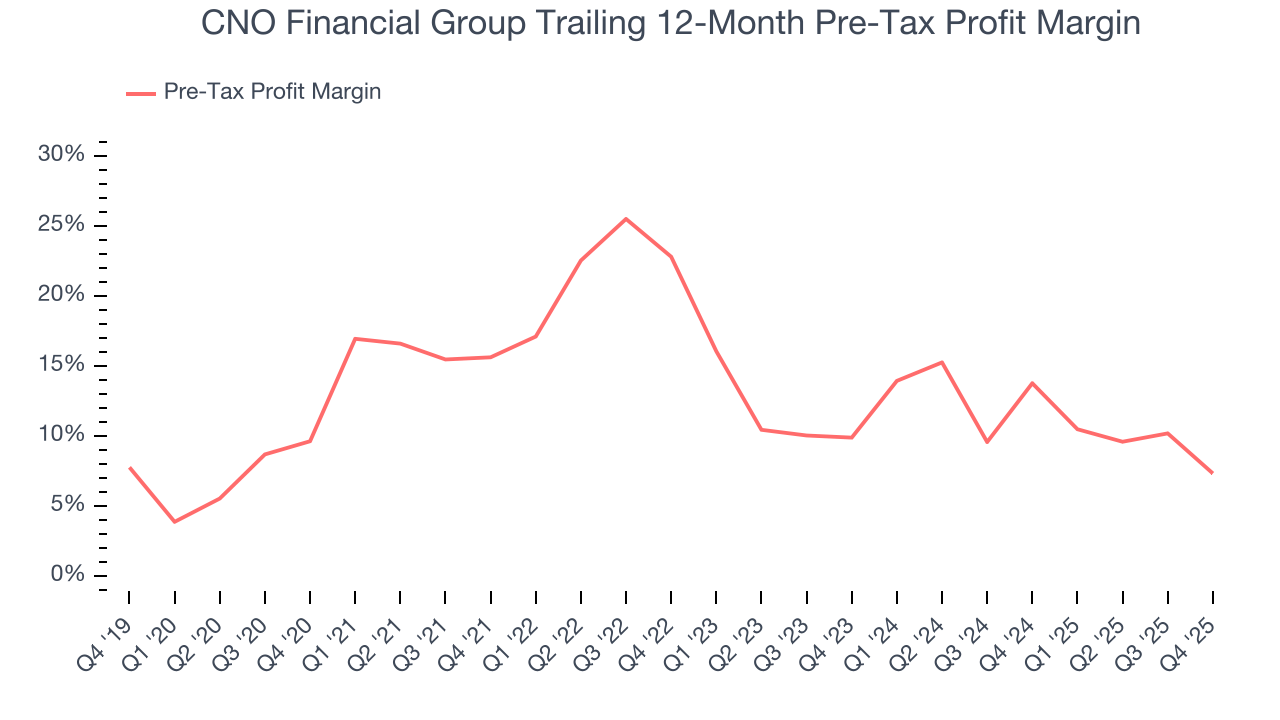
CNO Financial Group’s pre-tax profit margin came in at 9.7% this quarter. This result was 11.5 percentage points worse than the same quarter last year.
8. Earnings Per Share
We track the long-term change in earnings per share (EPS) for the same reason as long-term revenue growth. Compared to revenue, however, EPS highlights whether a company’s growth is profitable.
CNO Financial Group’s weak 1.6% annual EPS growth over the last five years aligns with its revenue performance. This tells us it maintained its per-share profitability as it expanded.
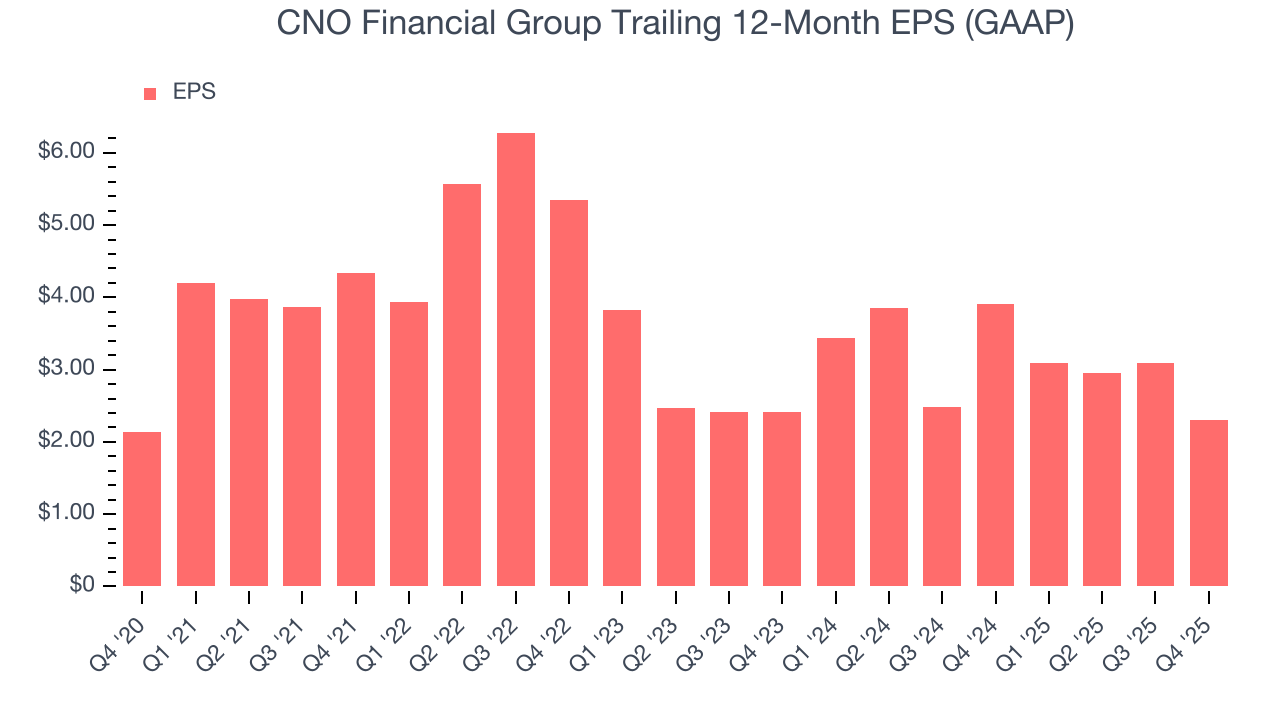
Like with revenue, we analyze EPS over a shorter period to see if we are missing a change in the business.
For CNO Financial Group, its two-year annual EPS declines of 2.2% show it’s continued to underperform. These results were bad no matter how you slice the data.
In Q4, CNO Financial Group reported EPS of $0.95, down from $1.74 in the same quarter last year. This print missed analysts’ estimates. Over the next 12 months, Wall Street expects CNO Financial Group’s full-year EPS of $2.31 to grow 87%.
9. Book Value Per Share (BVPS)
Insurance companies are balance sheet businesses, collecting premiums upfront and paying out claims over time. The float–premiums collected but not yet paid out–are invested, creating an asset base supported by a liability structure. Book value per share (BVPS) captures this dynamic by measuring these assets (investment portfolio, cash, reinsurance recoverables) less liabilities (claim reserves, debt, future policy benefits). BVPS is essentially the residual value for shareholders.
We therefore consider BVPS very important to track for insurers and a metric that sheds light on business quality because it reflects long-term capital growth and is harder to manipulate than more commonly-used metrics like EPS.
CNO Financial Group’s BVPS declined at a 7.2% annual clip over the last five years. However, BVPS growth has accelerated recently, growing by 17.4% annually over the last two years from $20.26 to $27.92 per share.
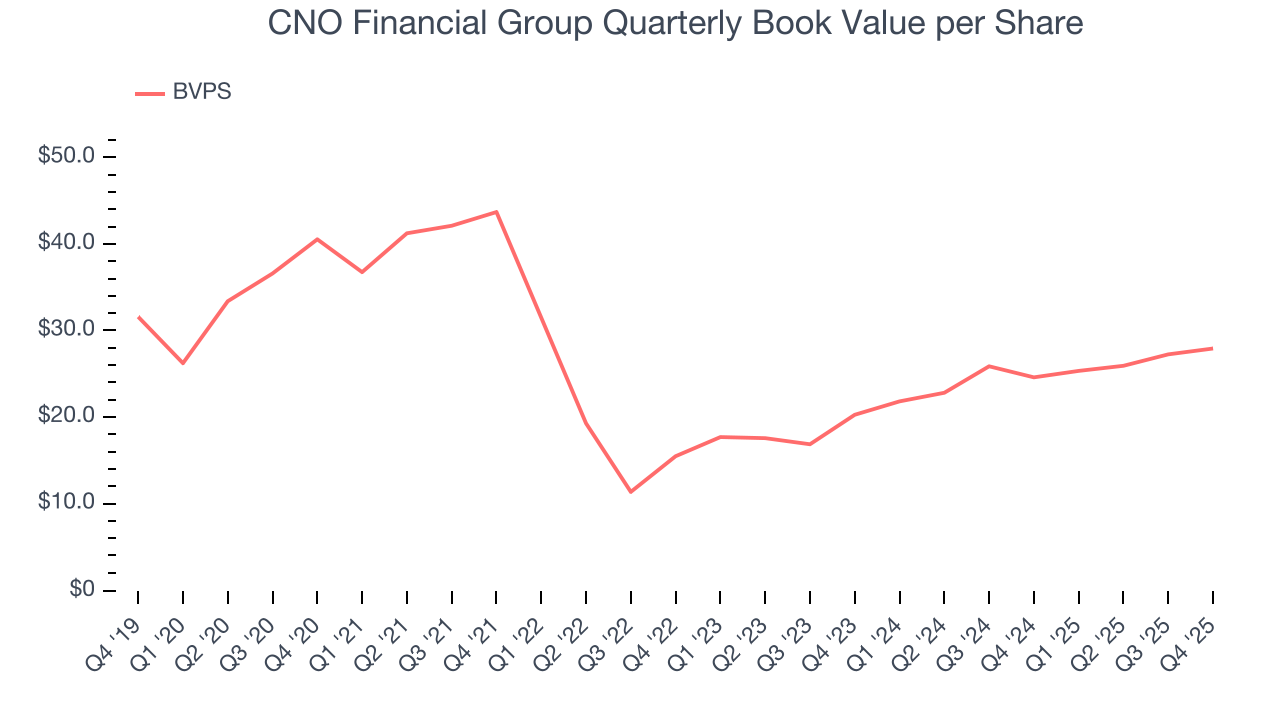
Over the next 12 months, Consensus estimates call for CNO Financial Group’s BVPS to grow by 54.7% to $39.83, elite growth rate.
10. Balance Sheet Assessment
The debt-to-equity ratio is a widely used measure to assess a company's balance sheet health. A higher ratio means that a business aggressively financed its growth with debt. This can result in higher earnings (if the borrowed funds are invested profitably) but also increases risk.
If debt levels are too high, there could be difficulties in meeting obligations, especially during economic downturns or periods of rising interest rates if the debt has variable-rate payments.
CNO Financial Group has no debt, so leverage is not an issue here.
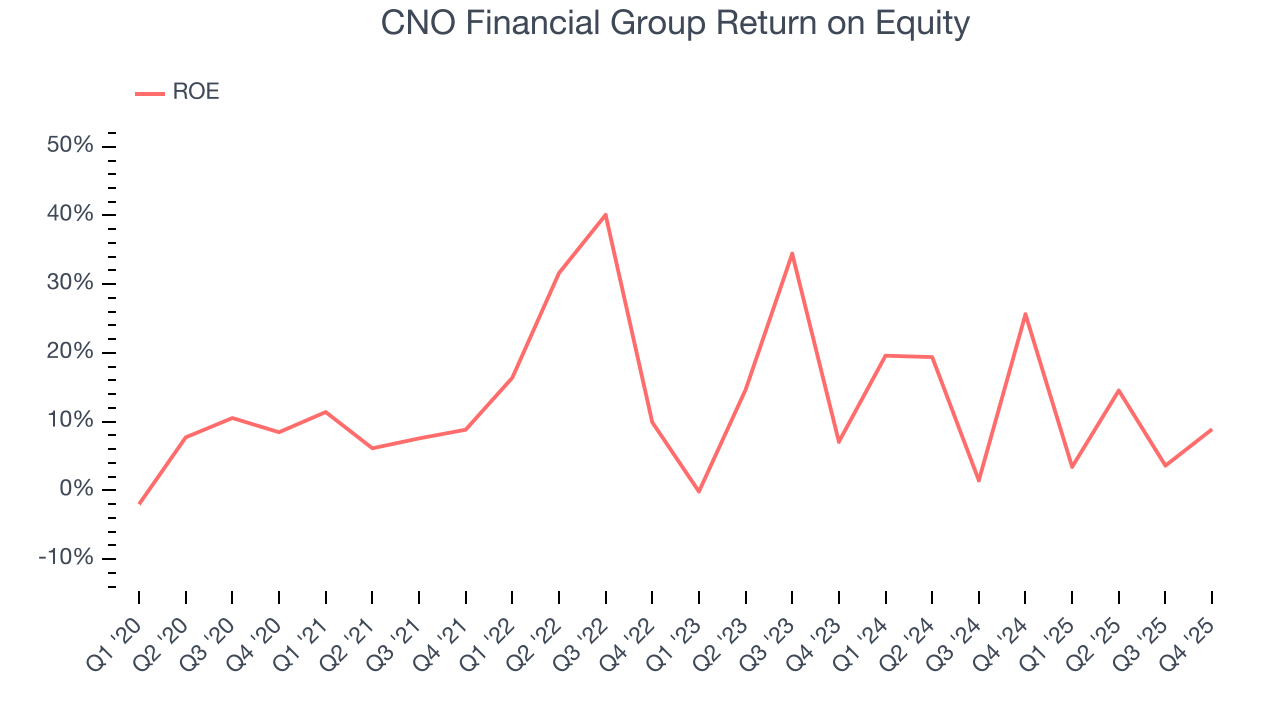
11. Return on Equity
Return on equity, or ROE, represents the ultimate measure of an insurer's effectiveness, quantifying how well it transforms shareholder investments into profits. Over the long term, insurance companies with robust ROE metrics typically deliver superior shareholder returns through a balanced approach to capital management.
Over the last five years, CNO Financial Group has averaged an ROE of 14.2%, healthy for a company operating in a sector where the average shakes out around 12.5% and those putting up 20%+ are greatly admired. This is a bright spot for CNO Financial Group.
12. Key Takeaways from CNO Financial Group’s Q4 Results
We were impressed by how significantly CNO Financial Group blew past analysts’ revenue expectations this quarter. On the other hand, its EPS missed and its book value per share fell short of Wall Street’s estimates. Overall, this was a weaker quarter. The stock traded up 2% to $43.16 immediately following the results.
13. Is Now The Time To Buy CNO Financial Group?
Before making an investment decision, investors should account for CNO Financial Group’s business fundamentals and valuation in addition to what happened in the latest quarter.
CNO Financial Group falls short of our quality standards. To kick things off, its revenue growth was weak over the last five years, and analysts expect its demand to deteriorate over the next 12 months. And while its projected EPS for the next year implies the company’s fundamentals will improve, the downside is its BVPS has declined over the last five years. On top of that, its net premiums earned growth was weak over the last five years.
CNO Financial Group’s P/B ratio based on the next 12 months is 1.4x. This valuation tells us a lot of optimism is priced in - we think there are better stocks to buy right now.
Wall Street analysts have a consensus one-year price target of $47.25 on the company (compared to the current share price of $43.16).