Crane (CR)
We’re not sold on Crane. Its declining sales show demand has evaporated, a red flag for investors seeking high-quality stocks.― StockStory Analyst Team
1. News

2. Summary
Why Crane Is Not Exciting
Based in Connecticut, Crane (NYSE:CR) is a diversified manufacturer of engineered industrial products, including fluid handling, and aerospace technologies.
- Sales tumbled by 3.9% annually over the last five years, showing market trends are working against its favor during this cycle
- Demand will likely be soft over the next 12 months as Wall Street’s estimates imply tepid growth of 5.7%
- A bright spot is that its offerings are difficult to replicate at scale and result in a stellar gross margin of 40%


Crane doesn’t pass our quality test. We’re on the lookout for more interesting opportunities.
Why There Are Better Opportunities Than Crane


Crane is trading at $208.50 per share, or 31.2x forward P/E. Not only is Crane’s multiple richer than most industrials peers, but it’s also expensive for its revenue characteristics.
There are stocks out there featuring similar valuation multiples with better fundamentals. We prefer to invest in those.
3. Crane (CR) Research Report: Q4 CY2025 Update
Industrial conglomerate Crane (NYSE:CR) reported revenue ahead of Wall Streets expectations in Q4 CY2025, with sales up 6.8% year on year to $581 million. Its non-GAAP profit of $1.53 per share was 8.2% above analysts’ consensus estimates.
Crane (CR) Q4 CY2025 Highlights:
- Revenue: $581 million vs analyst estimates of $570 million (6.8% year-on-year growth, 1.9% beat)
- Adjusted EPS: $1.53 vs analyst estimates of $1.41 (8.2% beat)
- Adjusted EBITDA: $124 million vs analyst estimates of $120.3 million (21.3% margin, 3.1% beat)
- Adjusted EPS guidance for the upcoming financial year 2026 is $6.65 at the midpoint, in line with analyst estimates
- Operating Margin: 17.5%, up from 15.8% in the same quarter last year
- Free Cash Flow Margin: 33.7%, similar to the same quarter last year
- Organic Revenue rose 5.4% year on year (beat)
- Market Capitalization: $11.76 billion
Company Overview
Based in Connecticut, Crane (NYSE:CR) is a diversified manufacturer of engineered industrial products, including fluid handling, and aerospace technologies.
Crane was founded in 1855 in Chicago, Illinois, originally starting as a brass and bell foundry. The company initially focused on manufacturing plumbing supplies, including valves and pipe fittings, reflecting the growing demand for water infrastructure in the expanding American cities during that era. As the company grew, it broadened its product range and ventured into different sectors, including heating, piping, and water systems, helping establish the foundation for modern plumbing and industrial fluid handling.
Throughout the 20th century, the company expanded its offerings into new areas such as aerospace, electronics, and engineered materials, further diversifying its operations and solidifying its presence in these industries. The company consistently leveraged technological advancements and aggressive strategic acquisitions to enhance and increase its product portfolio.
Today, Crane is a diversified manufacturer of highly engineered industrial products, serving a variety of sectors including aerospace, electronics, fluid handling technologies, and engineered materials. Its diverse product range includes brake control systems for both commercial and military aerospace markets, industrial fluid handling equipment, and fiberglass-reinforced plastic panels primarily used in recreational vehicles.
The company's revenue streams are supported by product sales and enhanced by recurring revenue from aftermarket services, maintenance contracts, and long-term leases, which are particularly significant in its aerospace and fluid handling categories. Such contracts typically include regular inspections, repairs, part replacements, and overall system checks, which are crucial for meeting safety standards and extending the lifespan of components.
Crane maintains a strategic approach to growth through targeted acquisitions, aiming to integrate companies into its operations and reinforce its competitive position. A recent example of this strategy is the acquisition of Vian Enterprises, which Crane completed for $103 million. Vian, a global leader in multi-stage lubrication pumps and system components technology, is critical for aerospace and defense applications. This acquisition not only expanded Crane’s Aerospace & Electronics segment but also further secured its role as a supplier of essential components for commercial and military aircrafts.
4. General Industrial Machinery
Automation that increases efficiency and connected equipment that collects analyzable data have been trending, creating new demand for general industrial machinery companies. Those who innovate and create digitized solutions can spur sales and speed up replacement cycles, but all general industrial machinery companies are still at the whim of economic cycles. Consumer spending and interest rates, for example, can greatly impact the industrial production that drives demand for these companies’ offerings.
Competitors offering similar products include Flowserve (NYSE:FLS), Emerson Electric (NYSE:EMR), and ITT (NYSE:ITT).
5. Revenue Growth
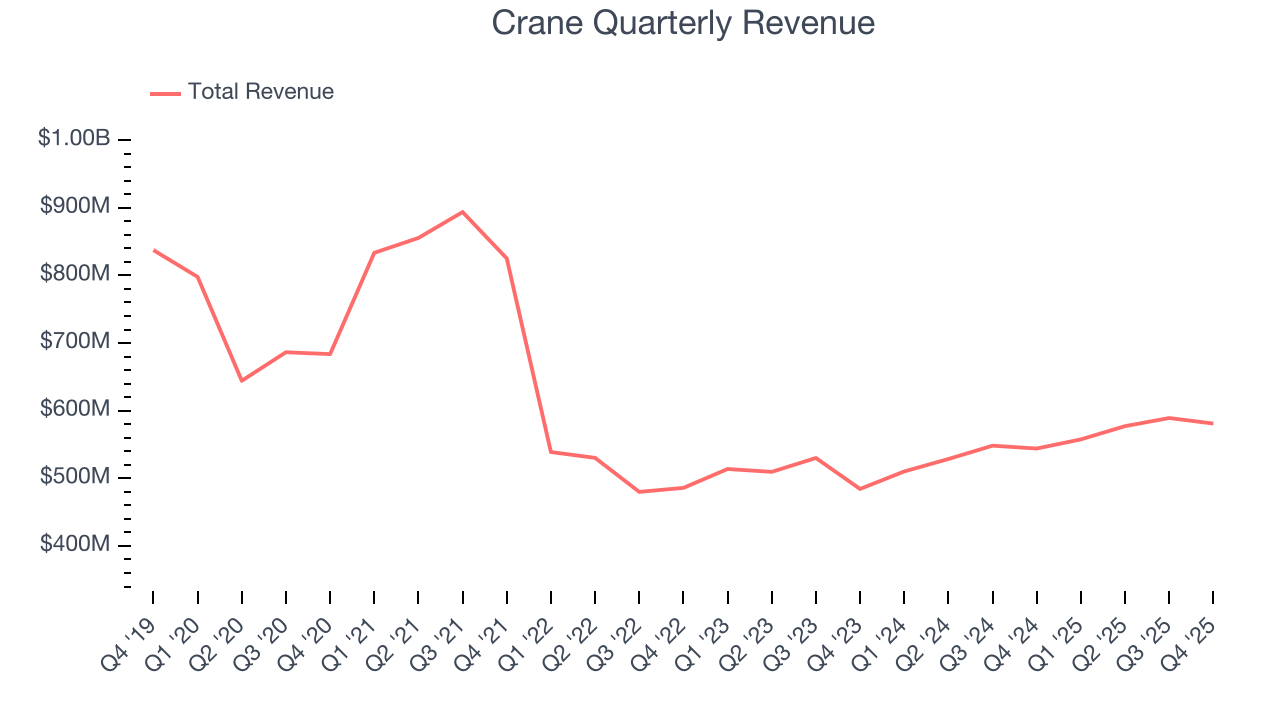
A company’s long-term sales performance is one signal of its overall quality. Any business can have short-term success, but a top-tier one grows for years. Crane’s demand was weak over the last five years as its sales fell at a 3.9% annual rate. This was below our standards and is a rough starting point for our analysis.
Long-term growth is the most important, but within industrials, a half-decade historical view may miss new industry trends or demand cycles. Crane’s annualized revenue growth of 6.4% over the last two years is above its five-year trend, but we were still disappointed by the results. 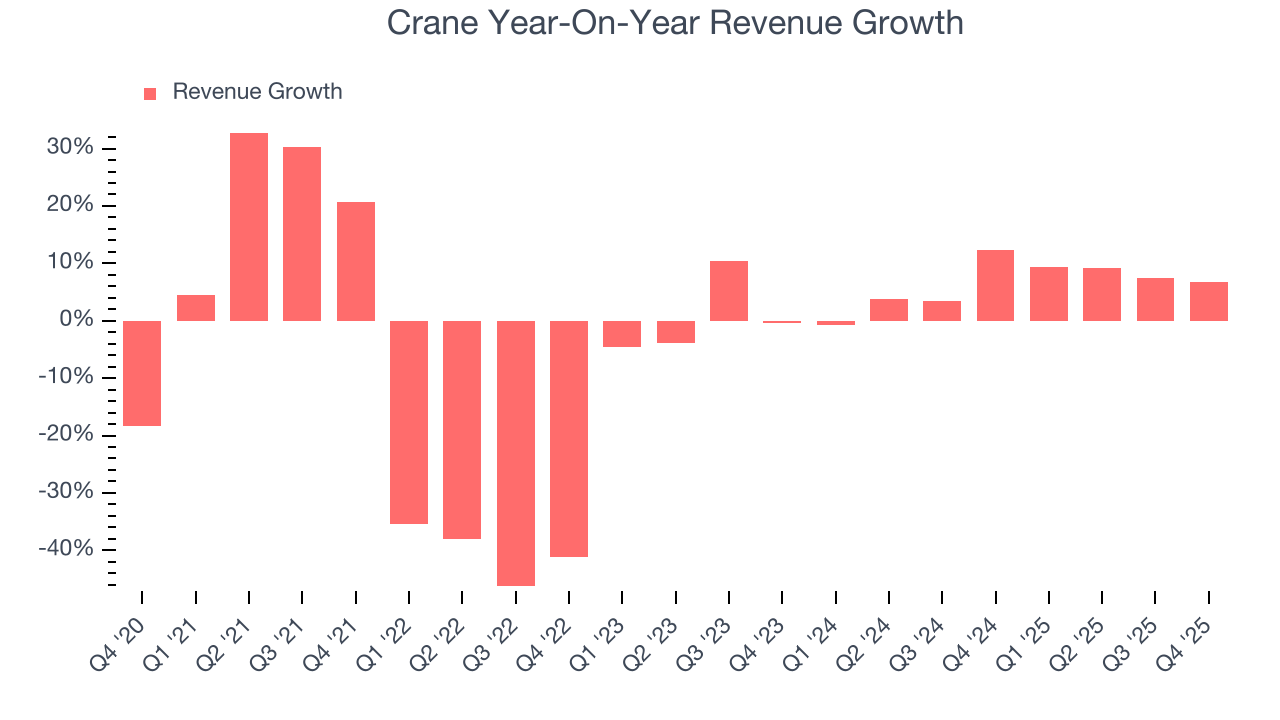
We can better understand the company’s sales dynamics by analyzing its organic revenue, which strips out one-time events like acquisitions and currency fluctuations that don’t accurately reflect its fundamentals. Over the last two years, Crane’s organic revenue averaged 6.6% year-on-year growth. Because this number aligns with its two-year revenue growth, we can see the company’s core operations (not acquisitions and divestitures) drove most of its results. 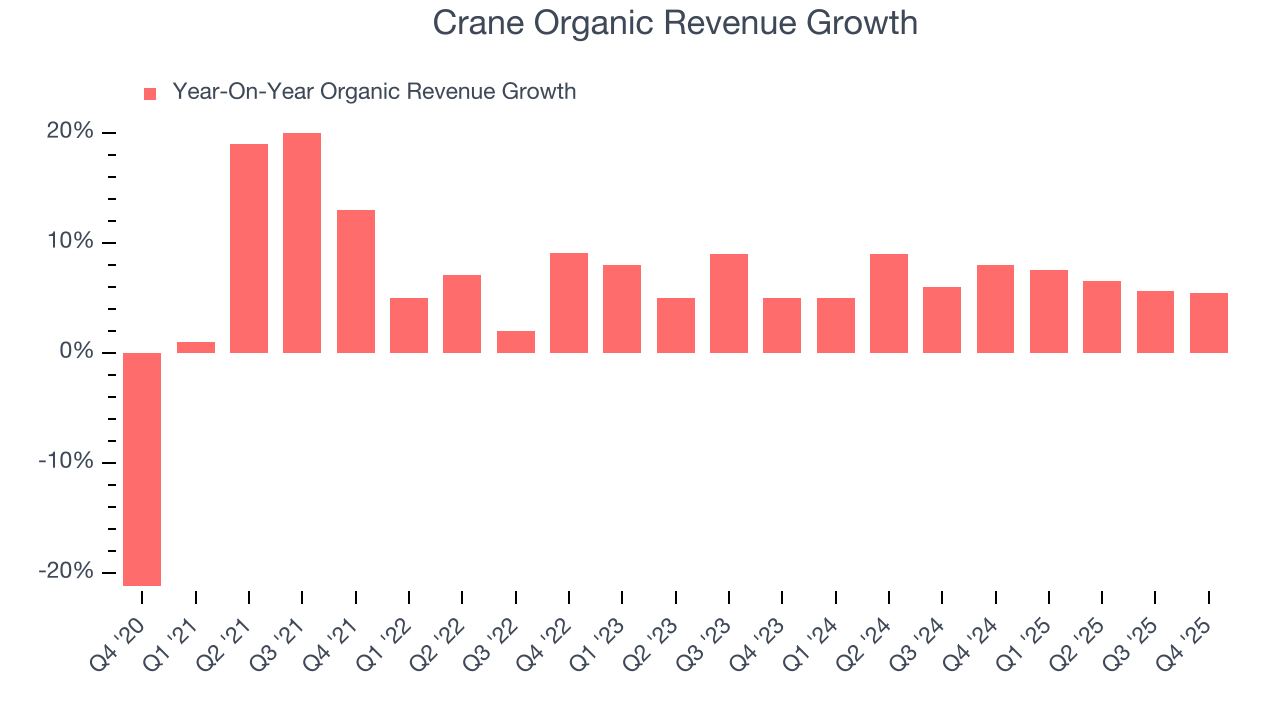
This quarter, Crane reported year-on-year revenue growth of 6.8%, and its $581 million of revenue exceeded Wall Street’s estimates by 1.9%.
Looking ahead, sell-side analysts expect revenue to grow 16.3% over the next 12 months, an improvement versus the last two years. This projection is eye-popping and indicates its newer products and services will spur better top-line performance.
6. Gross Margin & Pricing Power
Crane’s unit economics are great compared to the broader industrials sector and signal that it enjoys product differentiation through quality or brand. As you can see below, it averaged an excellent 40% gross margin over the last five years. That means Crane only paid its suppliers $59.98 for every $100 in revenue. 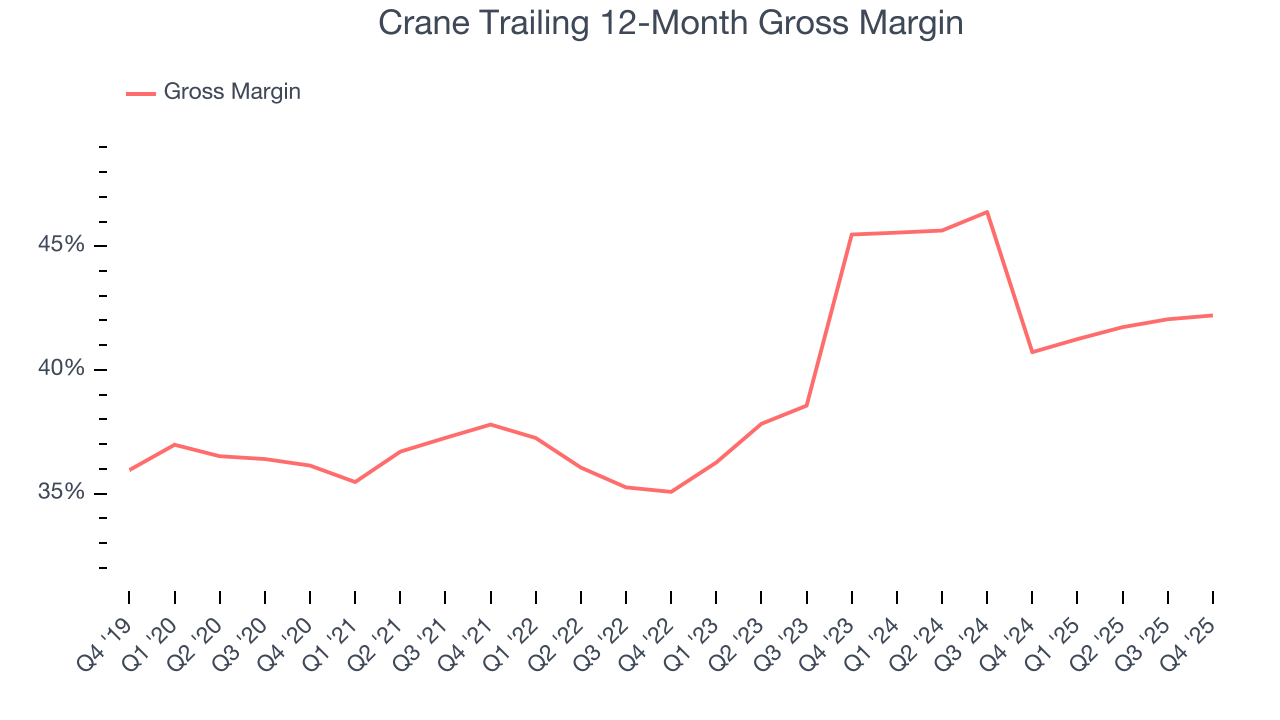
Crane produced a 41.6% gross profit margin in Q4, in line with the same quarter last year. Zooming out, Crane’s full-year margin has been trending up over the past 12 months, increasing by 1.5 percentage points. If this move continues, it could suggest better unit economics due to more leverage from its growing sales on the fixed portion of its cost of goods sold (such as manufacturing expenses).
7. Operating Margin
Crane has been an efficient company over the last five years. It was one of the more profitable businesses in the industrials sector, boasting an average operating margin of 13.7%. This result isn’t surprising as its high gross margin gives it a favorable starting point.
Looking at the trend in its profitability, Crane’s operating margin rose by 3.1 percentage points over the last five years, showing its efficiency has improved.
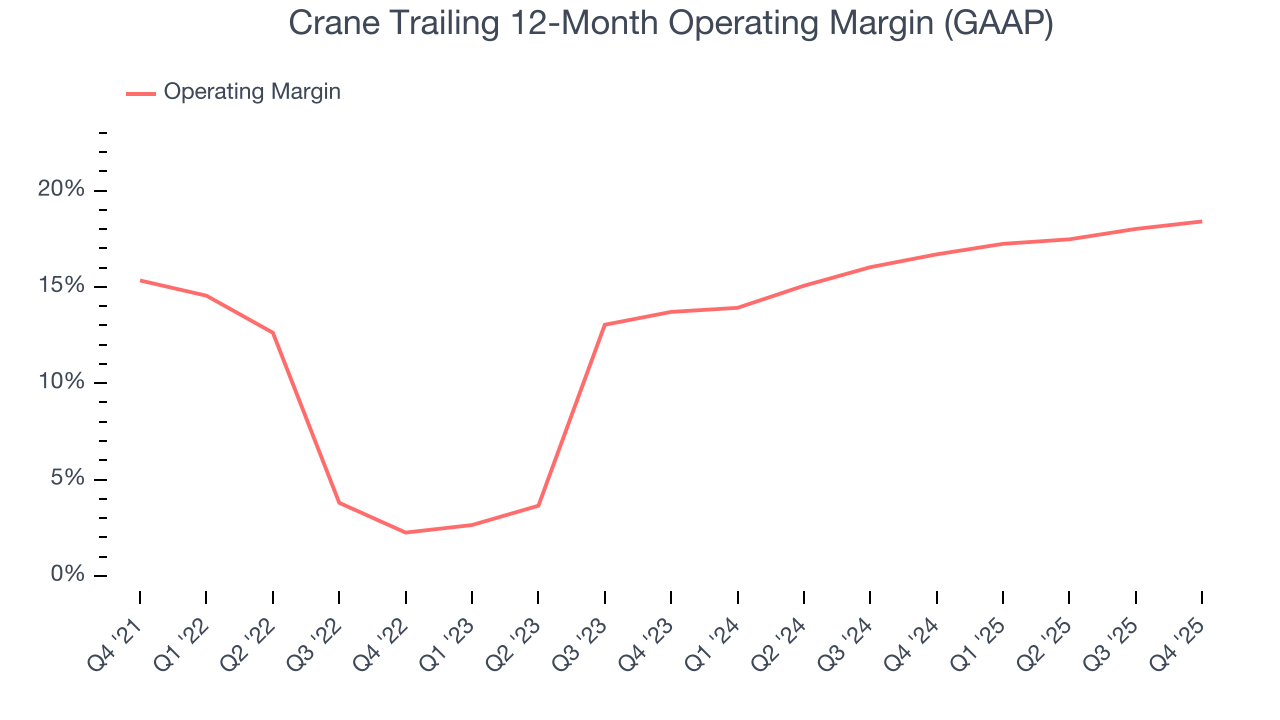
In Q4, Crane generated an operating margin profit margin of 17.5%, up 1.7 percentage points year on year. The increase was encouraging, and because its operating margin rose more than its gross margin, we can infer it was more efficient with expenses such as marketing, R&D, and administrative overhead.
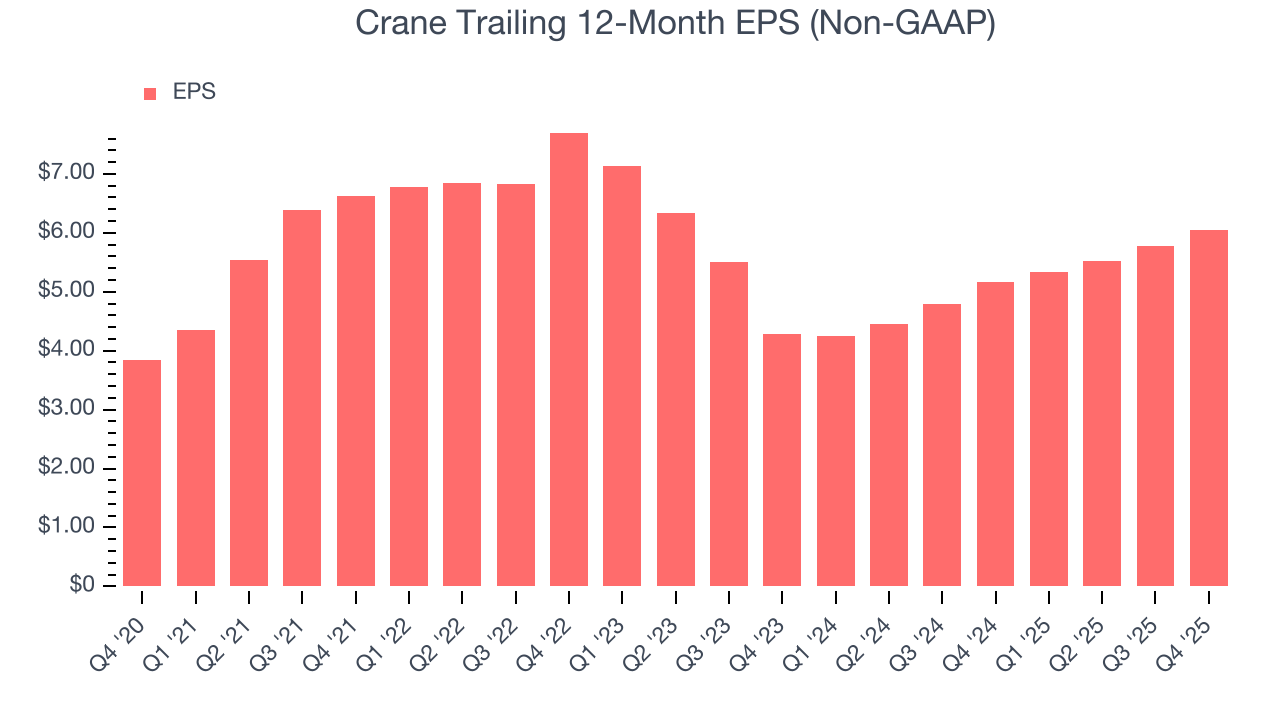
8. Earnings Per Share
We track the long-term change in earnings per share (EPS) for the same reason as long-term revenue growth. Compared to revenue, however, EPS highlights whether a company’s growth is profitable.
Crane’s EPS grew at a decent 9.5% compounded annual growth rate over the last five years, higher than its 3.9% annualized revenue declines. This tells us management adapted its cost structure in response to a challenging demand environment.
Diving into the nuances of Crane’s earnings can give us a better understanding of its performance. As we mentioned earlier, Crane’s operating margin expanded by 3.1 percentage points over the last five years. This was the most relevant factor (aside from the revenue impact) behind its higher earnings; interest expenses and taxes can also affect EPS but don’t tell us as much about a company’s fundamentals.
Like with revenue, we analyze EPS over a more recent period because it can provide insight into an emerging theme or development for the business.
For Crane, its two-year annual EPS growth of 18.9% was higher than its five-year trend. This acceleration made it one of the faster-growing industrials companies in recent history.
In Q4, Crane reported adjusted EPS of $1.53, up from $1.26 in the same quarter last year. This print beat analysts’ estimates by 8.2%. Over the next 12 months, Wall Street expects Crane’s full-year EPS of $6.05 to grow 8.1%.
9. Cash Is King
Although earnings are undoubtedly valuable for assessing company performance, we believe cash is king because you can’t use accounting profits to pay the bills.
Crane has shown decent cash profitability, giving it some flexibility to reinvest or return capital to investors. The company’s free cash flow margin averaged 7.2% over the last five years, slightly better than the broader industrials sector.
Taking a step back, we can see that Crane’s margin expanded by 1.8 percentage points during that time. This is encouraging because it gives the company more optionality.
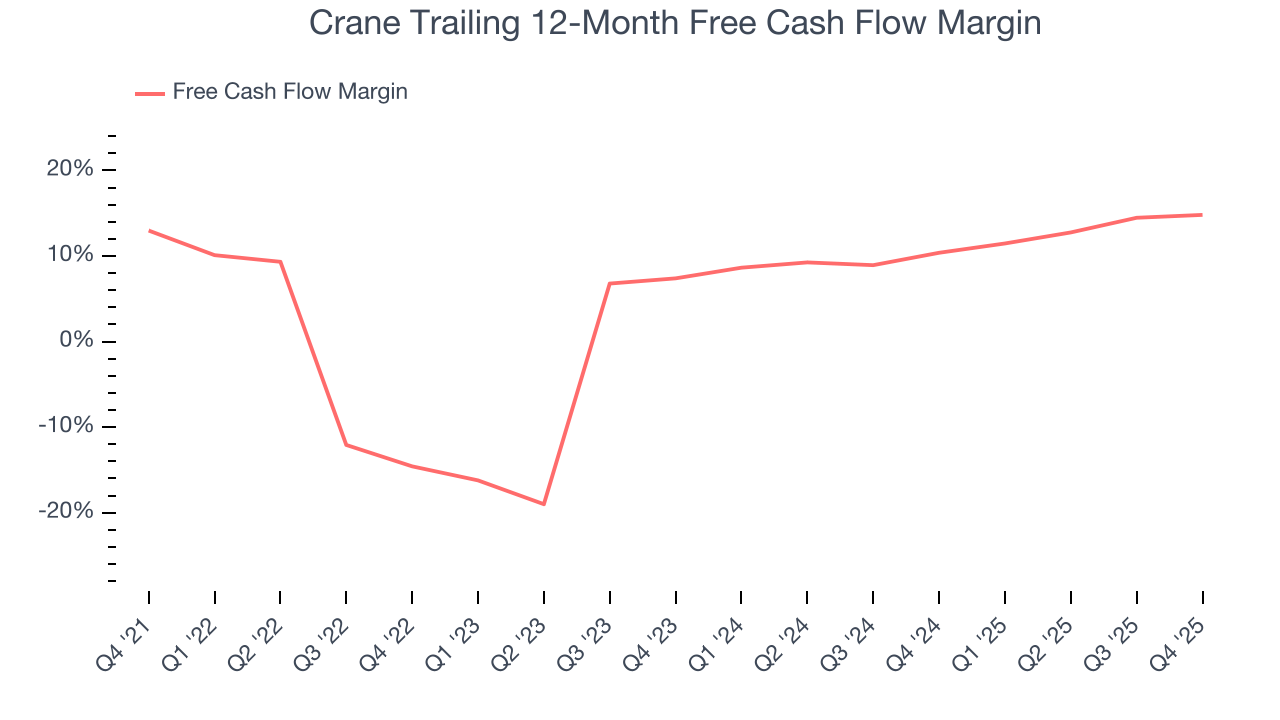
Crane’s free cash flow clocked in at $196 million in Q4, equivalent to a 33.7% margin. This cash profitability was in line with the comparable period last year and above its five-year average.
10. Return on Invested Capital (ROIC)
EPS and free cash flow tell us whether a company was profitable while growing its revenue. But was it capital-efficient? A company’s ROIC explains this by showing how much operating profit it makes compared to the money it has raised (debt and equity).
Although Crane hasn’t been the highest-quality company lately because of its poor top-line performance, it historically found a few growth initiatives that worked. Its five-year average ROIC was 12.9%, higher than most industrials businesses.
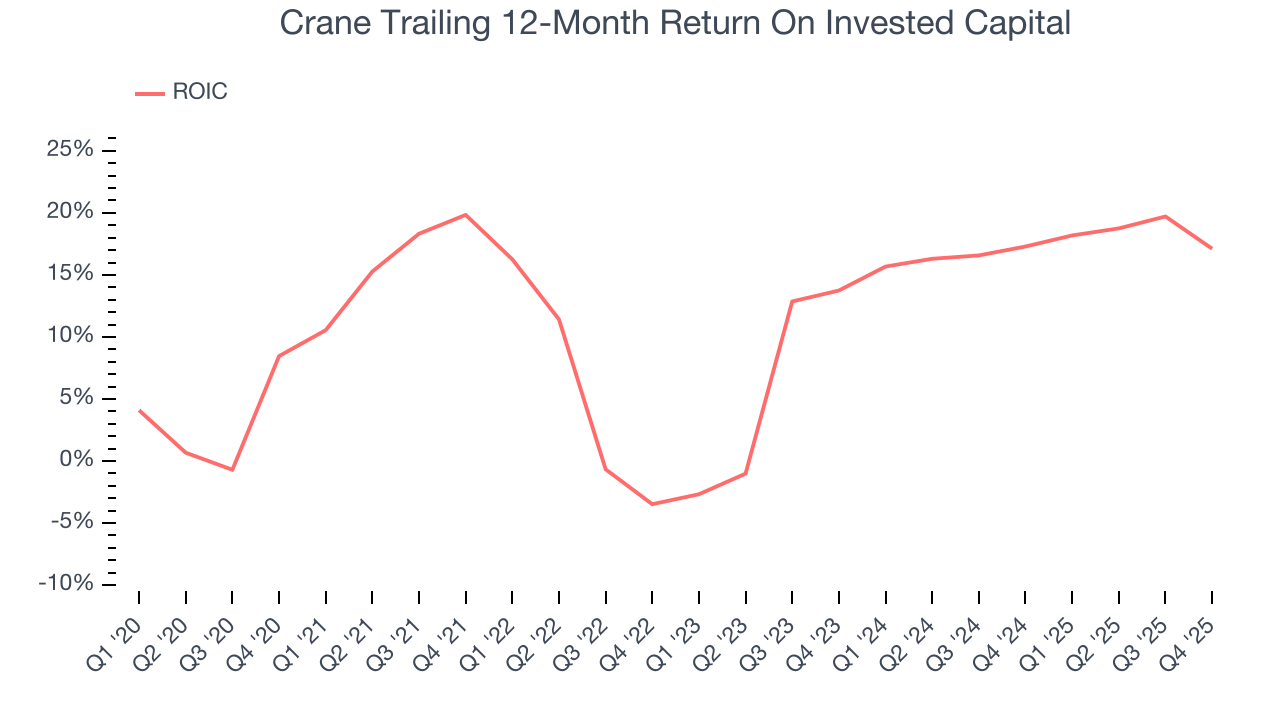
We like to invest in businesses with high returns, but the trend in a company’s ROIC is what often surprises the market and moves the stock price. Crane’s ROIC has increased over the last few years. This is a good sign, and if its returns keep rising, there’s a chance it could evolve into an investable business.
11. Balance Sheet Assessment
One of the best ways to mitigate bankruptcy risk is to hold more cash than debt.
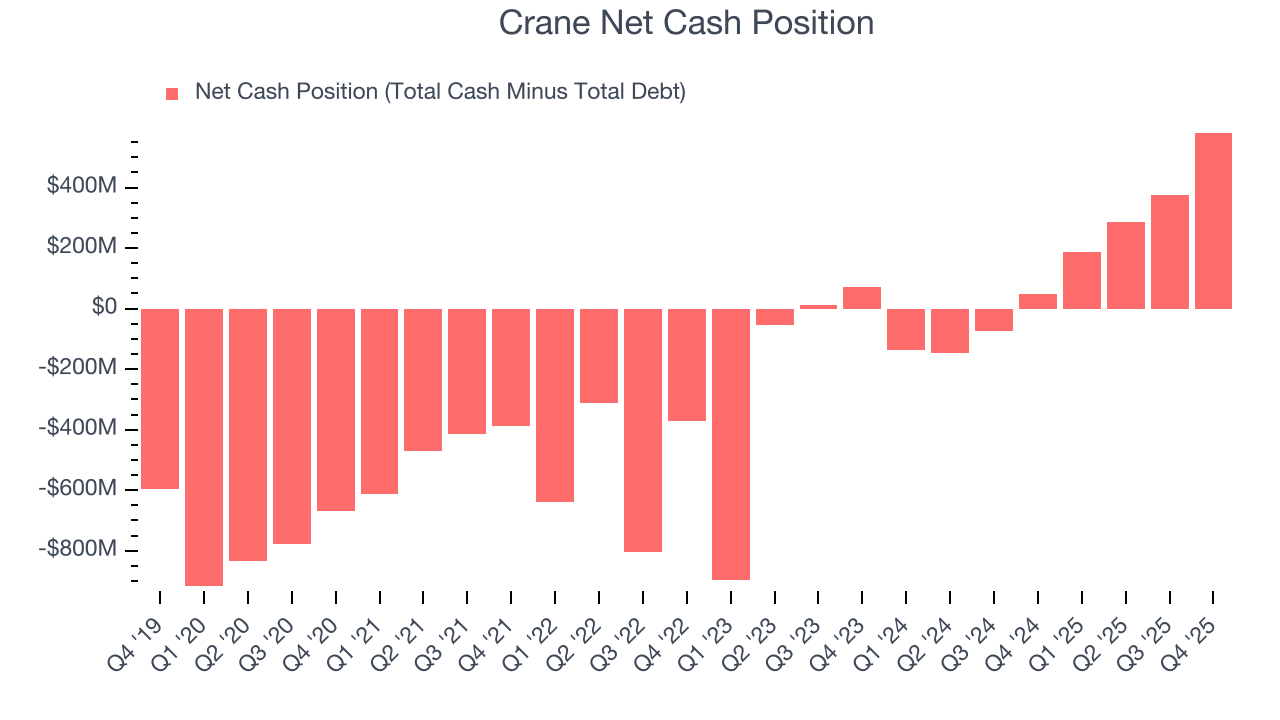
Crane is a profitable, well-capitalized company with $1.73 billion of cash and $1.15 billion of debt on its balance sheet. This $581.6 million net cash position is 4.9% of its market cap and gives it the freedom to borrow money, return capital to shareholders, or invest in growth initiatives. Leverage is not an issue here.
12. Key Takeaways from Crane’s Q4 Results
We enjoyed seeing Crane beat analysts’ organic revenue expectations this quarter. We were also glad its revenue outperformed Wall Street’s estimates. Overall, we think this was a decent quarter with some key metrics above expectations. The stock remained flat at $210.25 immediately after reporting.
13. Is Now The Time To Buy Crane?
Updated: January 26, 2026 at 10:23 PM EST
We think that the latest earnings result is only one piece of the bigger puzzle. If you’re deciding whether to own Crane, you should also grasp the company’s longer-term business quality and valuation.
Crane doesn’t top our investment wishlist, but we understand that it’s not a bad business. Although its revenue has declined over the last five years, its growth over the next 12 months is expected to be higher. And while Crane’s organic revenue growth has disappointed, its rising returns show management's prior bets are paying off.
Crane’s P/E ratio based on the next 12 months is 31.2x. Investors with a higher risk tolerance might like the company, but we think the potential downside is too great. We're pretty confident there are more exciting stocks to buy at the moment.
Wall Street analysts have a consensus one-year price target of $213.17 on the company (compared to the current share price of $208.50).