
Corebridge Financial (CRBG)
We’re skeptical of Corebridge Financial. Its revenue growth has been weak and its profitability has caved, showing it’s struggling to adapt.― StockStory Analyst Team
1. News


2. Summary
Why We Think Corebridge Financial Will Underperform
Spun off from insurance giant AIG in 2022 to focus on the growing retirement market, Corebridge Financial (NYSE:CRBG) provides retirement solutions, annuities, life insurance, and institutional risk management products in the United States.
- Forecasted revenue decline of 7.8% for the upcoming 12 months implies demand will fall even further
- Costs have risen faster than its revenue over the last four years, causing its pre-tax profit margin to decline by 22.4 percentage points


Corebridge Financial’s quality is not up to our standards. We’re on the lookout for more interesting opportunities.
Why There Are Better Opportunities Than Corebridge Financial


Corebridge Financial is trading at $30.06 per share, or 1.2x forward P/B. This multiple is lower than most insurance companies, but for good reason.
Cheap stocks can look like great bargains at first glance, but you often get what you pay for. These mediocre businesses often have less earnings power, meaning there is more reliance on a re-rating to generate good returns - an unlikely scenario for low-quality companies.
3. Corebridge Financial (CRBG) Research Report: Q3 CY2025 Update
Retirement solutions provider Corebridge Financial (NYSE:CRBG) reported Q3 CY2025 results topping the market’s revenue expectations, but sales were flat year on year at $4.19 billion. Its non-GAAP profit of $0.96 per share was 11.4% below analysts’ consensus estimates.
Corebridge Financial (CRBG) Q3 CY2025 Highlights:
Company Overview
Spun off from insurance giant AIG in 2022 to focus on the growing retirement market, Corebridge Financial (NYSE:CRBG) provides retirement solutions, annuities, life insurance, and institutional risk management products in the United States.
Corebridge operates through four main business segments that serve different markets and customer needs. The Individual Retirement segment offers various annuity products including fixed, fixed index, registered index linked, and variable annuities that provide guaranteed income, death benefits, and investment growth potential. These products are distributed through a network of approximately 490 third-party firms including banks, broker-dealers, and independent agents.
The Group Retirement segment serves employees of tax-exempt and public sector organizations such as K-12 schools, higher education institutions, healthcare providers, and government employers. It provides both in-plan products like recordkeeping platforms and group annuities, as well as out-of-plan solutions including IRAs and advisory services. The company's employee financial advisors work directly with individuals to provide retirement planning guidance and comprehensive financial planning.
The Life Insurance segment focuses on term life, index universal life, and whole life insurance products. Corebridge has strategically shifted away from interest rate sensitive products like guaranteed universal life insurance toward products with better margins. It distributes these products through independent channels and its direct-to-consumer platform, targeting demographics from middle market to high net worth individuals.
The Institutional Markets segment offers sophisticated risk management solutions to large institutional clients, including pension risk transfer services, guaranteed investment contracts, structured settlement annuities, and stable value wrap contracts. These specialized products help corporations manage pension obligations, provide long-term payment streams for legal settlements, and offer stable returns for retirement funds.
Corebridge benefits from its strategic partnership with Blackstone, which helps the company source attractive fixed-income assets. The company's investment management capabilities are integral to its business model, as it manages general and separate account assets across various markets to produce consistent returns while minimizing earnings volatility.
4. Life Insurance
Life insurance companies collect premiums from policyholders in exchange for providing a future death benefit or retirement income stream. Interest rates matter for the sector (and make it cyclical), with higher rates allowing insurers to reinvest their fixed-income portfolios at more attractive yields and vice versa. Additionally, favorable demographic shifts, such as an aging population, are driving strong demand for retirement products while AI and data analytics offer significant opportunities to improve underwriting accuracy and operational efficiency. Conversely, the industry faces headwinds from persistent competition from agile insurtechs that threaten traditional distribution models.
Corebridge Financial competes with major retirement and insurance providers including Prudential Financial (NYSE:PRU), Lincoln National (NYSE:LNC), Equitable Holdings (NYSE:EQH), and Brighthouse Financial (NASDAQ:BHF). In the institutional markets segment, it also faces competition from MetLife (NYSE:MET) and Principal Financial Group (NASDAQ:PFG).
5. Revenue Growth
In general, insurance companies earn revenue from three primary sources. The first is the core insurance business itself, often called underwriting and represented in the income statement as premiums earned. The second source is investment income from investing the “float” (premiums collected upfront not yet paid out as claims) in assets such as fixed-income assets and equities. The third is fees from various sources such as policy administration, annuities, or other value-added services. Unfortunately, Corebridge Financial’s 1.5% annualized revenue growth over the last five years was weak. This was below our standards and is a rough starting point for our analysis.
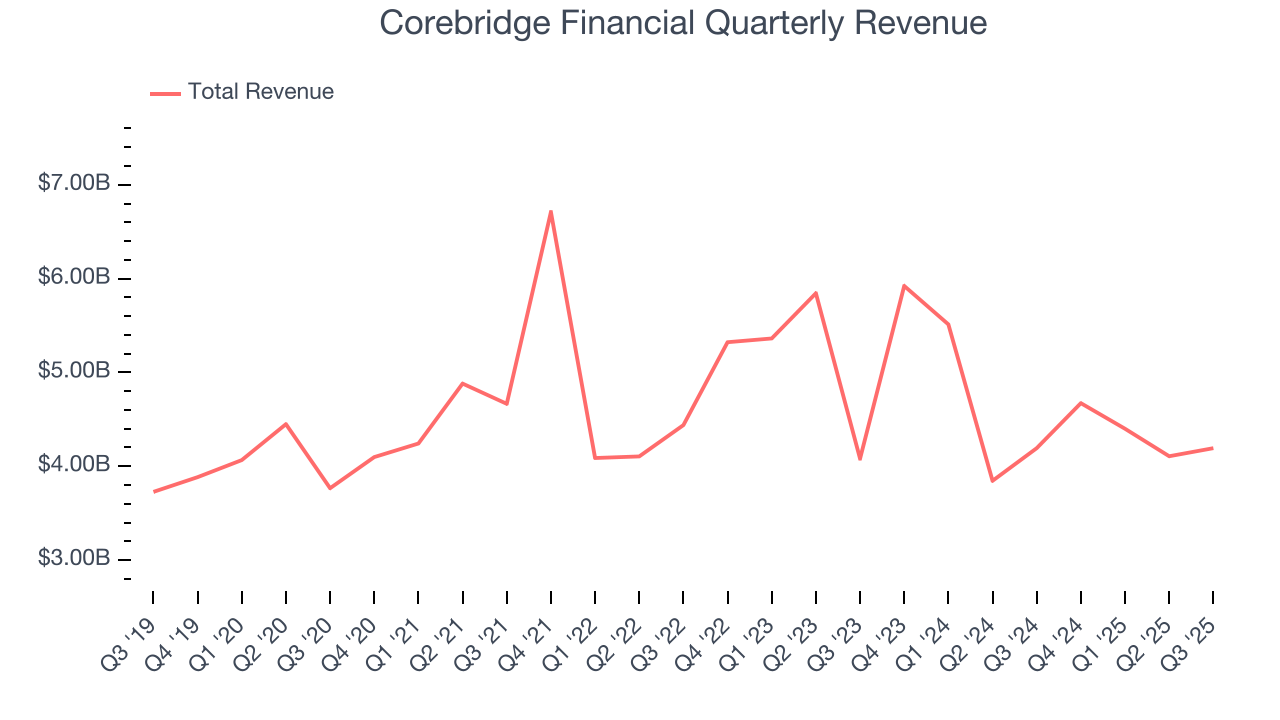
We at StockStory place the most emphasis on long-term growth, but within financials, a half-decade historical view may miss recent interest rate changes, market returns, and industry trends. Corebridge Financial’s performance shows it grew in the past but relinquished its gains over the last two years, as its revenue fell by 8.2% annually. 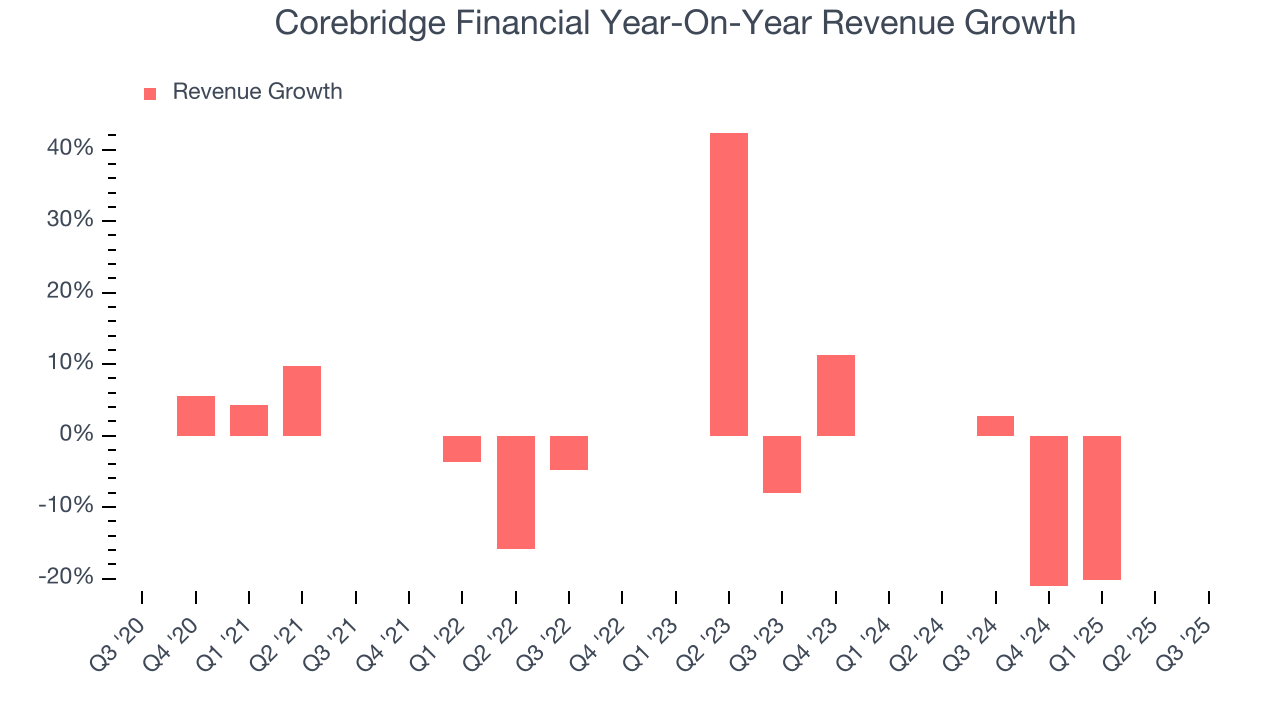 Note: Quarters not shown were determined to be outliers, impacted by outsized investment gains/losses that are not indicative of the recurring fundamentals of the business.
This quarter, Corebridge Financial’s $4.19 billion of revenue was flat year on year but beat Wall Street’s estimates by 11.6%.
Net premiums earned made up 43.4% of the company’s total revenue during the last five years, meaning Corebridge Financial’s growth drivers strike a balance between insurance and non-insurance activities.
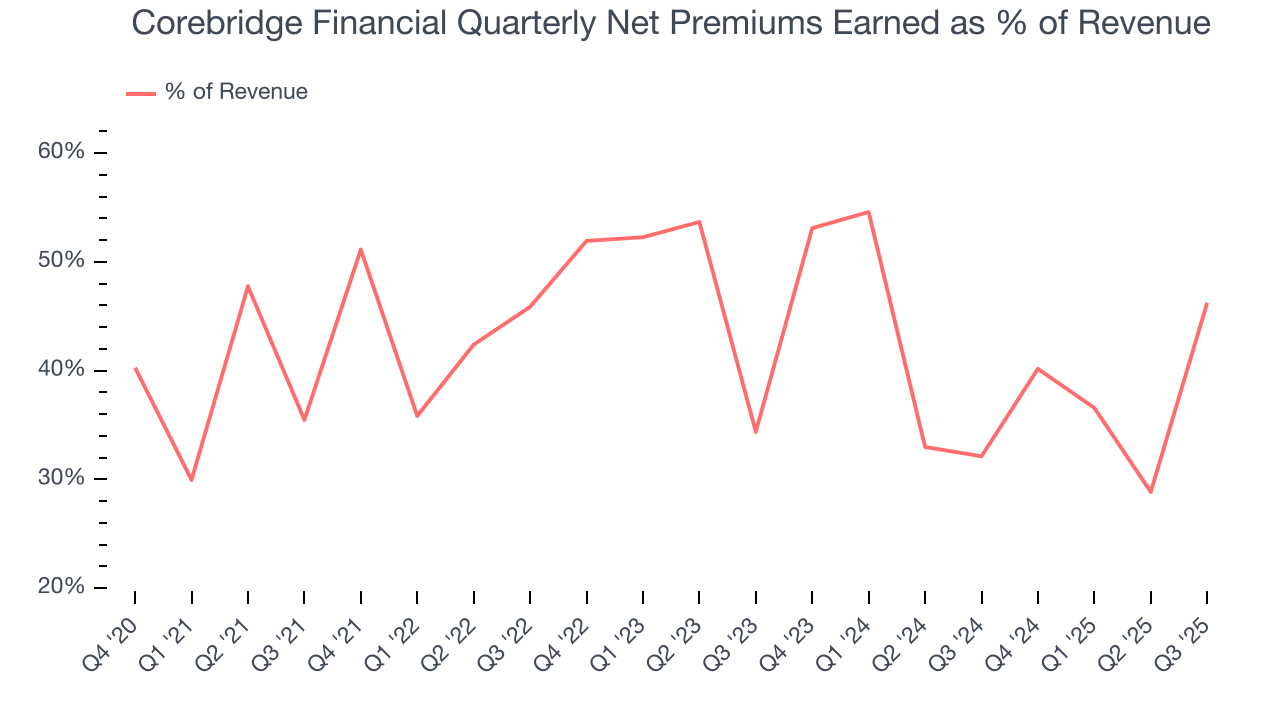
Markets consistently prioritize net premiums earned growth over investment and fee income, recognizing its superior quality as a core indicator of the company’s underwriting success and market penetration.
6. Net Premiums Earned
Insurers sell policies then use reinsurance (insurance for insurance companies) to protect themselves from large losses. Net premiums earned are therefore what's collected from selling policies less what’s paid to reinsurers as a risk mitigation tool.
Corebridge Financial’s net premiums earned has declined by 1.1% annually over the last four years, much worse than the broader insurance industry.
When analyzing Corebridge Financial’s net premiums earned over the last two years, we can see its woes have continued as income dropped by 19.1% annually. Since two-year net premiums earned underperformed total revenue over this period, it’s implied that insurance policies were a detractor of consolidated growth.
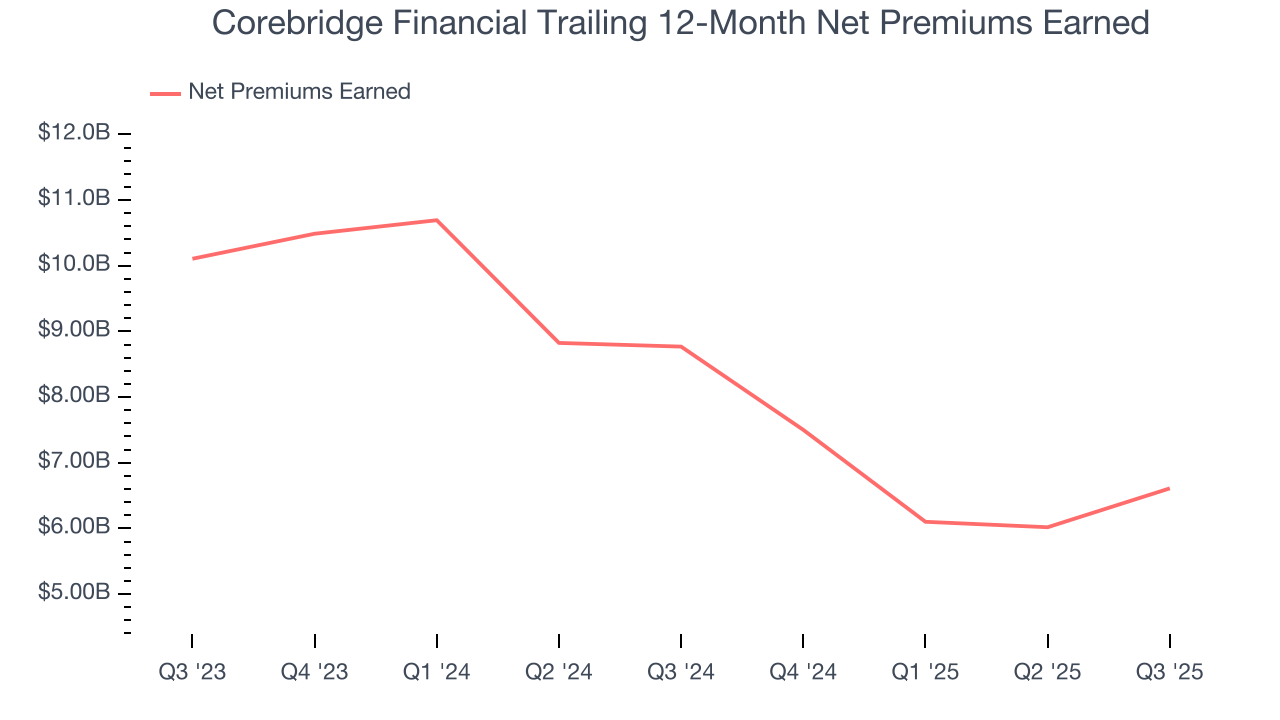
Corebridge Financial’s net premiums earned came in at $1.94 billion this quarter, up a hearty 43.9% year on year.
7. Pre-Tax Profit Margin
Revenue growth is one major determinant of business quality, and the efficiency of operations is another. For insurance companies, we look at pre-tax profit rather than the operating margin that defines sectors such as consumer, tech, and industrials.
Insurance companies are balance sheet businesses, where assets and liabilities define the economics. Interest income and expense should therefore be factored into the definition of profit but taxes - which are largely out of a company’s control - should not. This is pre-tax profit by definition.
Over the last four years, Corebridge Financial’s pre-tax profit margin has risen by 16.2 percentage points, going from 29.9% to 13.7%. Luckily, it seems the company has recently taken steps to address its expense base as its pre-tax profit margin expanded by 2.1 percentage points on a two-year basis.
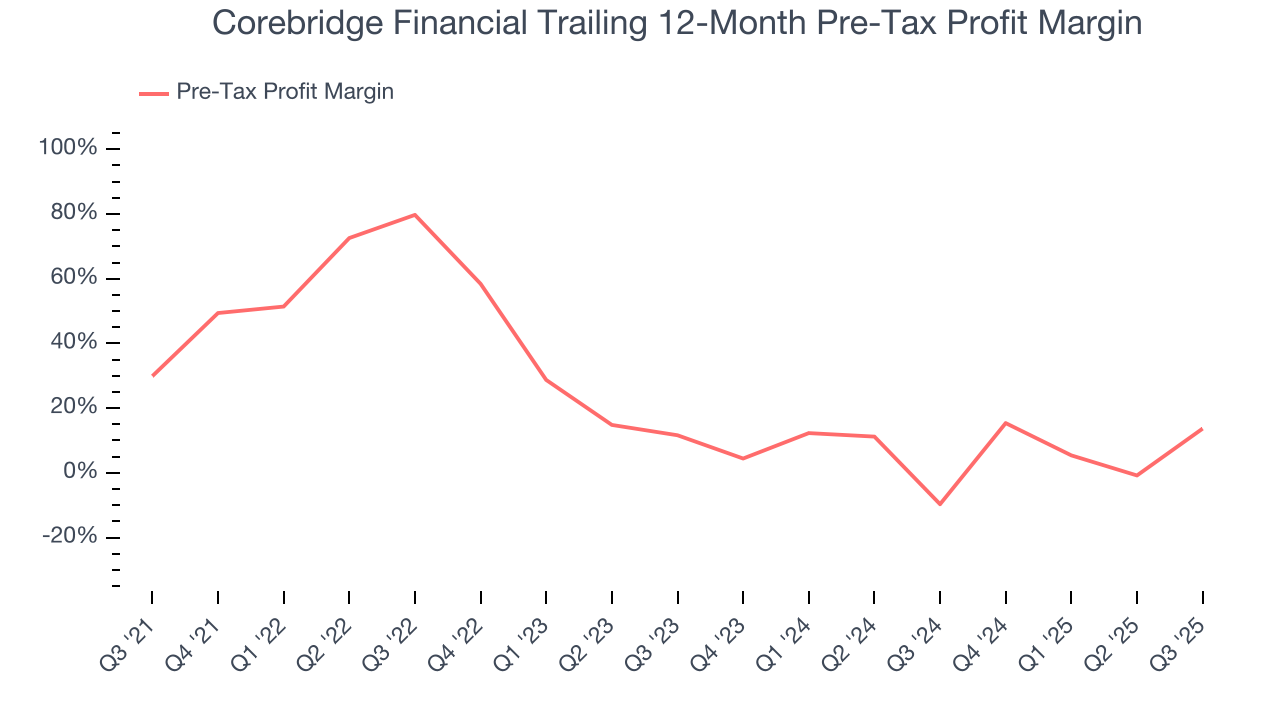
In Q3, Corebridge Financial’s pre-tax profit margin was 22%. This result was 60 percentage points better than the same quarter last year.
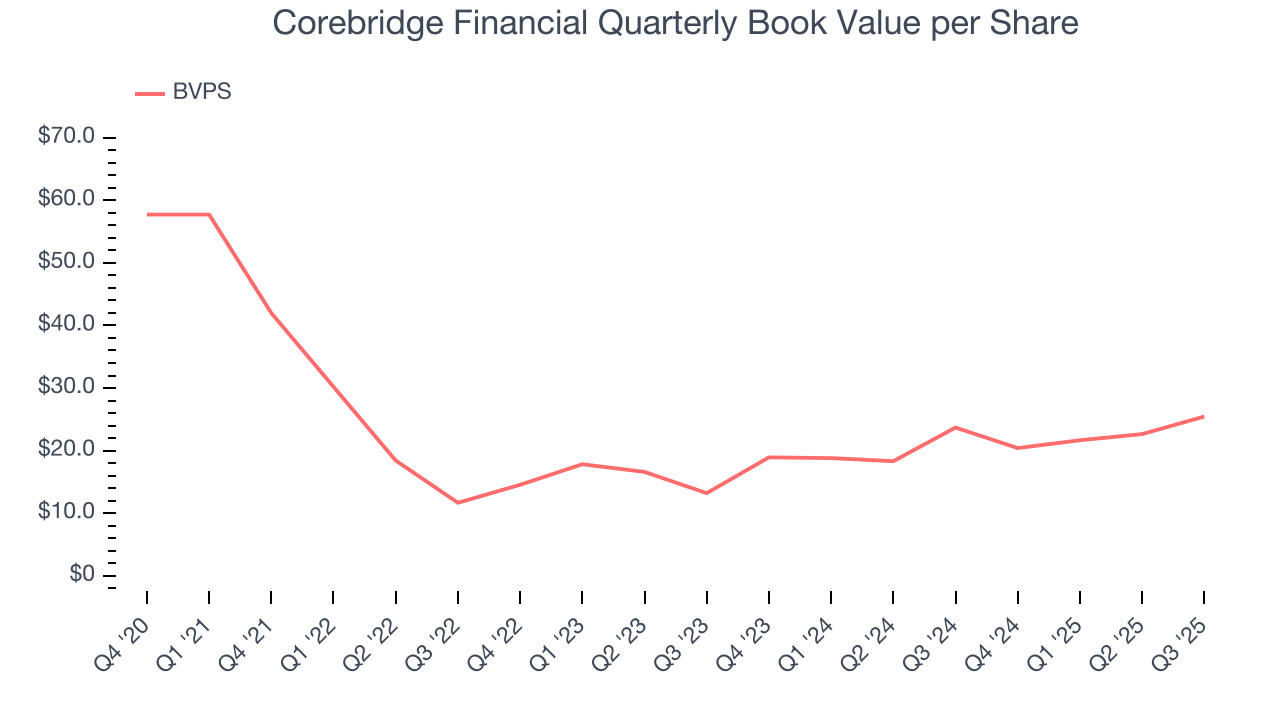
8. Book Value Per Share (BVPS)
Insurance companies are balance sheet businesses, collecting premiums upfront and paying out claims over time. The float – premiums collected but not yet paid out – are invested, creating an asset base supported by a liability structure. Book value captures this dynamic by measuring:
- Assets (investment portfolio, cash, reinsurance recoverables) - liabilities (claim reserves, debt, future policy benefits)
BVPS is essentially the residual value for shareholders.
We therefore consider BVPS very important to track for insurers and a metric that sheds light on business quality because it reflects long-term capital growth and is harder to manipulate than more commonly-used metrics like EPS.
Fortunately for investors, Corebridge Financial’s BVPS grew at an incredible 38.8% annual clip over the last two years.
9. Balance Sheet Assessment
The debt-to-equity ratio is a widely used measure to assess a company's balance sheet health. A higher ratio means that a business aggressively financed its growth with debt. This can result in higher earnings (if the borrowed funds are invested profitably) but also increases risk.
If debt levels are too high, there could be difficulties in meeting obligations, especially during economic downturns or periods of rising interest rates if the debt has variable-rate payments.
Corebridge Financial has no debt, so leverage is not an issue here.
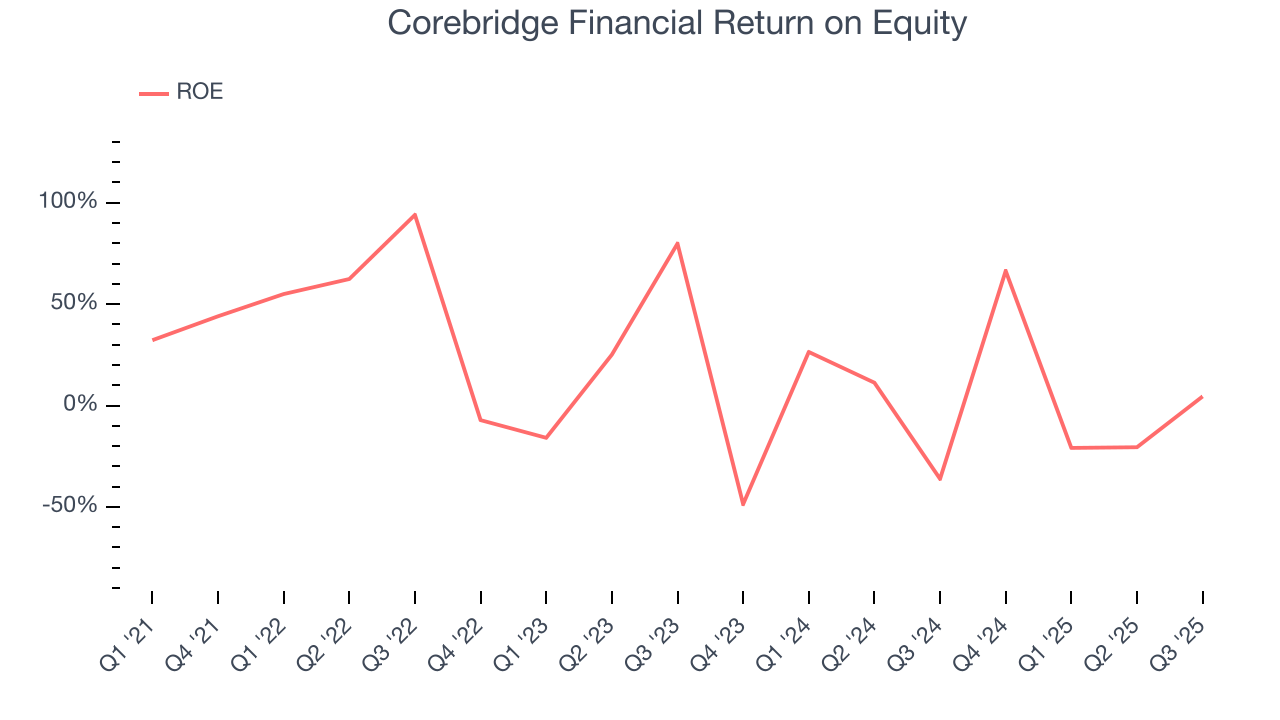
10. Return on Equity
Return on equity, or ROE, represents the ultimate measure of an insurer's effectiveness, quantifying how well it transforms shareholder investments into profits. Over the long term, insurance companies with robust ROE metrics typically deliver superior shareholder returns through a balanced approach to capital management.
Over the last five years, Corebridge Financial has averaged an ROE of 20.7%, exceptional for a company operating in a sector where the average shakes out around 12.5% and those putting up 20%+ are greatly admired. This is a bright spot for Corebridge Financial.
11. Key Takeaways from Corebridge Financial’s Q3 Results
We were impressed by how significantly Corebridge Financial blew past analysts’ revenue expectations this quarter. On the other hand, its EPS missed. Overall, this was a mixed quarter. The stock remained flat at $30.75 immediately following the results.
12. Is Now The Time To Buy Corebridge Financial?
Updated: January 24, 2026 at 11:04 PM EST
The latest quarterly earnings matters, sure, but we actually think longer-term fundamentals and valuation matter more. Investors should consider all these pieces before deciding whether or not to invest in Corebridge Financial.
Corebridge Financial isn’t a terrible business, but it isn’t one of our picks. To kick things off, its revenue growth was weak over the last five years, and analysts expect its demand to deteriorate over the next 12 months. And while its BVPS growth was exceptional over the last two years, the downside is its declining pre-tax profit margin shows the business has become less efficient. On top of that, its net premiums earned growth was weak over the last four years.
Corebridge Financial’s P/B ratio based on the next 12 months is 1.2x. While this valuation is fair, the upside isn’t great compared to the potential downside. We're pretty confident there are more exciting stocks to buy at the moment.
Wall Street analysts have a consensus one-year price target of $37.69 on the company (compared to the current share price of $30.06).
Although the price target is bullish, readers should exercise caution because analysts tend to be overly optimistic. The firms they work for, often big banks, have relationships with companies that extend into fundraising, M&A advisory, and other rewarding business lines. As a result, they typically hesitate to say bad things for fear they will lose out. We at StockStory do not suffer from such conflicts of interest, so we’ll always tell it like it is.