
Prudential (PRU)
Prudential is in for a bumpy ride. Its sales have underperformed and its low returns on capital show it has few growth opportunities.― StockStory Analyst Team
1. News


2. Summary
Why We Think Prudential Will Underperform
Recognized by its iconic Rock of Gibraltar logo symbolizing strength and stability since 1896, Prudential Financial (NYSE:PRU) provides life insurance, annuities, retirement solutions, investment management, and other financial services to individual and institutional customers globally.
- Insurance offerings faced market headwinds this cycle, reflected in stagnant net premiums earned over the last five years
- Products and services are facing significant credit quality challenges during this cycle as book value per share has declined by 11.3% annually over the last five years
- Annual interest expenses are high relative to its profits, increasing the probability of its failure to meet certain borrowing obligations


Prudential’s quality isn’t great. We’ve identified better opportunities elsewhere.
Why There Are Better Opportunities Than Prudential


Prudential’s stock price of $92.25 implies a valuation ratio of 0.9x forward P/B. Prudential’s multiple may seem like a great deal among insurance peers, but we think there are valid reasons why it’s this cheap.
Our advice is to pay up for elite businesses whose advantages are tailwinds to earnings growth. Don’t get sucked into lower-quality businesses just because they seem like bargains. These mediocre businesses often never achieve a higher multiple as hoped, a phenomenon known as a “value trap”.
3. Prudential (PRU) Research Report: Q4 CY2025 Update
Financial services giant Prudential Financial (NYSE:PRU) met Wall Streets revenue expectations in Q4 CY2025, with sales up 11.6% year on year to $14.52 billion. Its non-GAAP profit of $3.30 per share was 1.9% below analysts’ consensus estimates.
Prudential (PRU) Q4 CY2025 Highlights:
- Net Premiums Earned: $7.03 billion vs analyst estimates of $6.18 billion (6.8% year-on-year decline, 13.7% beat)
- Revenue: $14.52 billion vs analyst estimates of $14.46 billion (11.6% year-on-year growth, in line)
- Pre-tax Profit: $1.21 billion (8.4% margin)
- Adjusted EPS: $3.30 vs analyst expectations of $3.36 (1.9% miss)
- Book Value per Share: $92.05 vs analyst estimates of $101.08 (17.1% year-on-year growth, 8.9% miss)
- Market Capitalization: $39.09 billion
Company Overview
Recognized by its iconic Rock of Gibraltar logo symbolizing strength and stability since 1896, Prudential Financial (NYSE:PRU) provides life insurance, annuities, retirement solutions, investment management, and other financial services to individual and institutional customers globally.
Prudential operates through several key business segments that serve different markets and customer needs. Its PGIM division is a major global investment manager offering solutions across public fixed income, public equity, real estate, private credit, and other asset classes to institutional and retail clients. The U.S. Businesses segment includes Retirement Strategies, which provides both institutional retirement products like pension risk transfer solutions and individual annuities; Group Insurance, offering life, disability, and absence management services to employers; and Individual Life, which sells various life insurance products to protect families and businesses.
The company's International Businesses segment operates primarily in Japan, with additional presence in Brazil, Mexico, and other countries through joint ventures and strategic investments. This segment sells life insurance, retirement products, and investment solutions through proprietary distribution channels like Life Planners and Life Consultants, as well as through banks and independent agencies.
Prudential generates revenue through insurance premiums, investment income, asset management fees, and spreads between what it earns on investments and what it credits to policyholders. For example, a corporate client might purchase a pension risk transfer solution where Prudential assumes all investment and longevity risks for the company's retirees in exchange for a premium, while an individual might buy a variable annuity that provides both investment opportunities and guaranteed lifetime income.
The company's business model benefits from long-term demographic trends, including aging populations seeking retirement security and growing wealth in international markets. Prudential's operations are subject to comprehensive regulation by state insurance departments in the U.S. and by financial regulators in international markets where it operates.
4. Life Insurance
Life insurance companies collect premiums from policyholders in exchange for providing a future death benefit or retirement income stream. Interest rates matter for the sector (and make it cyclical), with higher rates allowing insurers to reinvest their fixed-income portfolios at more attractive yields and vice versa. Additionally, favorable demographic shifts, such as an aging population, are driving strong demand for retirement products while AI and data analytics offer significant opportunities to improve underwriting accuracy and operational efficiency. Conversely, the industry faces headwinds from persistent competition from agile insurtechs that threaten traditional distribution models.
Prudential Financial's competitors include other large diversified financial services companies such as MetLife (NYSE:MET), Lincoln National (NYSE:LNC), and Principal Financial Group (NASDAQ:PFG) in the U.S. market. In the asset management space, PGIM competes with firms like BlackRock (NYSE:BLK) and T. Rowe Price (NASDAQ:TROW), while internationally, Prudential faces competition from AIA Group in Asia and local providers in each market.
5. Revenue Growth
Insurance companies generate revenue three ways. The first is the core insurance business itself, represented in the income statement as premiums earned. The second source is investment income from investing the “float” (premiums collected but not yet paid out as claims) in assets such as fixed-income assets and equities. The third is fees from policy administration, annuities, and other value-added services. Unfortunately, Prudential’s 1.3% annualized revenue growth over the last five years was weak. This was below our standards and is a poor baseline for our analysis.
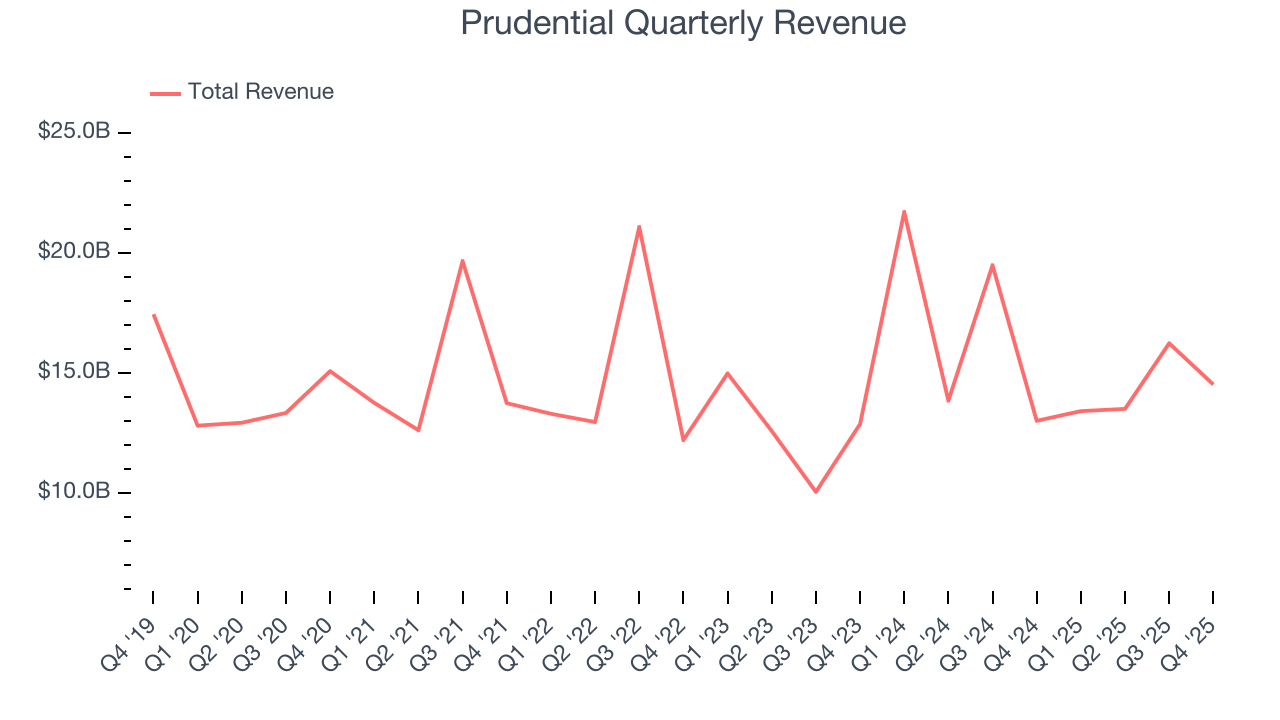
Long-term growth is the most important, but within financials, a half-decade historical view may miss recent interest rate changes and market returns. Prudential’s annualized revenue growth of 6.9% over the last two years is above its five-year trend, but we were still disappointed by the results. 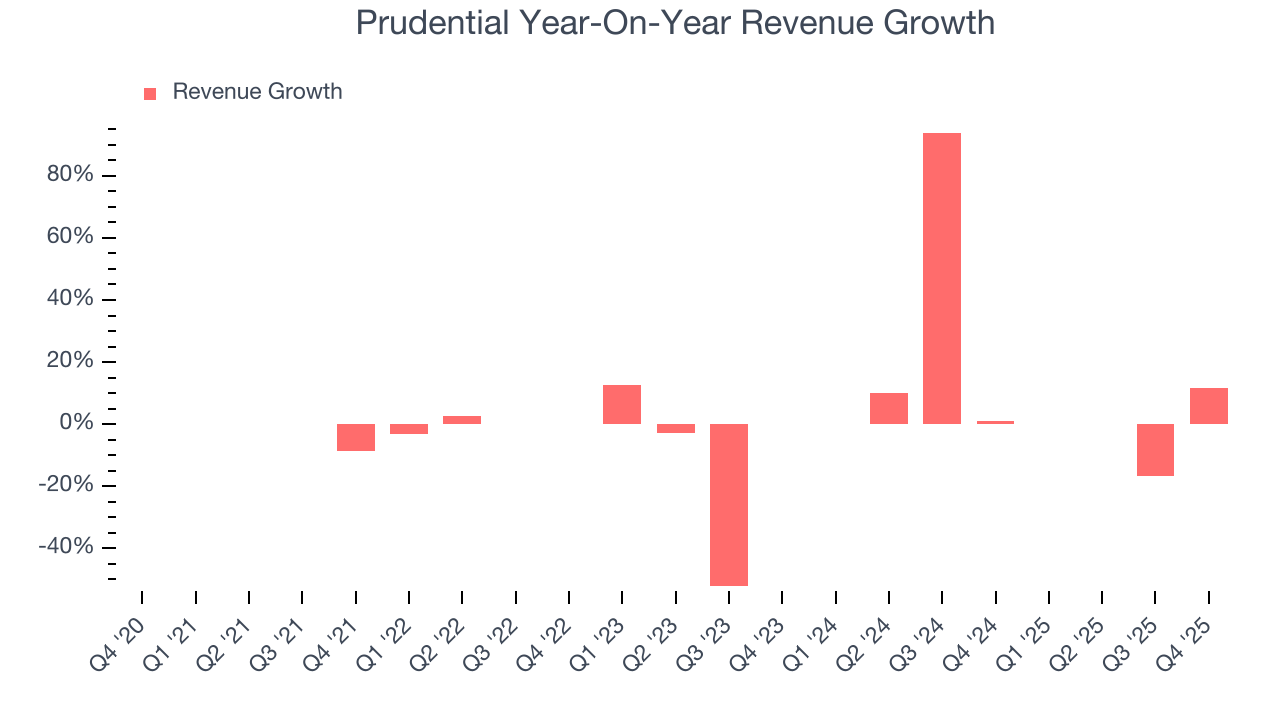 Note: Quarters not shown were determined to be outliers, impacted by outsized investment gains/losses that are not indicative of the recurring fundamentals of the business.
This quarter, Prudential’s year-on-year revenue growth was 11.6%, and its $14.52 billion of revenue was in line with Wall Street’s estimates.
Net premiums earned made up 65.9% of the company’s total revenue during the last five years, meaning insurance operations are Prudential’s largest source of revenue.
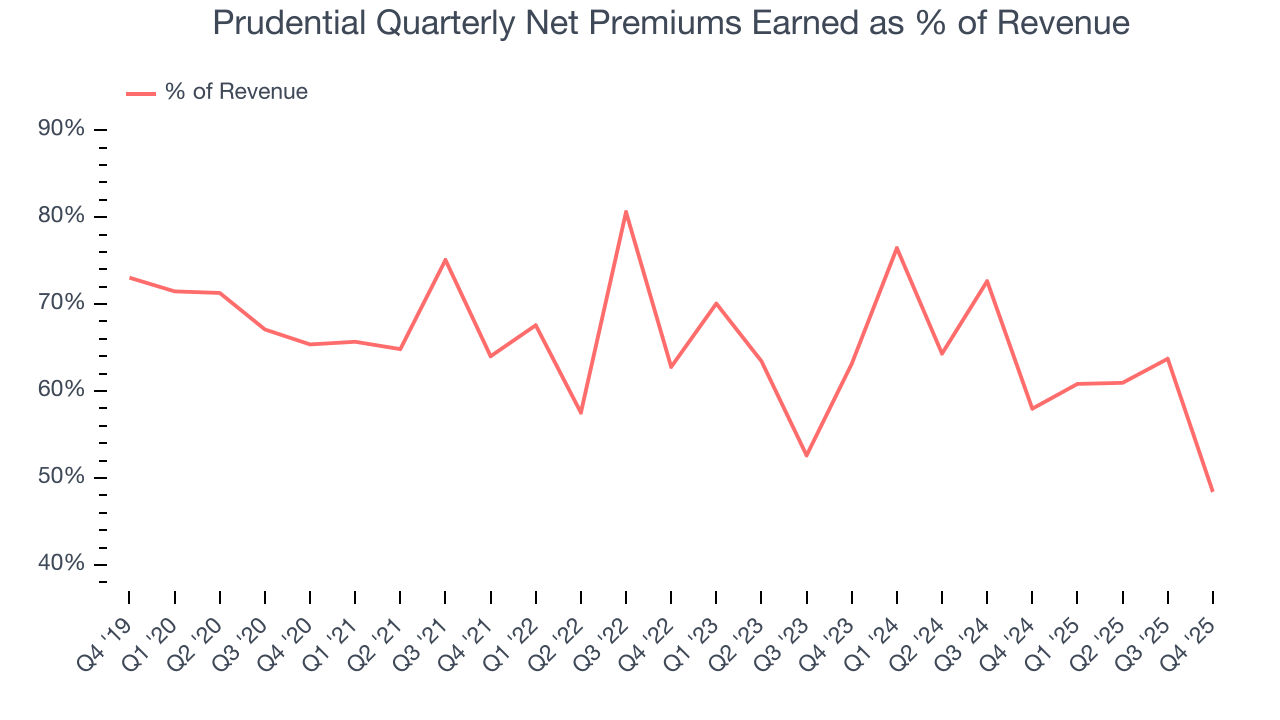
While insurers generate revenue from multiple sources, investors view net premiums earned as the cornerstone - its direct link to core operations stands in sharp contrast to the unpredictability of investment returns and fees.
6. Net Premiums Earned
Insurers sell policies then use reinsurance (insurance for insurance companies) to protect themselves from large losses. Net premiums earned are therefore what's collected from selling policies less what’s paid to reinsurers as a risk mitigation tool.
Prudential’s net premiums earned has declined by 1.9% annually over the last five years, much worse than the broader insurance industry. This shows that policy underwriting underperformed its other business lines.
When analyzing Prudential’s net premiums earned over the last two years, we can see that growth accelerated to 2.9% annually. Since two-year net premiums earned grew slower than total revenue over this period, it’s implied that other line items such as investment income grew at a faster rate. While these additional streams certainly contribute to the bottom line, their impact can vary. Some firms have shown greater success and long-term consistency in investing their float compared to peers. However, sharp fluctuations in the fixed income and equity markets can significantly affect short-term performance.
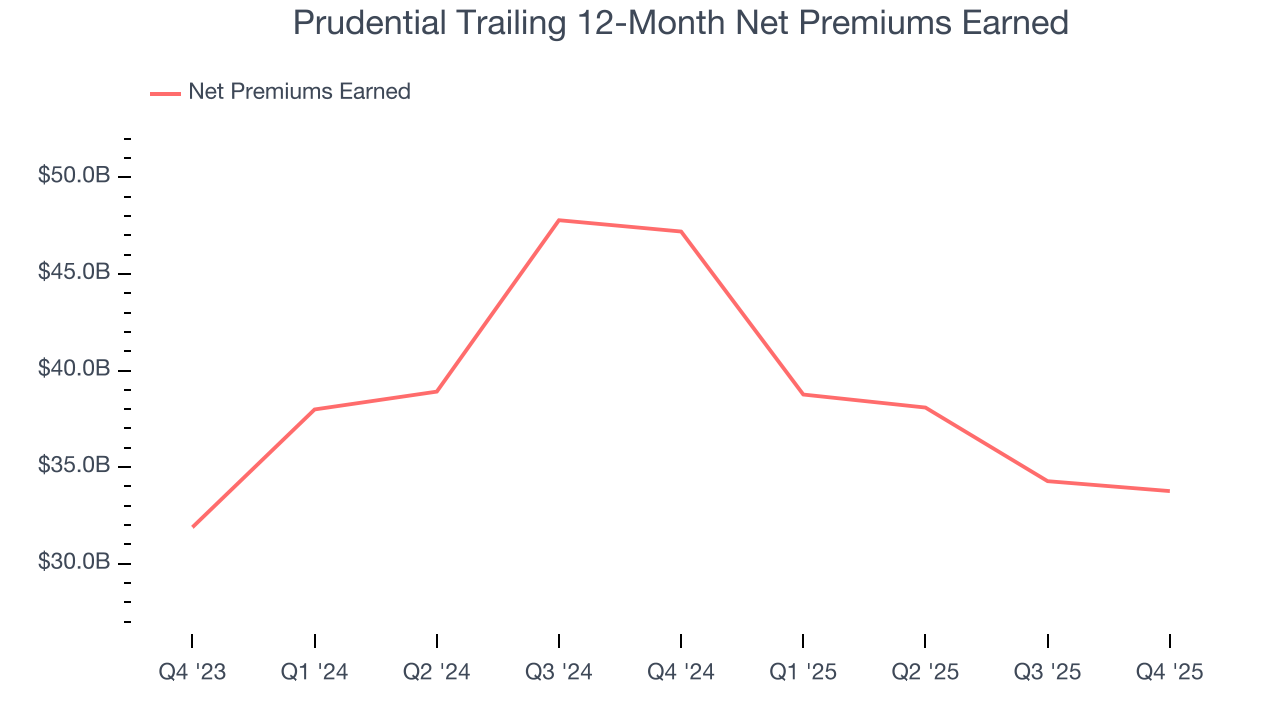
Prudential produced $7.03 billion of net premiums earned in Q4, down 6.8% year on year. But this was still enough to top Wall Street Consensus estimates by 13.7%.
7. Pre-Tax Profit Margin
Revenue growth is one major determinant of business quality, and the efficiency of operations is another. For insurance companies, we look at pre-tax profit rather than the operating margin that defines sectors such as consumer, tech, and industrials.
The economics of insurers are driven by their balance sheets, where assets (investing the float + premiums receivable) and liabilities (claims to pay) define the fundamentals. Interest income and expense should therefore be factored into the definition of profit but taxes - which are largely out of a company’s control - should not.
Over the last five years, Prudential’s pre-tax profit margin has fallen by 8.7 percentage points, going from 15.8% to 8.3%. It has also expanded by 2.1 percentage points on a two-year basis, showing its expenses have consistently grown at a slower rate than revenue. This typically signals prudent management.
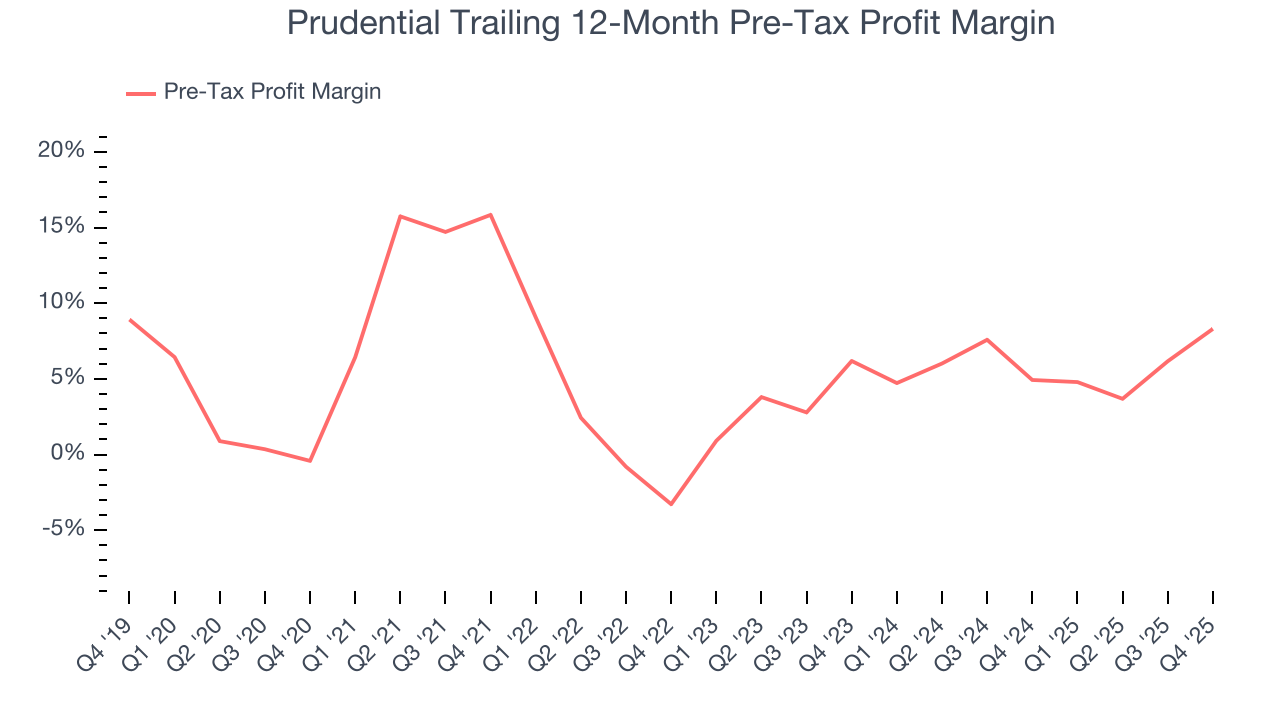
Prudential’s pre-tax profit margin came in at 8.4% this quarter. This result was 9.2 percentage points better than the same quarter last year.
8. Earnings Per Share
We track the long-term change in earnings per share (EPS) for the same reason as long-term revenue growth. Compared to revenue, however, EPS highlights whether a company’s growth is profitable.
Prudential’s EPS grew at an unimpressive 7% compounded annual growth rate over the last five years. On the bright side, this performance was better than its 1.3% annualized revenue growth and tells us the company became more profitable on a per-share basis as it expanded.
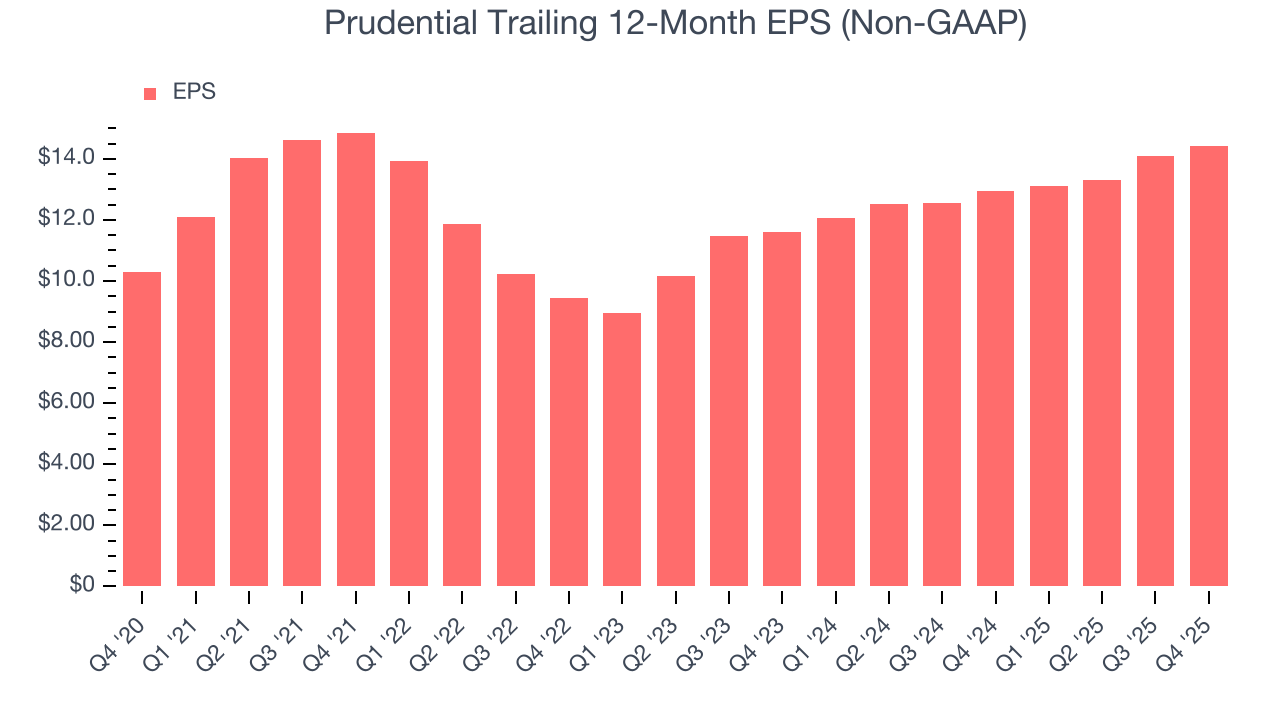
We can take a deeper look into Prudential’s earnings to better understand the drivers of its performance. As we mentioned earlier, Prudential’s pre-tax profit margin expanded by 8.7 percentage points over the last five years. On top of that, its share count shrank by 11.9%. These are positive signs for shareholders because improving profitability and share buybacks turbocharge EPS growth relative to revenue growth. 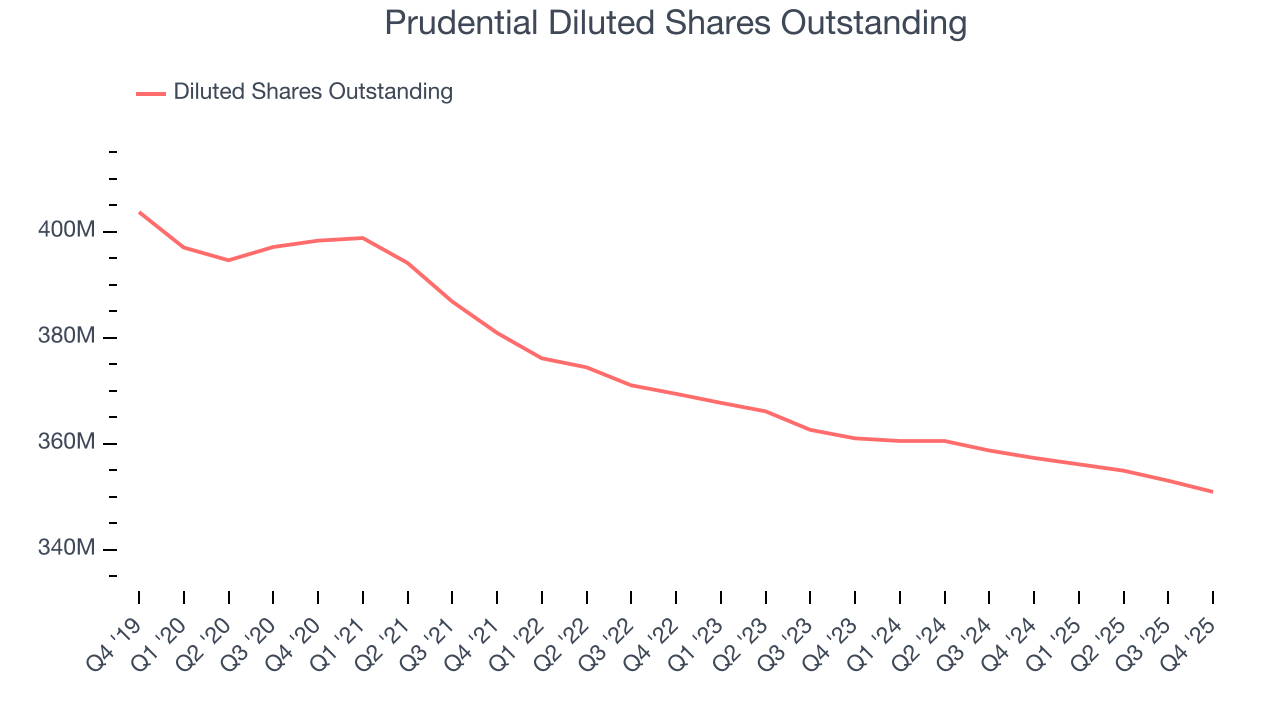
Like with revenue, we analyze EPS over a more recent period because it can provide insight into an emerging theme or development for the business.
For Prudential, its two-year annual EPS growth of 11.4% was higher than its five-year trend. Accelerating earnings growth is almost always an encouraging data point.
In Q4, Prudential reported adjusted EPS of $3.30, up from $2.96 in the same quarter last year. Despite growing year on year, this print slightly missed analysts’ estimates. Over the next 12 months, Wall Street expects Prudential’s full-year EPS of $14.43 to grow 3.4%.
9. Book Value Per Share (BVPS)
Insurance companies are balance sheet businesses, collecting premiums upfront and paying out claims over time. The float–premiums collected but not yet paid out–are invested, creating an asset base supported by a liability structure. Book value per share (BVPS) captures this dynamic by measuring these assets (investment portfolio, cash, reinsurance recoverables) less liabilities (claim reserves, debt, future policy benefits). BVPS is essentially the residual value for shareholders.
We therefore consider BVPS very important to track for insurers and a metric that sheds light on business quality. While other (and more commonly known) per-share metrics like EPS can sometimes be lumpy due to reserve releases or one-time items and can be managed or skewed while still following accounting rules, BVPS reflects long-term capital growth and is harder to manipulate.
Prudential’s BVPS declined at a 11.6% annual clip over the last five years. However, BVPS growth has accelerated recently, growing by 9% annually over the last two years from $77.45 to $92.05 per share.
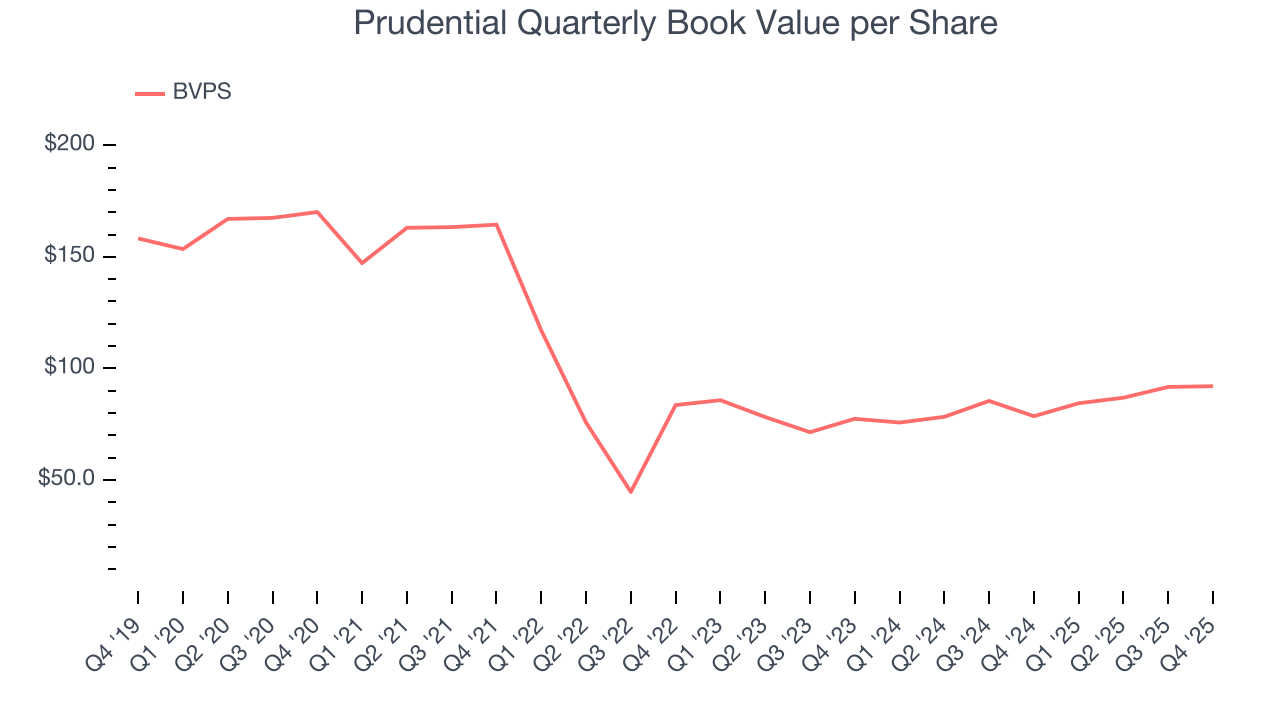
Over the next 12 months, Consensus estimates call for Prudential’s BVPS to grow by 18.3% to $101.08, elite growth rate.
10. Balance Sheet Risk
The debt-to-equity ratio is a widely used measure to assess a company's balance sheet health. A higher ratio means that a business aggressively financed its growth with debt. This can result in higher earnings (if the borrowed funds are invested profitably) but also increases risk.
If debt levels are too high, there could be difficulties in meeting obligations, especially during economic downturns or periods of rising interest rates if the debt has variable-rate payments.
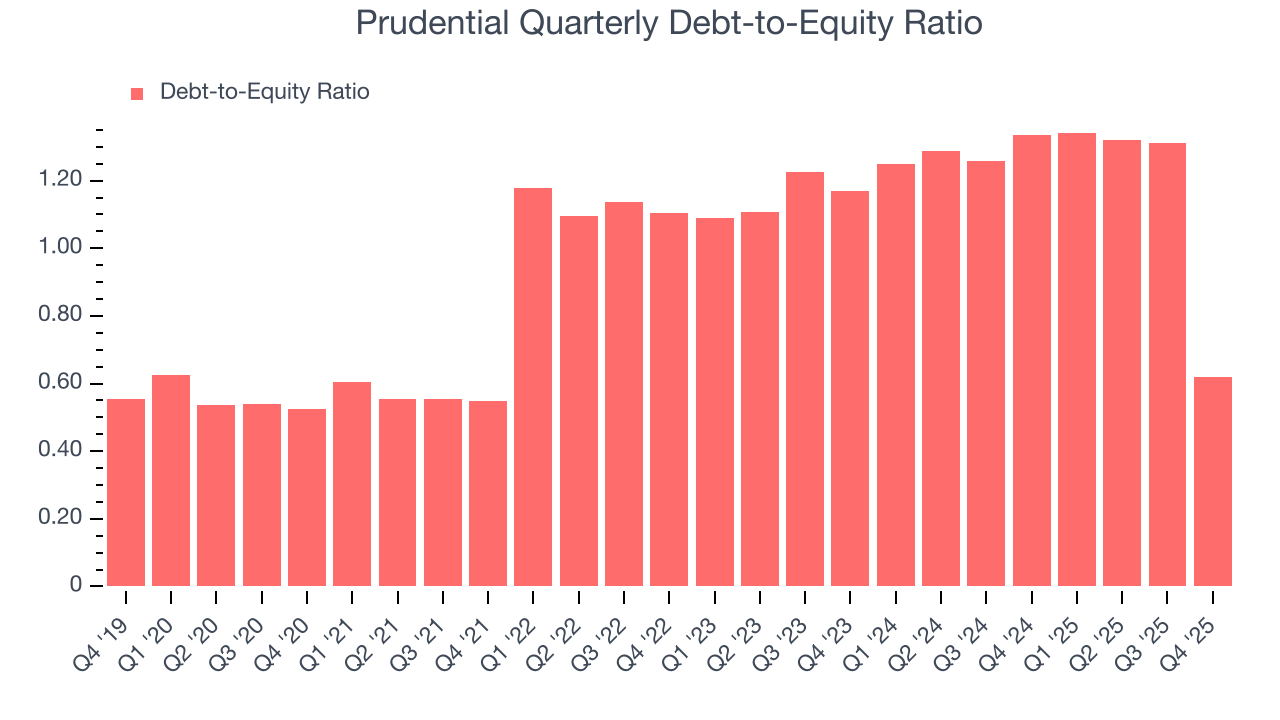
Prudential currently has $20.3 billion of debt and $32.79 billion of shareholder's equity on its balance sheet, and over the past four quarters, has averaged a debt-to-equity ratio of 1.1×. We think this is dangerous - for an insurance business, anything above 1.0× raises red flags.
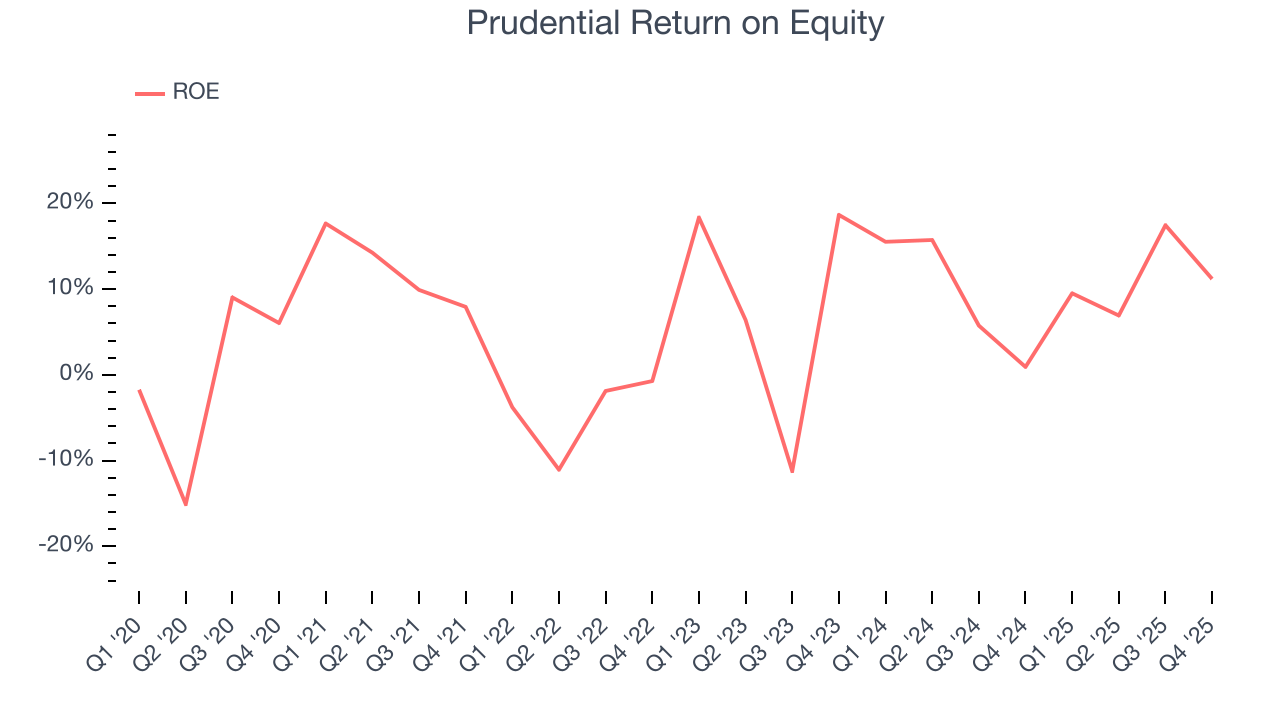
11. Return on Equity
Return on equity (ROE) serves as a comprehensive measure of an insurer's performance, showing how efficiently it converts shareholder capital into profits. Strong ROE performance typically translates to better returns for investors through a combination of earnings retention, share repurchases, and dividend distributions.
Over the last five years, Prudential has averaged an ROE of 7.4%, uninspiring for a company operating in a sector where the average shakes out around 12.5%.
12. Key Takeaways from Prudential’s Q4 Results
We were impressed by how significantly Prudential blew past analysts’ net premiums earned expectations this quarter. We were also happy its revenue was in line with Wall Street’s estimates. On the other hand, its book value per share missed and its EPS fell short of Wall Street’s estimates. Overall, this was a mixed quarter. The stock remained flat at $106.18 immediately after reporting.
13. Is Now The Time To Buy Prudential?
Updated: March 14, 2026 at 12:50 AM EDT
Before investing in or passing on Prudential, we urge you to understand the company’s business quality (or lack thereof), valuation, and the latest quarterly results - in that order.
Prudential falls short of our quality standards. To kick things off, its revenue growth was weak over the last five years, and analysts don’t see anything changing over the next 12 months. While its expanding pre-tax profit margin shows the business has become more efficient, the downside is its BVPS has declined over the last five years. On top of that, its projected EPS for the next year is lacking.
Prudential’s P/B ratio based on the next 12 months is 0.9x. While this valuation is reasonable, we don’t see a big opportunity at the moment. There are more exciting stocks to buy at the moment.
Wall Street analysts have a consensus one-year price target of $110.07 on the company (compared to the current share price of $92.25).
Although the price target is bullish, readers should exercise caution because analysts tend to be overly optimistic. The firms they work for, often big banks, have relationships with companies that extend into fundraising, M&A advisory, and other rewarding business lines. As a result, they typically hesitate to say bad things for fear they will lose out. We at StockStory do not suffer from such conflicts of interest, so we’ll always tell it like it is.