
MetLife (MET)
MetLife is up against the odds. Its weak sales growth and low returns on capital show it struggled to generate demand and profits.― StockStory Analyst Team
1. News


2. Summary
Why We Think MetLife Will Underperform
Founded in 1863 by a group of New York businessmen during the Civil War era, MetLife (NYSE:MET) is a global financial services company that provides insurance, annuities, employee benefits, and asset management services to individuals and businesses worldwide.
- Products and services are facing significant credit quality challenges during this cycle as book value per share has declined by 12.3% annually over the last five years
- Annual book value per share growth of 2.7% over the last two years lagged behind its insurance peers as its large balance sheet made it difficult to generate incremental capital growth
- Earnings growth over the last two years fell short of the peer group average as its EPS only increased by 10.3% annually


MetLife fails to meet our quality criteria. We believe there are better businesses elsewhere.
Why There Are Better Opportunities Than MetLife


MetLife is trading at $68.06 per share, or 1.6x forward P/B. This multiple is high given its weaker fundamentals.
Paying a premium for high-quality companies with strong long-term earnings potential is preferable to owning challenged businesses with questionable prospects. That helps the prudent investor sleep well at night.
3. MetLife (MET) Research Report: Q4 CY2025 Update
Global insurance giant MetLife (NYSE:MET) missed Wall Street’s revenue expectations in Q4 CY2025, but sales rose 20.7% year on year to $23.81 billion. Its non-GAAP profit of $2.49 per share was 6.3% above analysts’ consensus estimates.
MetLife (MET) Q4 CY2025 Highlights:
- Net Premiums Earned: $16.69 billion vs analyst estimates of $19.3 billion (20.7% year-on-year growth, 13.5% miss)
- Revenue: $23.81 billion vs analyst estimates of $26.66 billion (20.7% year-on-year growth, 10.7% miss)
- Pre-tax Profit: $1.12 billion (4.7% margin)
- Adjusted EPS: $2.49 vs analyst estimates of $2.34 (6.3% beat)
- Book Value per Share: $39.02 vs analyst estimates of $58.05 (2% year-on-year decline, 32.8% miss)
- Market Capitalization: $50.67 billion
Company Overview
Founded in 1863 by a group of New York businessmen during the Civil War era, MetLife (NYSE:MET) is a global financial services company that provides insurance, annuities, employee benefits, and asset management services to individuals and businesses worldwide.
MetLife operates through six segments: Group Benefits, Retirement and Income Solutions (RIS), Asia, Latin America, Europe, the Middle East and Africa (EMEA), and MetLife Holdings. The company serves both individual consumers and institutional clients, offering a diverse portfolio of protection and financial solutions.
In its Group Benefits segment, MetLife provides employers with life, dental, disability, vision, and accident insurance, along with pet insurance and prepaid legal plans. A typical corporate client might offer MetLife dental coverage as part of its benefits package, allowing employees to visit network dentists with reduced out-of-pocket costs.
The RIS segment focuses on helping institutional customers manage liabilities associated with employee benefit programs. For example, a company looking to transfer pension obligations might use MetLife's pension risk transfer solutions to convert uncertain future pension payments into predictable financial commitments.
Internationally, MetLife offers life insurance, accident and health coverage, and retirement products tailored to local markets. In Japan, its largest international operation, the company distributes products through career agents and general agencies, while in Latin America it employs multiple channels including exclusive agents and direct marketing.
MetLife generates revenue primarily through insurance premiums, investment income, and fees. As one of the largest institutional investors in the U.S., it maintains a general account portfolio invested mainly in fixed income securities and mortgage loans. The company distributes many products through third-party channels, including banks and broker-dealers, while maintaining direct sales forces in certain markets.
4. Life Insurance
Life insurance companies collect premiums from policyholders in exchange for providing a future death benefit or retirement income stream. Interest rates matter for the sector (and make it cyclical), with higher rates allowing insurers to reinvest their fixed-income portfolios at more attractive yields and vice versa. Additionally, favorable demographic shifts, such as an aging population, are driving strong demand for retirement products while AI and data analytics offer significant opportunities to improve underwriting accuracy and operational efficiency. Conversely, the industry faces headwinds from persistent competition from agile insurtechs that threaten traditional distribution models.
MetLife's primary competitors include other major insurance and financial services companies such as Prudential Financial (NYSE:PRU), New York Life Insurance Company (private), Allianz SE (ETR:ALV), AIG (NYSE:AIG), and Manulife Financial (NYSE:MFC).
5. Revenue Growth
Big picture, insurers generate revenue from three key sources. The first is the core business of underwriting policies. The second source is income from investing the “float” (premiums collected upfront not yet paid out as claims) in assets such as fixed-income assets and equities. The third is fees from various sources such as policy administration, annuities, or other value-added services. Over the last five years, MetLife grew its revenue at a sluggish 3.4% compounded annual growth rate. This was below our standard for the insurance sector and is a poor baseline for our analysis.
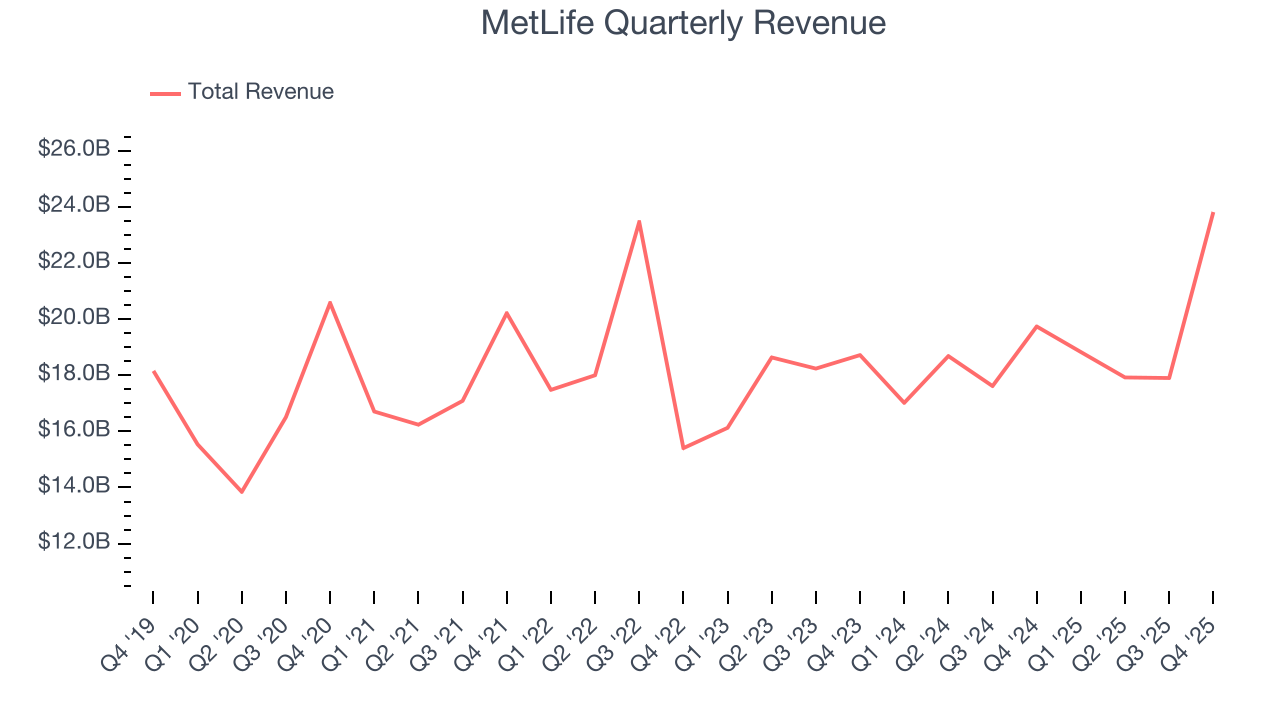
Long-term growth is the most important, but within financials, a half-decade historical view may miss recent interest rate changes and market returns. MetLife’s annualized revenue growth of 4.6% over the last two years is above its five-year trend, but we were still disappointed by the results. 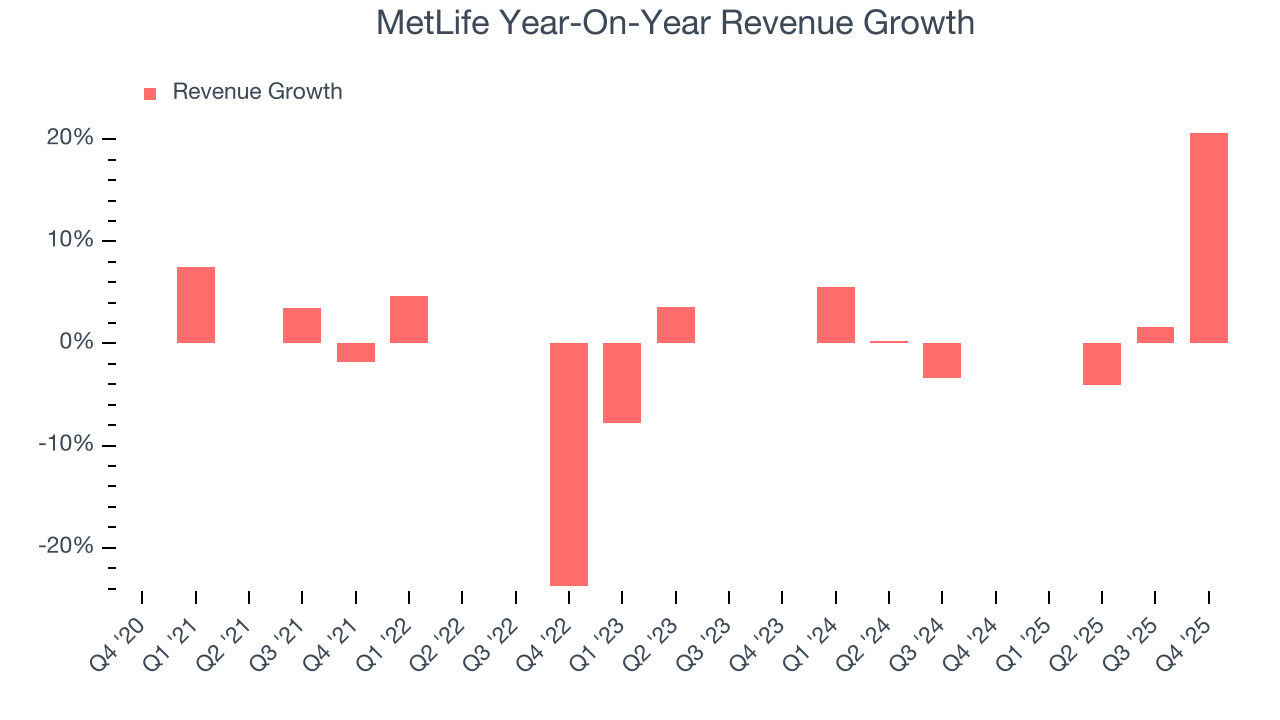 Note: Quarters not shown were determined to be outliers, impacted by outsized investment gains/losses that are not indicative of the recurring fundamentals of the business.
This quarter, MetLife generated an excellent 20.7% year-on-year revenue growth rate, but its $23.81 billion of revenue fell short of Wall Street’s high expectations.
Net premiums earned made up 69.2% of the company’s total revenue during the last five years, meaning insurance operations are MetLife’s largest source of revenue.
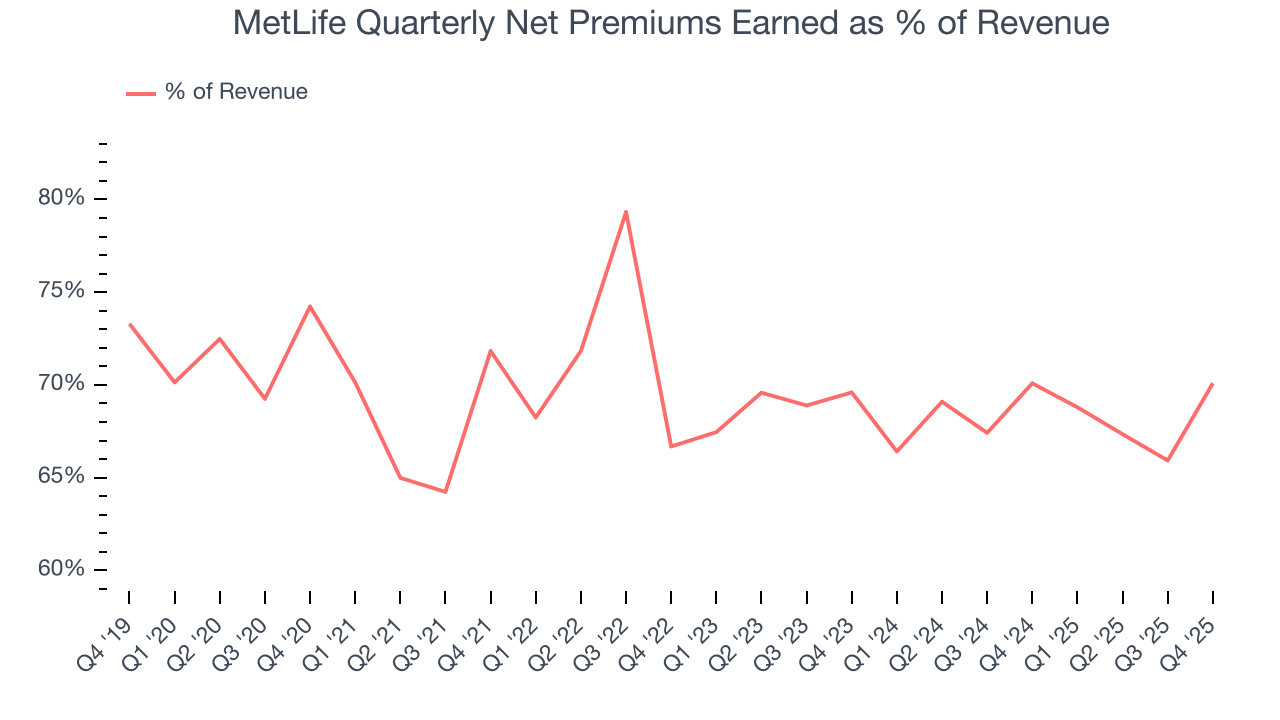
Markets consistently prioritize net premiums earned growth over investment and fee income, recognizing its superior quality as a core indicator of the company’s underwriting success and market penetration.
6. Net Premiums Earned
Insurers sell policies then use reinsurance (insurance for insurance companies) to protect themselves from large losses. Net premiums earned are therefore what's collected from selling policies less what’s paid to reinsurers as a risk mitigation tool.
MetLife’s net premiums earned has grown at a 2.4% annualized rate over the last five years, much worse than the broader insurance industry and slower than its total revenue.
When analyzing MetLife’s net premiums earned over the last two years, we can see that growth accelerated to 4% annually. This performance was similar to its total revenue.
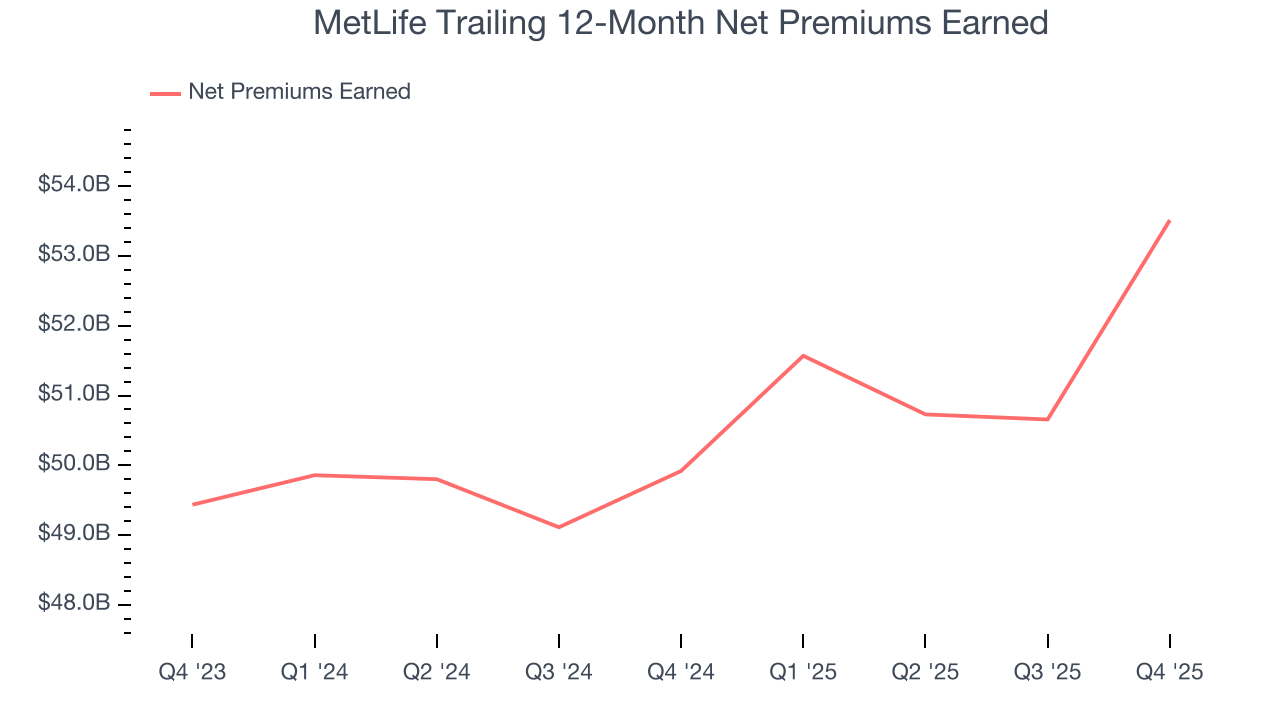
MetLife’s net premiums earned came in at $16.69 billion this quarter, up a hearty 20.7% year on year. But this wasn’t enough juice to meet Wall Street Consensus estimates.
7. Pre-Tax Profit Margin
Revenue growth is one major determinant of business quality, and the efficiency of operations is another. For insurance companies, we look at pre-tax profit rather than the operating margin that defines sectors such as consumer, tech, and industrials.
Insurance companies are balance sheet businesses, where assets and liabilities define the economics. Interest income and expense should therefore be factored into the definition of profit but taxes - which are largely out of a company’s control - should not. This is pre-tax profit by definition.
Over the last five years, MetLife’s pre-tax profit margin has risen by 4.5 percentage points, going from 11.6% to 5.9%. Luckily, it seems the company has recently taken steps to address its expense base as its pre-tax profit margin expanded by 2.9 percentage points on a two-year basis.
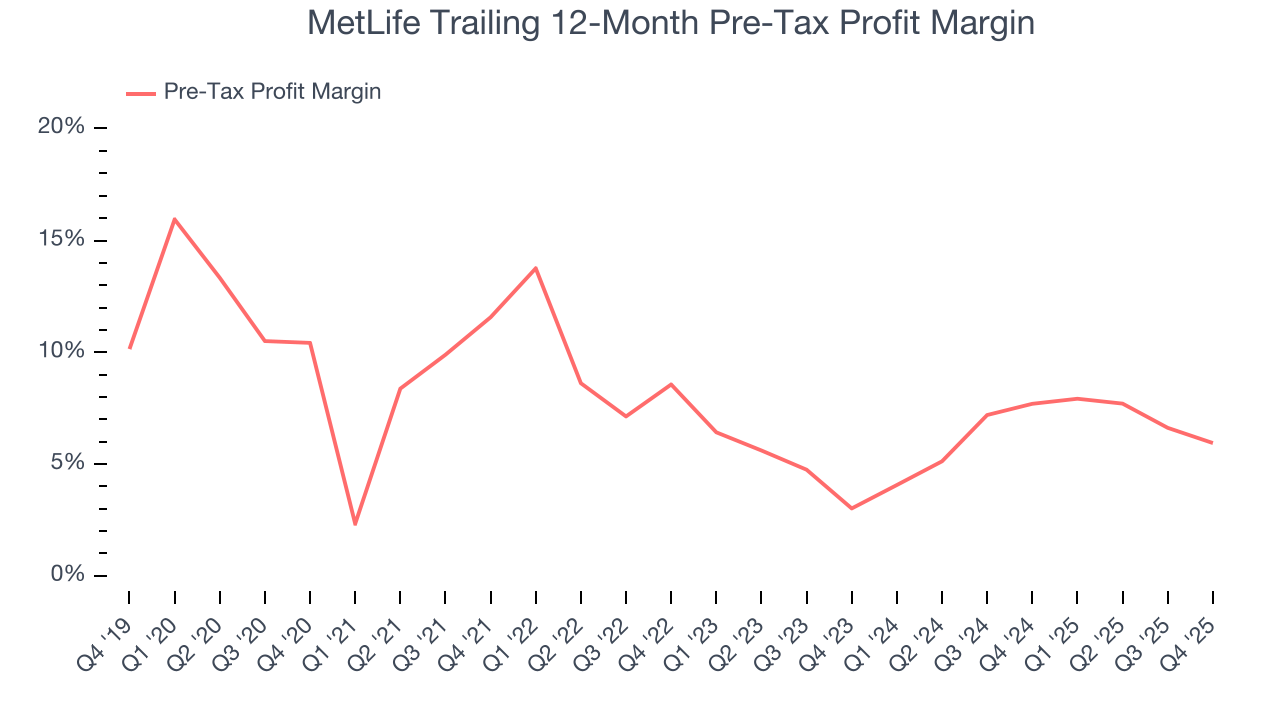
MetLife’s pre-tax profit margin came in at 4.7% this quarter. This result was 2.3 percentage points worse than the same quarter last year.
8. Earnings Per Share
We track the long-term change in earnings per share (EPS) for the same reason as long-term revenue growth. Compared to revenue, however, EPS highlights whether a company’s growth is profitable.
MetLife’s EPS grew at an unimpressive 7.5% compounded annual growth rate over the last five years. This performance was better than its flat revenue but doesn’t tell us much about its business quality because its pre-tax profit margin didn’t improve.
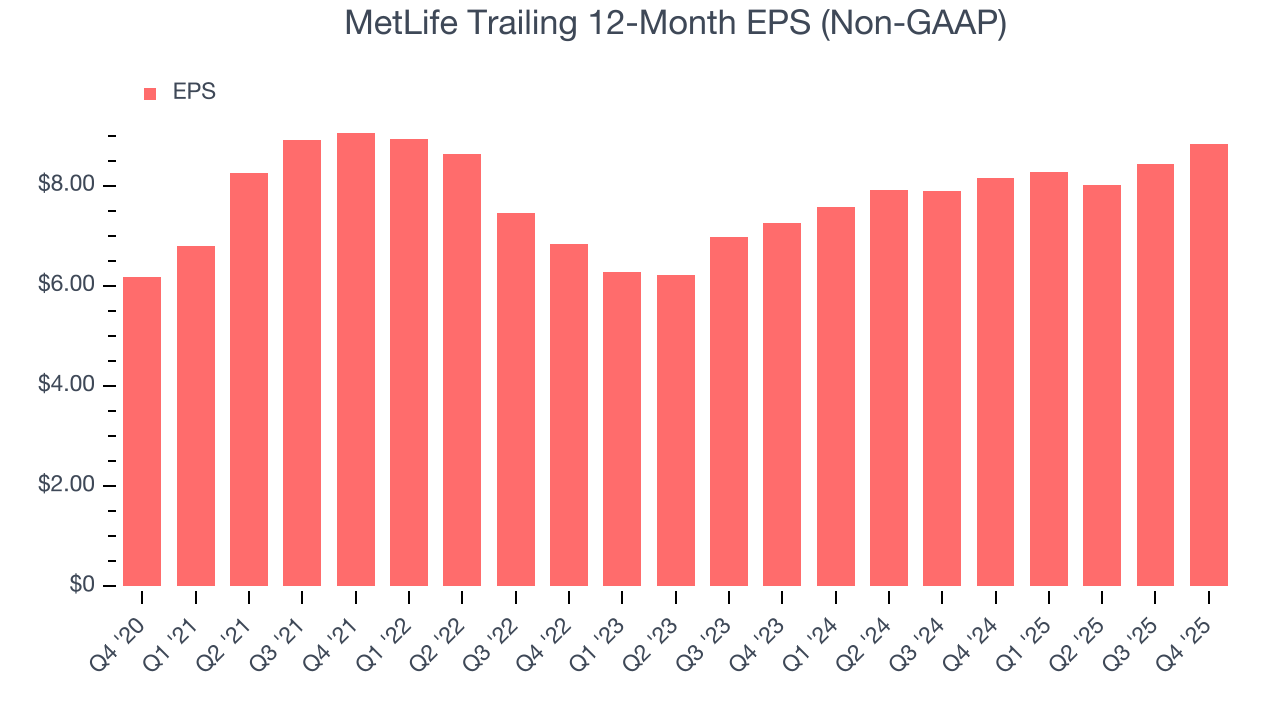
We can take a deeper look into MetLife’s earnings to better understand the drivers of its performance. A five-year view shows that MetLife has repurchased its stock, shrinking its share count by 26.9%. This tells us its EPS outperformed its revenue not because of increased operational efficiency but financial engineering, as buybacks boost per share earnings. 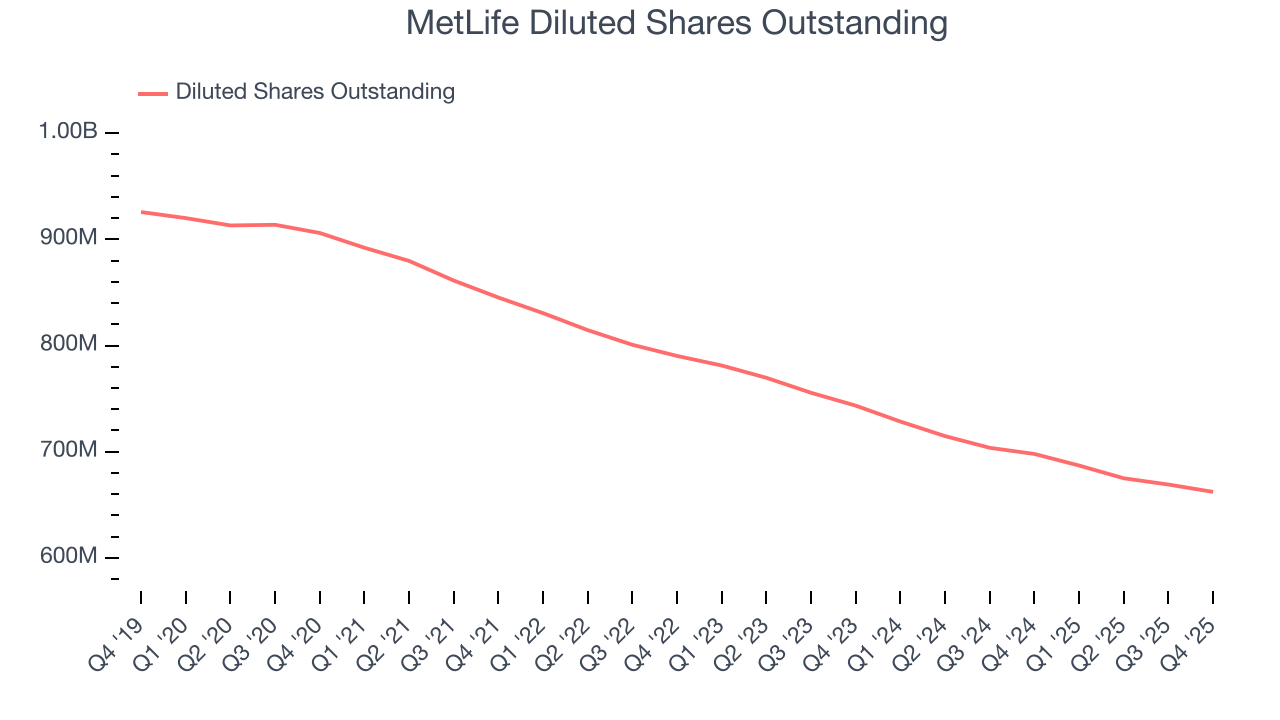
Like with revenue, we analyze EPS over a shorter period to see if we are missing a change in the business.
For MetLife, its two-year annual EPS growth of 10.3% was higher than its five-year trend. Accelerating earnings growth is almost always an encouraging data point.
In Q4, MetLife reported adjusted EPS of $2.49, up from $2.09 in the same quarter last year. This print beat analysts’ estimates by 6.3%. Over the next 12 months, Wall Street expects MetLife’s full-year EPS of $8.84 to grow 11.5%.
9. Book Value Per Share (BVPS)
Insurance companies are balance sheet businesses, collecting premiums upfront and paying out claims over time. The float – premiums collected but not yet paid out – are invested, creating an asset base supported by a liability structure. Book value captures this dynamic by measuring:
- Assets (investment portfolio, cash, reinsurance recoverables) - liabilities (claim reserves, debt, future policy benefits)
BVPS is essentially the residual value for shareholders.
We therefore consider BVPS very important to track for insurers and a metric that sheds light on business quality because it reflects long-term capital growth and is harder to manipulate than more commonly-used metrics like EPS.
MetLife’s BVPS declined at a 14.1% annual clip over the last five years. On a two-year basis, BVPS fell at a slower pace, dropping by 2.5% annually from $41.07 to $39.02 per share.
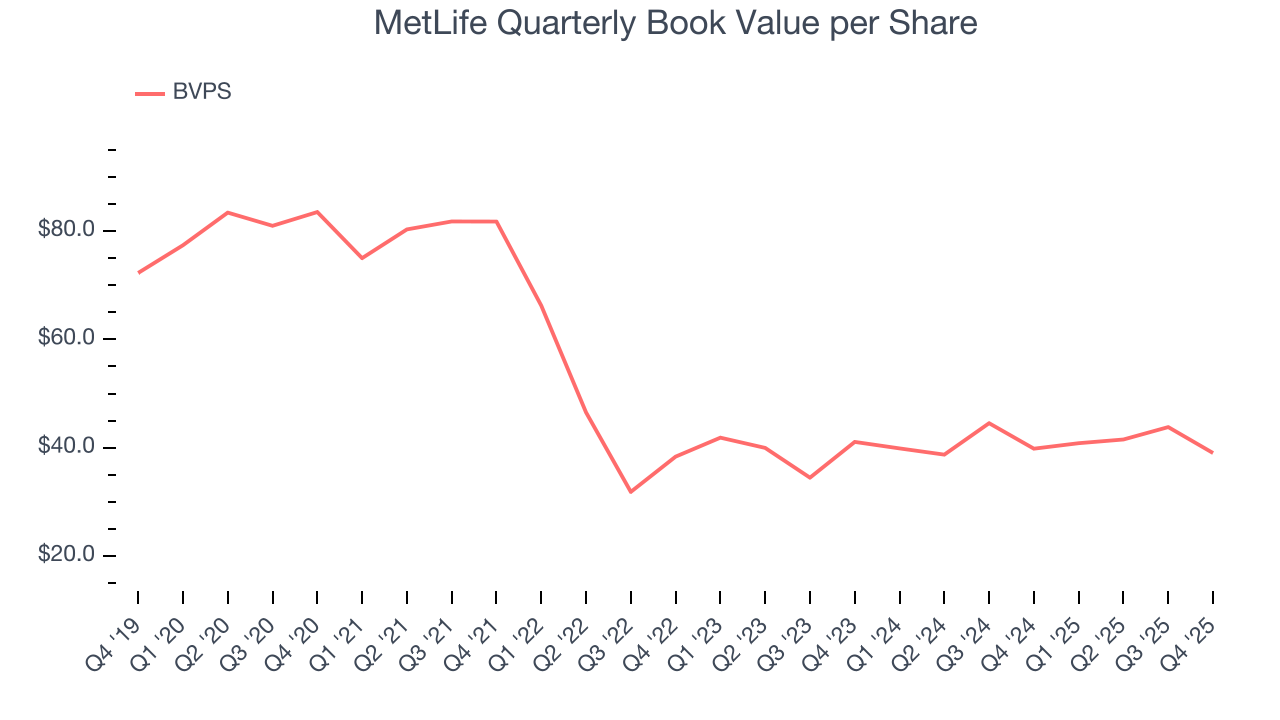
Over the next 12 months, Consensus estimates call for MetLife’s BVPS to grow by 63.2% to $58.05, elite growth rate.
10. Balance Sheet Assessment
The debt-to-equity ratio is a widely used measure to assess a company's balance sheet health. A higher ratio means that a business aggressively financed its growth with debt. This can result in higher earnings (if the borrowed funds are invested profitably) but also increases risk.
If debt levels are too high, there could be difficulties in meeting obligations, especially during economic downturns or periods of rising interest rates if the debt has variable-rate payments.
MetLife has no debt, so leverage is not an issue here.
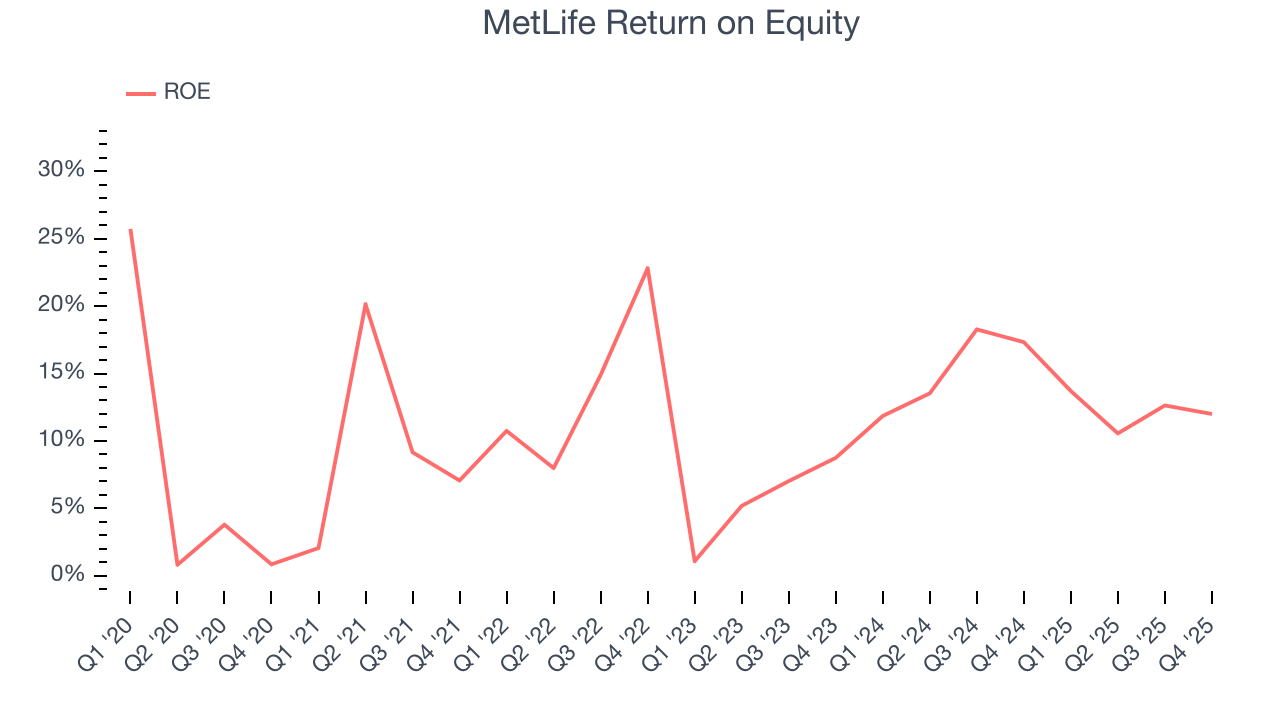
11. Return on Equity
Return on equity (ROE) serves as a comprehensive measure of an insurer's performance, showing how efficiently it converts shareholder capital into profits. Strong ROE performance typically translates to better returns for investors through a combination of earnings retention, share repurchases, and dividend distributions.
Over the last five years, MetLife has averaged an ROE of 11.3%, uninspiring for a company operating in a sector where the average shakes out around 12.5%.
12. Key Takeaways from MetLife’s Q4 Results
We struggled to find many positives in these results. Its revenue missed and its net premiums earned fell short of Wall Street’s estimates. Overall, this quarter could have been better. The stock traded down 1.5% to $76.85 immediately following the results.
13. Is Now The Time To Buy MetLife?
Updated: March 16, 2026 at 12:35 AM EDT
The latest quarterly earnings matters, sure, but we actually think longer-term fundamentals and valuation matter more. Investors should consider all these pieces before deciding whether or not to invest in MetLife.
We see the value of companies helping consumers, but in the case of MetLife, we’re out. First off, its revenue growth was weak over the last five years, and analysts expect its demand to deteriorate over the next 12 months. While its estimated BVPS growth for the next 12 months is great, the downside is its BVPS has declined over the last five years. On top of that, its net premiums earned growth was weak over the last five years.
MetLife’s P/B ratio based on the next 12 months is 1.6x. This valuation tells us a lot of optimism is priced in - we think other companies feature superior fundamentals at the moment.
Wall Street analysts have a consensus one-year price target of $90.73 on the company (compared to the current share price of $68.06).
Although the price target is bullish, readers should exercise caution because analysts tend to be overly optimistic. The firms they work for, often big banks, have relationships with companies that extend into fundraising, M&A advisory, and other rewarding business lines. As a result, they typically hesitate to say bad things for fear they will lose out. We at StockStory do not suffer from such conflicts of interest, so we’ll always tell it like it is.