
Crescent Energy (CRGY)
1. News
2. Crescent Energy (CRGY) Research Report: Q4 CY2025 Update
Oil and gas producer Crescent Energy (NYSE:CRGY) beat Wall Street’s revenue expectations in Q4 CY2025, but sales fell by 1.2% year on year to $865 million. Its non-GAAP profit of $0.49 per share was 46.3% above analysts’ consensus estimates.
Crescent Energy (CRGY) Q4 CY2025 Highlights:
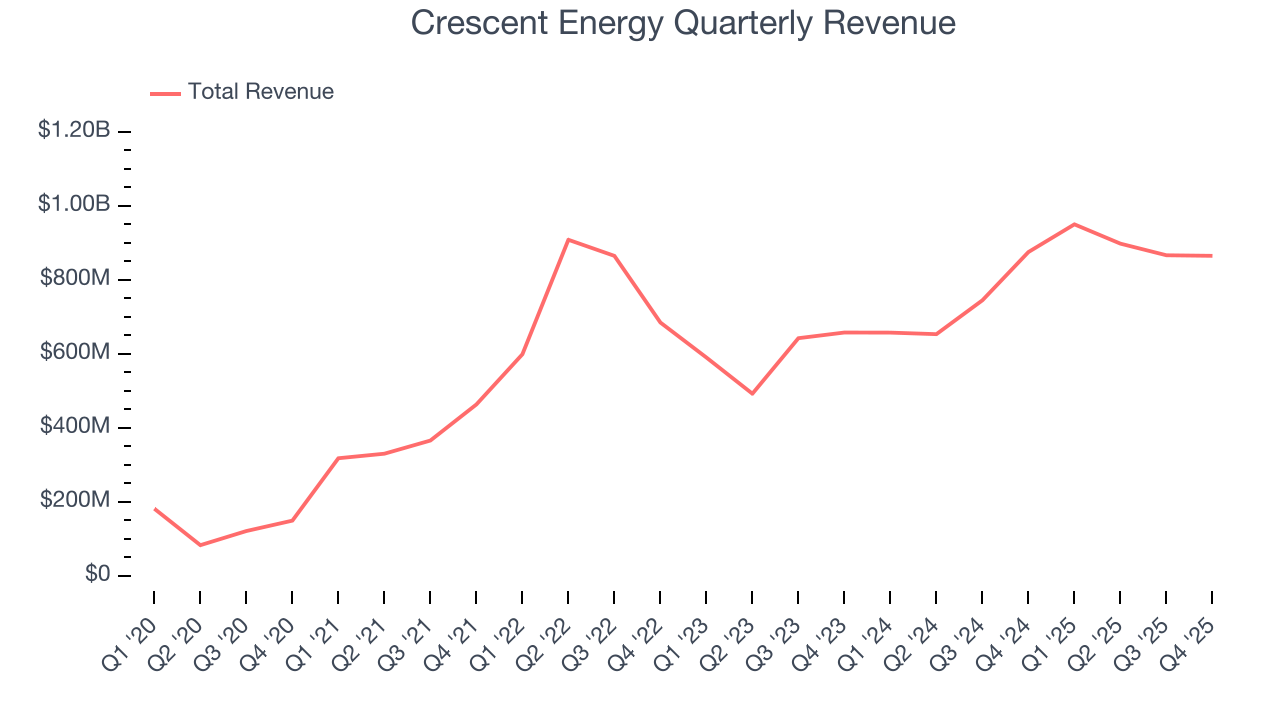
- Revenue: $865 million vs analyst estimates of $851.8 million (1.2% year-on-year decline, 1.6% beat)
- Adjusted EPS: $0.49 vs analyst estimates of $0.33 (46.3% beat)
- Adjusted EBITDA: $235.4 million vs analyst estimates of $511.1 million (27.2% margin, 53.9% miss)
- Operating Margin: -6.2%, down from -3.1% in the same quarter last year
- Free Cash Flow Margin: 12.9%, down from 19% in the same quarter last year
- Oil production per day: up 8.2% year on year
- Market Capitalization: $4.09 billion
Company Overview
Controlling over 1.4 million net acres across proven U.S. basins, Crescent Energy (NYSE:CRGY) extracts oil and natural gas from underground reservoirs in Texas and the Rocky Mountains.
The company operates across two primary geographic regions. In Texas, its operations center on the Eagle Ford Shale, a prolific oil-producing formation in the southeastern part of the state. In the Rocky Mountain region, its assets span multiple areas including Wyoming and Colorado. For context, when an oil and gas company like Crescent Energy holds leasehold acreage, it has the right to drill and extract hydrocarbons from those properties, typically paying royalties to the mineral rights owners.
Beyond traditional leasehold operations, Crescent Energy owns mineral and royalty interests, which means it receives a portion of revenue from oil and gas production on land where other companies do the actual drilling and operating. As of late 2024, these interests covered mineral rights on 166 thousand gross acres and overriding royalty interests on 118 thousand gross acres, primarily in the Eagle Ford, Marcellus, Utica, and Rockies regions. This structure allows the company to generate revenue from production without incurring the operating costs, as large operators handle the drilling and extraction work.
The company also owns midstream infrastructure that transports and processes oil and gas. These assets include partial ownership in gathering systems that collect oil and gas from wellheads, pipelines that transport carbon dioxide used in enhanced oil recovery (a technique that injects CO2 underground to push out additional oil), and processing facilities that prepare natural gas for market. Some of these midstream assets serve Crescent Energy's own wells while also providing services to third-party operators, creating an additional revenue stream. The company generates revenue by selling the oil, natural gas, and natural gas liquids (NGLs) it produces to purchasers like Shell Trading US Company and ConocoPhillips.
3. U.S. Shale E&P
US shale oil producers extract crude from tight rock formations using horizontal drilling and hydraulic fracturing (fracking) techniques, primarily in basins like the Permian, Bakken, and Eagle Ford. Tailwinds include short-cycle investment flexibility allowing rapid production adjustments, technological improvements enhancing well productivity, and proximity to refining and export infrastructure. Capital discipline has improved financial returns. Headwinds include commodity price sensitivity affecting drilling economics, accelerating well decline rates requiring continuous capital investment, and increasing regulatory and ESG scrutiny. Water usage, induced seismicity concerns, and evolving environmental regulations present ongoing operational challenges.
Crescent Energy competes with other oil and gas producers operating in similar regions, including Diamondback Energy (NASDAQ:FANG), Permian Resources (NYSE:PR), Civitas Resources (NYSE:CIVI), and Chord Energy (NASDAQ:CHRD).
4. Economies of Scale
In Energy, scale separates fragile single-asset producers from platform-style businesses that generate revenue across entire basins and infrastructure networks. Crescent Energy’s $3.58 billion of revenue in the last year lacks scale in an industry where it matters.
5. Revenue Growth
A company’s long-term performance can give signals about its business quality. Even a bad business, especially in a cyclical industry, can shine for a year or so, but a top-tier one should exhibit resilience through cycles. Thankfully, Crescent Energy’s 46.3% annualized revenue growth over the last five years was incredible. Its growth surpassed the average energy upstream and integrated energy company and shows its offerings resonate with customers, a great starting point for our analysis.
Revenue provides useful context, but it is heavily influenced by commodity prices and acquisitions. Production volumes, by contrast, reveal whether the underlying asset base is actually growing. Over the last two years, Crescent Energy’s oil production per day averaged 25.3% year-on-year growth while its natural gas production per day averaged 28.9% year-on-year growth. 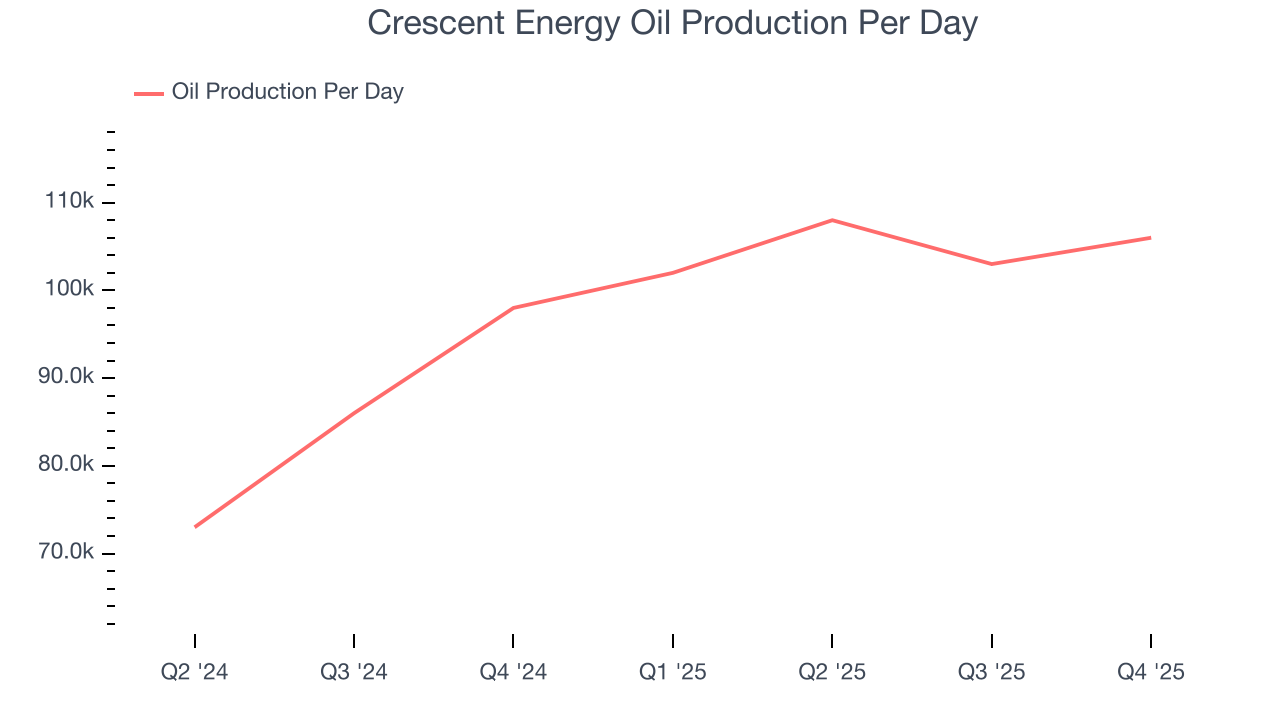
This quarter, Crescent Energy’s revenue fell by 1.2% year on year to $865 million but beat Wall Street’s estimates by 1.6%. This quarter, Crescent Energy reported year-on-year Oil production per day growth of 8.2%.
6. Gross Margin
While energy gross margins can be distorted by commodity prices, hedging, and short-term cost swings, sustained margins across a full cycle reflect a producer’s underlying asset quality, infrastructure position, and cost structure.
Crescent Energy, which averaged 58.5% gross margin over the last five years, exhibits good unit economics in the sector. It means the company will remain profitable at lower commodity prices than peers with inferior gross margins and serves as an encouraging starting point for ultimate operating profits and free cash flow generation. 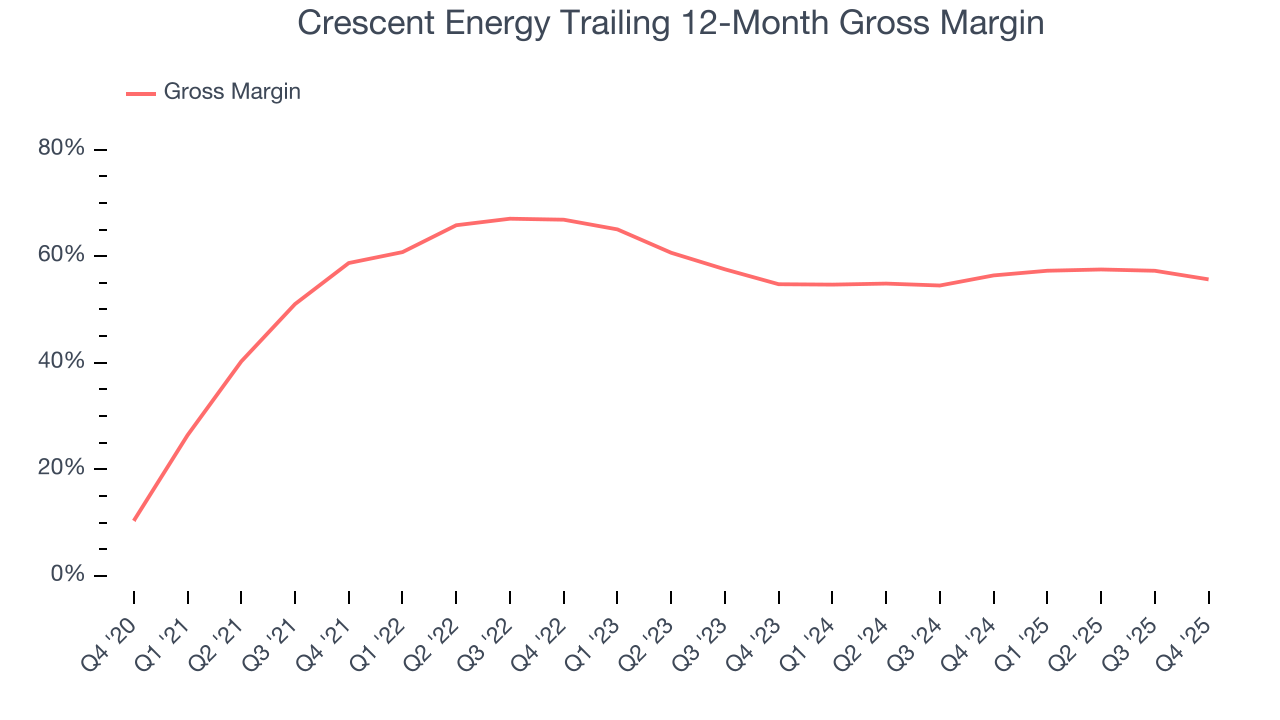
In Q4, Crescent Energy produced a 52.9% gross profit margin , marking a 6.7 percentage point decrease from 59.6% in the same quarter last year. Note that energy margins can be volatile due to commodity price changes.
7. Adjusted EBITDA Margin
Adjusted EBITDA margin strips out accounting distortions tied to depletion and historical drilling spend, providing a clearer view of the cash-generating power of the underlying asset base before financing and reinvestment decisions.
Crescent Energy has been an efficient company over the last five years. It was one of the more profitable businesses in the energy upstream and integrated energy sector, boasting an average EBITDA margin of 48.1%.
Looking at the trend in its profitability, Crescent Energy’s EBITDA margin decreased by 14.9 percentage points over the last year. Even though its historical margin was healthy, shareholders will want to see Crescent Energy become more profitable in the future.
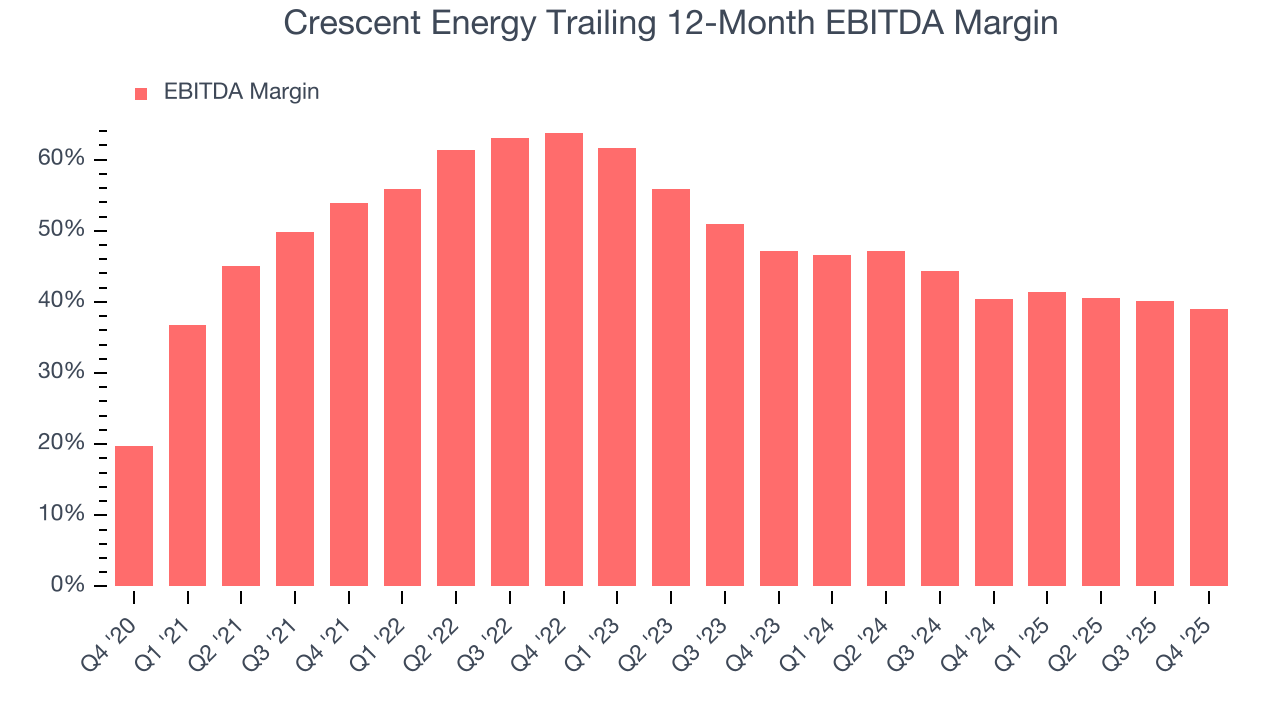
This quarter, Crescent Energy generated an EBITDA margin profit margin of 27.2%, down 4.9 percentage points year on year. This contraction shows it was less efficient because its expenses increased relative to its revenue. This adjusted EBITDA fell short of Wall Street’s estimates.
8. Cash Is King
As mentioned above, adjusted EBITDA ignores capital structure and drilling expenditure decisions. These are two huge aspects of an Energy producer, so in order to understand a comprehensive picture of business quality, an investor needs to account for these. Said differently, adjusted EBITDA margins could be solid but free cash flow is abysmal because decline rates of the asset are extreme and the drilling is expensive. Free cash flow tells you about not only the economics of the production that has happened but how much it costs to stay in business as well (further drilling or extraction).
Crescent Energy has shown robust cash profitability, driven by its attractive business model that enables it to reinvest or return capital to investors. The company’s free cash flow margin averaged 15.8% over the last five years, quite impressive for an upstream and integrated energy business.
While the level of free cash flow margins is important, their consistency matters just as much.
Crescent Energy’s ratio of quarterly free cash flow volatility to WTI crude price volatility over the past five years was 5.3 (lower is better), indicating excellent insulation from commodity swings. This stability supports capital access in downturns and positions Crescent Energy to act as a consolidator when weaker peers are forced to retrench.
You may be asking why we wait until the free cash flow line to perform this stability analysis versus commodity prices. Why not compare revenue or EBITDA to WTI Crude prices in the case of Crescent Energy? Because what ultimately matters is not how much revenue or profit you earn when prices are high but how much cash you can generate when prices are low. Free cash flow is the superior metric because it includes everything from hedging prowess to growth and maintenance capex to management behavior during good times and bad.
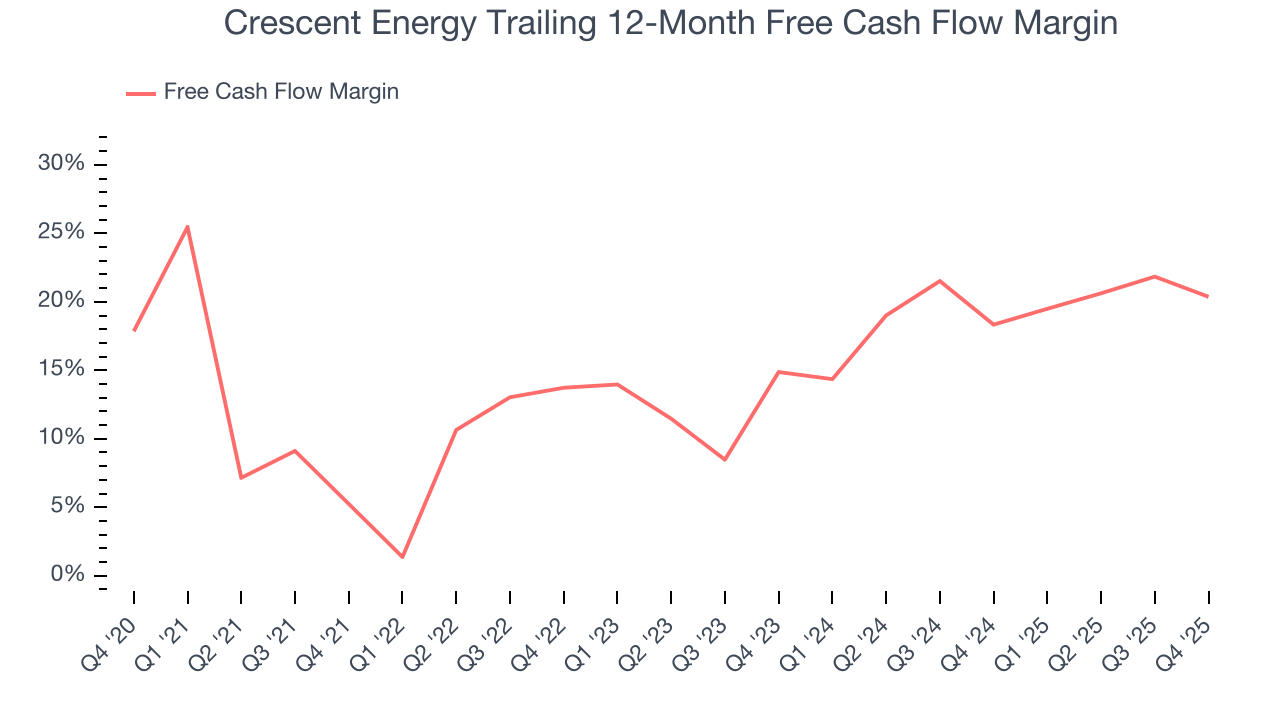
Crescent Energy’s free cash flow clocked in at $111.4 million in Q4, equivalent to a 12.9% margin. The company’s cash profitability regressed as it was 6.1 percentage points lower than in the same quarter last year, but we wouldn’t put too much weight on the short term because investment needs can be seasonal, causing temporary swings. Long-term trends are more important.
9. Balance Sheet Assessment
Crescent Energy reported $10.16 million of cash and $5.53 billion of debt on its balance sheet in the most recent quarter. As investors in high-quality companies, we primarily focus on two things: 1) that a company’s debt level isn’t too high and 2) that its interest payments are not excessively burdening the business.
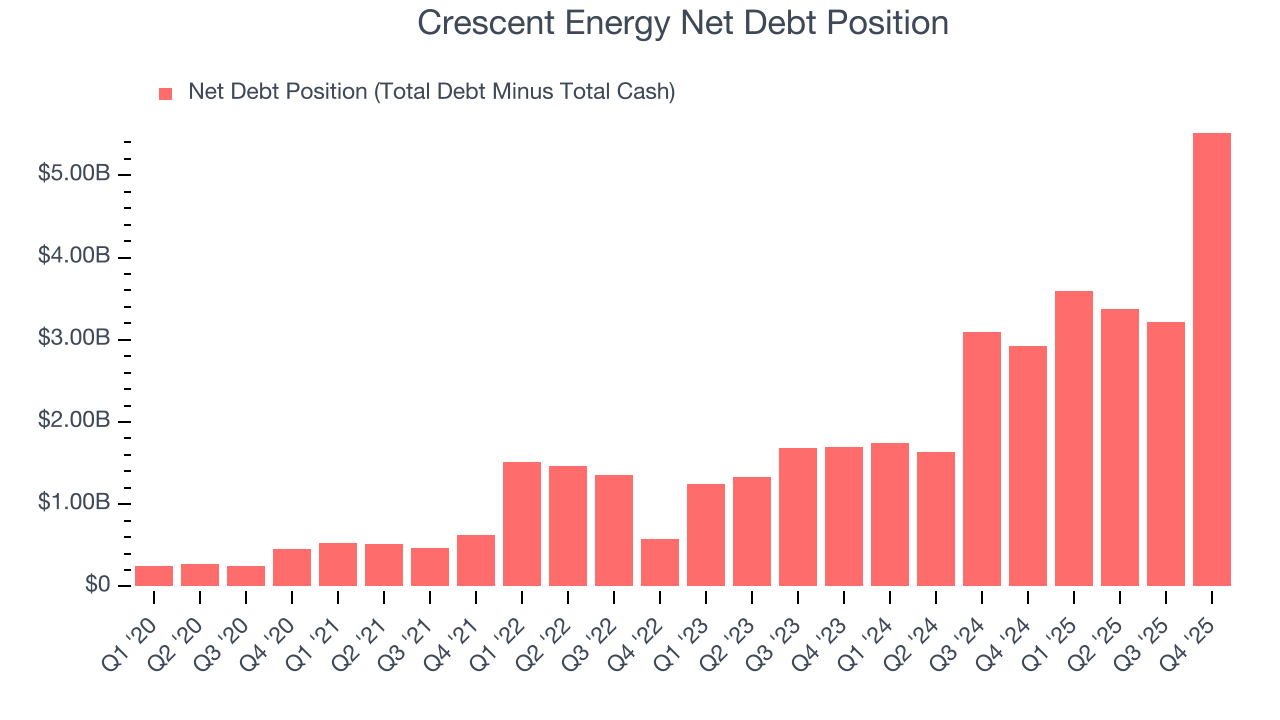
With $1.4 billion of EBITDA over the last 12 months, we view Crescent Energy’s 4.0× net-debt-to-EBITDA ratio as safe. We also see its $298.4 million of annual interest expenses as appropriate. The company’s profits give it plenty of breathing room, allowing it to continue investing in growth initiatives.
10. Key Takeaways from Crescent Energy’s Q4 Results
It was good to see Crescent Energy beat analysts’ EPS expectations this quarter. We were also happy its revenue outperformed Wall Street’s estimates. On the other hand, its EBITDA missed. Overall, this was a softer quarter. The stock remained flat at $12.40 immediately after reporting.
11. Is Now The Time To Buy Crescent Energy?
Updated: March 20, 2026 at 1:14 AM EDT
Before deciding whether to buy Crescent Energy or pass, we urge investors to consider business quality, valuation, and the latest quarterly results.
Crescent Energy is one of the best energy upstream and integrated energy companies out there. First of all, the company’s revenue growth over the last five years was top-tier for the sector. And while its declining EBITDA margin shows the business has become less efficient, its strong free cash flow generation allows it to invest in growth initiatives while maintaining an ample cushion. On top of that, Crescent Energy’s free cash flow volatility compared to commodity price volatility is low, demonstrating excellent free cash flow stability.
Crescent Energy’s P/E ratio based on the next 12 months is 8.9x. Looking across the spectrum of energy upstream and integrated energy businesses, Crescent Energy’s fundamentals clearly illustrate it’s a special business. We’re pounding the table at this bargain price.
Wall Street analysts have a consensus one-year price target of $14.71 on the company (compared to the current share price of $12.42), implying they see 18.5% upside in buying Crescent Energy in the short term.